Statistics Questions and Answers

Math
StatisticsThe student council at a high school is conducting a survey to get feedback from students about a recent school event. This is one of the questions the student council included on the survey:
Yes or no? Would you attend another school event that included the same food and entertainment?
Which statement is true about the question?
A. The question is an appropriate survey question.
B. The question is an inappropriate survey question because it uses absolute language.
C. The question is an inappropriate survey question because it is a leading question.
D. The question is an inappropriate survey question because it is a double-barreled question.

Math
StatisticsThe average family spends $112 at the grocery store each week with a standard deviation of $35. Assuming that the amount a family spends on groceries follows a normal distribution, solve for the percentage of families that spend:
1. less than $56?
2. more than $131?
3. between $56 and $131
Include your work with your answer to receive full credit.

Math
StatisticsDustin and Melanie are playing a game where they roll 2 standard 6-sided number cubes and find the sum of their outcomes. Each player gets a chance to guess the correct sum, and the player who guesses the correct sum wins the game.
Dustin decides to guess a sum of 6. Melanie decides to guess a sum of 7.
Which player made the better decision?

Math
StatisticsSuppose that prices of a certain model of new homes are normally distributed with a mean of $150,000. Use the 68-95-99 7 rule to find the percentage of buyers who paid between $150,000 and $156,000, if the standard deviation is $2,000
A. 49.85%
B. 47.5%
C. 99.7%
D. 34%

Math
StatisticsA sports academy decides to survey athletes at the academy about how closely they follow their recommended nutrition plan. Coaches at the academy are responsible for administering the surveys. Each coach will have a one-on-one discussion with each of their athletes in which they will ask the athlete the survey questions and write down their responses.
What is a source of bias in this sampling method?
A. It is less likely athletes will reveal to their coach that they do not follow their nutrition plan.
B. Some athletes may be injured that day and unable to complete the survey.
C. Most athletes do not follow recommended nutrition plans.
D. Some athletes may be sick that day and unable to complete the survey.

Math
StatisticsThe officers of a neighborhood association want to know whether residents are
interested in beautifying the neighborhood and, if so, how much money they are willing
to contribute toward the costs involved. The officers are considering two methods for
gathering data:
Method A: Call and survey every tenth resident on the association's roster.
Method B: Randomly select and survey 10 residents from among those who come to the
neighborhood block party.
Which sampling method is most likely to result in a representative sample of the
population; Method A or Method B?

Math
StatisticsA political strategist believes that 58% of voters in a certain state support his candidate. He then commisions a poll of 800 voters and 53% of them support his candidate. Is there evidence at the .05 level of significance to refute the strategist's belief?
No, because the test value -3.15 is in the noncritical region.
No, because the test value -1.69 is in the noncritical region.
Yes, because the test value -2.87 is in the critical region. Yes, because the test value -3.15 is in the critical region.

Math
StatisticsMembers of a student council are designing a school float for a parade. They decide to poll 10% of the student body to get feedback about the theme they have chosen.
What would most likely happen if they decided to randomly sample 5% of the student body instead?
The sample proportion would more closely model the population proportion.
The sample proportion would not be affected.
The sample proportion would less closely model the population proportion.
There is not enough information to determine how the sample proportion would be affected.

Math
StatisticsDetermine if the statement is true or false. If the statement is false, rewrite it as a true statement.
The expected value of a random variable can never be negative.
Choose the correct answer below.
A. The statement is false. The expected value of a random variable can be negative.
B. The statement is true.
C. The statement is false. The expected value of a random variable is always 1.
D. The statement is false. The expected value of a random variable is always 0.
Math
StatisticsSuppose the disbursements of coffee from a off brand Keurig are normally distributed with a mean of 11.8 ounces and a standard deviation of .25 ounces. a.) Find the z-score of a cup of coffee that is 11.1 ounces. b.) Find the probability that the disbursement is less than 11.1 ounces?

Math
StatisticsThe graph of a normal distribution is shaped like
an exponential function
a straight line
a parabola
the letter N
a bell
a pyramid

Math
StatisticsThe average gas mileage of a certain model car is 27 miles per gallon.
If the gas mileages are normally distributed with a standard deviation of 1.5, find the probability that a car has a gas mileage of between 26.8 and 27.3 miles per gallon.
0.13
0.24
0.18
0.22

Math
StatisticsA soda machine dispenses abnormally distributed amounts of soda with a mean of 20 ounces and a standard deviation of 0.2 ounces. What is the probability of selecting a sample of eight bottles with a mean amount dispensed between 19.8 and 20.2 ounces?
Population Mean: μ =
Population Standard Deviation: σ =
Normally Distributed (yes or no):
Sample Sizes: n =
What does this mean? Can the problem be completed? (Yes or No):

Math
StatisticsA recent survey found that 69% of all adults over 50 wear glasses for driving. In a random sample of 70 adults over 50, what is the mean and standard deviation of those that wear glasses?
mean: 48.3; standard deviation: 6.95
mean: 48.3; standard deviation: 3.87
mean: 21.7; standard deviation: 3.87
mean: 21.7; standard deviation: 6.95

Math
StatisticsThe Academy of Orthopedic Surgeons states that 80% of women wear shoes that are too small for their feet. A researcher wants to be 98% confident that this proportion is within 3% of the true proportion. How large a sample is necessary?
484
966
683
1183

Math
StatisticsWhich of the following best describes the process for finding the interquartile range for a set of data? *
Find the difference between the Maximum and Minimum values in the data set.
ADD Q1 and Q3 and divide by 2.
ADD the biggest and smallest values in the data set.
Place the numbers in order from least to greatest and find the middle.
SUBTRACT Q1 from Q3.

Math
StatisticsThe Internal Revenue Service claims that the mean wait time for callers during a recent tax filing season was less than 7 minutes. A random sample of 11 callers had a mean wait time of 6.7 minutes and a standard deviation of 3.2 minutes. Does the data support the idea that the wait time was less than 7 minutes. Use a 5% level of significance.

Math
StatisticsUse TVM Solver on your calculator to answer the following questions. Round each answer to the nearest cent.
You deposit $300 each month into an account earning 8% interest compounded monthly.
a) How much will you have in the account in 15 years?
b) How much total money will you put into the account?
c) How much total interest will you earn?
Math
StatisticsA climate scientist wishes to estimate the mean high
temperature in Jarkarta, Indonesia.
She selects a random of 30 days, and records the
high temperature; the mean of the
sample is 89.7° F, and the standard deviation
is s = 6.2°F.
Use this data to construct a 90% confidence
interval for the true mean high temperature.
87.39<µ< 92.01
87.78 <µ< 91.62
86.58 <µ< 92.82
87.79 <µ< 91.61
Math
StatisticsWhich of the following statements is false regarding randomization?
A Randomization protects against unknown factors.
B.Randomization allows each member of the population to have an equal probability of being selected for the sample population.
C. Randomization can be replaced by accurately matching the sample to the population.
D. Randomization helps avoid bias.
Math
StatisticsA laboratory tested 73 chicken eggs and found that the mean amount of cholesterol was 247 milligrams; the population SD for all eggs is a = 15.2 milligrams.
Use this data to construct a 95 percent confidence interval for the true mean cholesterol content, m, of all such eggs.
244 <m < 250
243 <m< 249
245 <m < 251
243 <m < 250
Math
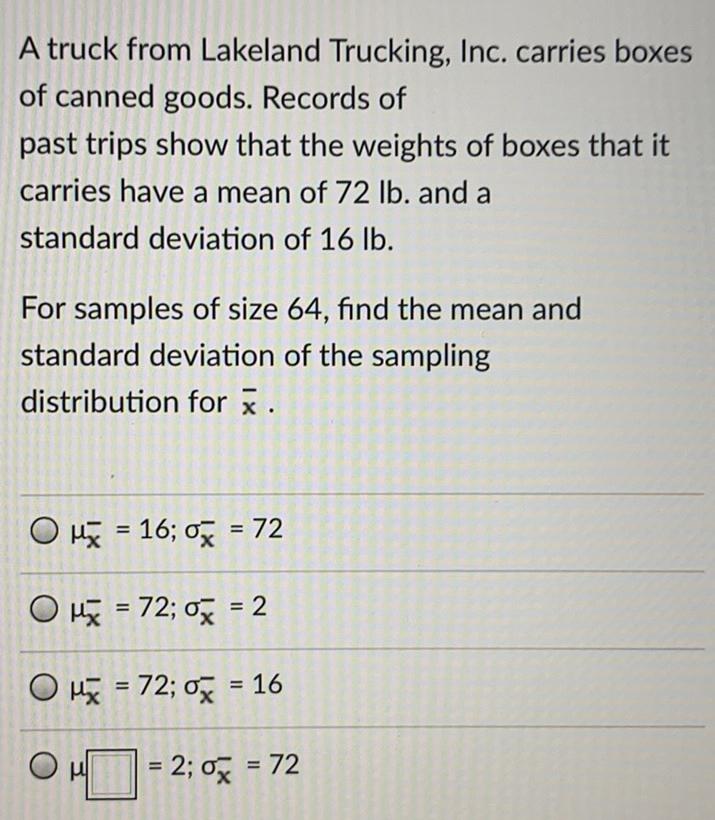
StatisticsA truck from Lakeland Trucking, Inc. carries boxes of canned goods. Records of past trips show that the weights of boxes that it carries have a mean of 72 lb. and a standard deviation of 16 lb. For samples of size 64, find the mean and standard deviation of the sampling distribution for x.
Math
StatisticsFind the standard deviation for the group of data items.
6, 6, 9, 9, 9, 9
The standard deviation is
Math
StatisticsFind the standard deviation for the following group of data items.
6, 9, 9, 15
The standard deviation is approximately
Math
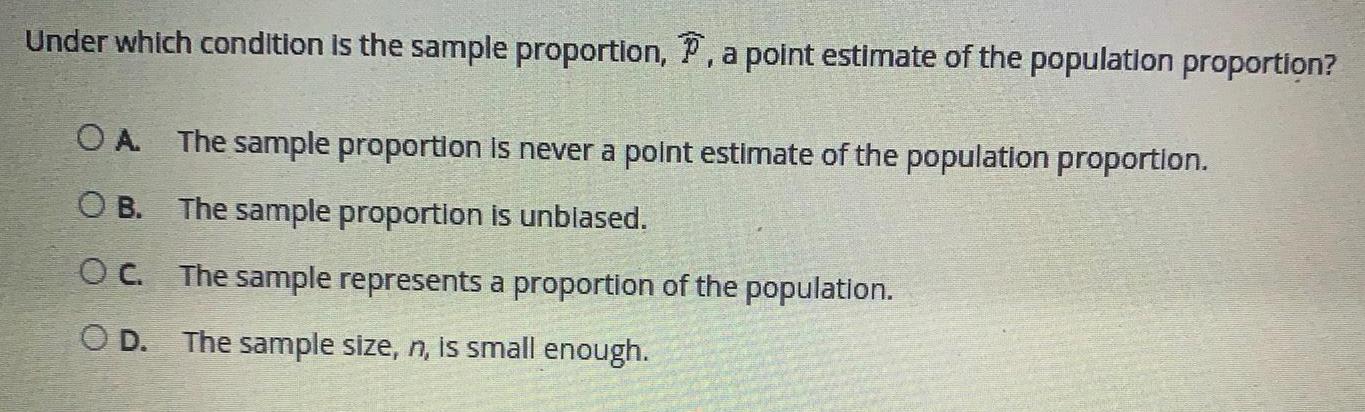
StatisticsUnder which condition is the sample proportion, P, a point estimate of the population proportion?
A. The sample proportion is never a point estimate of the population proportion.
B. The sample proportion is unbiased.
C. The sample represents a proportion of the population.
D. The sample size, n, is small enough.
Math
StatisticsAt one college, the distributions of GPA's is bell- shaped with a mean of 2.8 and a standard deviation of 0.4.
According to the Empirical rule, about what percentage of students at the college have a GPA between 2.4 and 3.2?
99.74%
95.44%
84.13%
68.26%
Math
StatisticsIn order to be accepted into a top university, applicants must score within the top 5% on the SAT exam. Given that the test has a mean of 1000 and a standard deviation of 200, what is the lowest possible score a student needs to qualify for acceptance into the university?
1250
1100
1329
1400

Math
StatisticsThe heights of adult men in America are normally distributed, with a mean of 69.3 inches and a standard deviation of 2.63 inches. The heights of adult women in America are also normally distributed, but with a mean of 64.4 inches and a standard deviation of 2.52 inches.
a) If a man is 6 feet 3 inches tall, what is his z-score (to two decimal places)?
Z=
b) What percentage of men are SHORTER than 6 feet 3 inches? Round to nearest tenth of a percent.
%
c) If a woman is 5 feet 11 inches tall, what is her z-score (to two decimal places)?
Z=
d) What percentage of women are TALLER than 5 feet 11 inches? Round to nearest tenth of a percent.
%

Math
StatisticsThe number of cartoons watched by Mrs. Kelly's first grade class on Saturday morning is shown below:
X P(x)
0 0.15
1 0.20
2 0.30
3 0.10
4 0.20
5 0.05
Find the probability that a student watches at most two cartoons.
0.85
0.20
0.35
0.65

Math
StatisticsThe population of rabbits on an island is growing exponentially. In the year 2001, the population of rabbits was 2400, and by 2004 the population had grown to 2900. Predict the population of rabbits in the year 2012, to the nearest whole number.

Math
Statistics6 calculate how much you can borrow with a $800 per month payment at today's mortgage rates and determine if it would be enough money to purchase the home you selected in #4. Do this for BOTH loans.
a. For a 30-year mortgage. State your findings in a complete sentence.

Math
StatisticsA sample of 14 squirrels were found to have an average weight of 9.8 ounces
with a sample standard deviation is 0.30.
Use this data to find the 95% confidence interval of the true mean weight.
(9.59, 10.01)
(8.92, 10.68)
(9.63, 9.97)
(9.72, 9.88)

Math
StatisticsA tire company tested a particular model of super radial tire and found the tires to be normally distributed with respect to wear. The "average" (mean) tire wore out at 59,000 miles, and the standard deviation was 2500 miles.
a. If 2000 tires are tested, about how many are likely to wear out before 54,000 miles?
b. What if the company wanted to guarantee 55,000 miles? What percent of the tires are likely to wear out before 55,000 miles? In this case, you cannot get an "exact" answer. What could you do to increase the accuracy of your estimate?

Math
StatisticsSuppose you and your brother each invest $5000 in a bank account. Both banks offer 6.5% annual interest. However, your brother's account is compounded annually, while yours is compounded monthly.
a. How much do each of you have in your accounts after 3 years?
b. How much more is your account worth than your brother's after 100 years? Find the Absolute difference (one is this many dollars more than the other) and the relative difference (one is this percent more than the other).
c. What is the r ='annual percentage yield' for the account that is compounded monthly?

Math
StatisticsA report states that 42% of home owners had a vegetable garden. How large a sample is needed to estimate the true proportion of home owners who have vegetable gardens to within 3% with 96% confidence?
672
1142
336
571

Math
StatisticsAn insurance company will insure a $220,000 home for its total value for an annual premium of
$510.
The company spends $30 per year to service such a policy, and the probability of total loss for such a home in a given year is 0.001.
Assuming that either total loss or no loss will occur, what is the company's expected annual
gain (or profit) on each such policy?
-$220
$260
$290
$210

Math
StatisticsA random sample of 16 light bulbs has a mean life of 650 hours and a standard deviation of 32 hours. Assume the population has a normal distribution. Construct a 90% confidence interval for the population mean. (Answer in 2 decimal places.)

Math
StatisticsThe pulse rates of 174 randomly selected adult males vary from a low of 35 bpm to a high of 115 bpm. Find the minimum sample size required to estimate the mean pulse rate of adult males. Assume that we want 99% confidence that the sample mean is within 4 bpm of the population mean. Complete parts (a) through (c) bela
a. Find the sample size using the range rule of thumb to estimate σ.
n= (Round up to the nearest whole number as needed.)

Math
StatisticsCompute the ordinary interest, the exact interest, and their difference. Round answers to the nearest cent.
Ordinary Exact
Principal, Rate, and Time Interest Interest Difference
$3,650 at 8% for 75 days
$294.10, $292.00, $2.10
$73.00, $60.00, $13.00
$60.83, $60.00, $0.83
$60.83, $59.00, $1.83

Math
StatisticsFind the critical value z necessary to form a confidence interval at the level of confidence shown below.
c=0.83
Z0=0

Math
StatisticsJoanna set a goal to drink more water daily. The number of ounces of water she drank each of the last seven days is shown below.
60, 58, 64, 64, 68, 50, 57
On the eighth day, she drinks 82 ounces of water. Select all the true statements about the effect of the eighth day's amount on Joanna's daily amount distribution.
The average daily amount of water is the same with or without the inclusion of the eighth day's amount.
The interquartile range of the data decreases when the eighth day's amount is included in the data.
The median amount of water is the same with or without the inclusion of the eighth day's amount.
The median amount of water is higher when the eighth day's amount is included in the data.
The interquartile range of the data increases when the eighth day's amount is included in the data.

Math
StatisticsLet Z be a standard normal random variable. Calculate the following probabilities using the ALEKS calculator. Round your responses to at least three decimal places.
(a) P(Z > -1.25) =
(b) P(Z ≤ 1.70) =
(c) P(-0.66 <2<2.15) = 0

Math
StatisticsIf a simple random sample is taken, and a 90% confidence interval of 1.53 <o<
2.08 is constructed from the sample statistic, s, the following is the correct
interpretation: "We are 90 % confident that the interval from 1.53 to 2.08 actually
does contain

Math
StatisticsThe mean SAT score in mathematics is 519. The founders of a nationwide SAT preparation course claim that graduates of the course score higher, on average, than the national mean. Suppose that the founders of the course want to carry out a hypothesis test to see if their claim has merit. State the null hypothesis Ho and the alternative hypothesis H, that they would use.

Math
StatisticsThe half-life of gold-194 is approximately 1.6 days.
How much of a 15 gram sample of gold-194 would remain after 4 days? Round to three decimal places.

Math
StatisticsThunderstorm Speeds A meteorologist who sampled 11 thunderstorms found that the average speed at which they traveled across a certain state was 13 miles per hour. The standard deviation of the sample was 1.7 miles per hour. Use a graphing calculator and round the answers to at least one decimal place.
Find the 82% confidence interval of the mean. Assume the variable is normally distributed.

Math
StatisticsHigh Cholesterol: A group of eight individuals with high cholesterol levels were given a new drug that was designed to lower cholesterol levels. Cholesterol levels, in milligrams per deciliter, were measured before and after treatment for each individual, with the following results:
(a) Construct a 99.8% confidence interval for the mean reduction in cholesterol level. Let d represent the cholesterol level before treatment minus the
cholesterol level after. Use tables to find the critical value and round the answers to at least one decimal place.

Math
StatisticsYour credit card has a balance of $1,200. Its interest rate is 20.5%. You have stopped using the card, because you don't want to go any deeper into debt. Each month, you make the minimum required payment. Your credit card issuer recently changed their minimum required payment policy, in response to the Bankruptcy Abuse Prevention and Consumer Protection Act of 2005. As a result, your minimum required payment is $48. (Round your answers to the nearest cent.)
(a) During the September 10 through October 9 billing period, you pay the minimum required payment on September 25th. Find the average daily balance, the finance charge and the new balance. (The new balance includes the finance charge.)

Math
StatisticsFor one week (five days) a student tracked their waiting time for parking at the college. The wait times
where: 14, 11, 12, 13, and 23 minutes.
Calculate the mean and median waiting time, rounded to 1 decimal place if needed.

Math
StatisticsNumber of Jobs A sociologist found that in a sample of 50 retired men, the average number of jobs they had during their lifetimes was 7.3. The population standard deviation is 2.3.
(a) Find the best point estimate of the mean.
The best point estimate of the mean is 7.3
(b) Find the 90% confidence interval of the mean number of jobs. Round intermediate and final answers to one decimal place.
(c) Find the 95% confidence interval of the mean number of jobs. Round intermediate and final answers to one decimal