Statistics Questions and Answers
Math
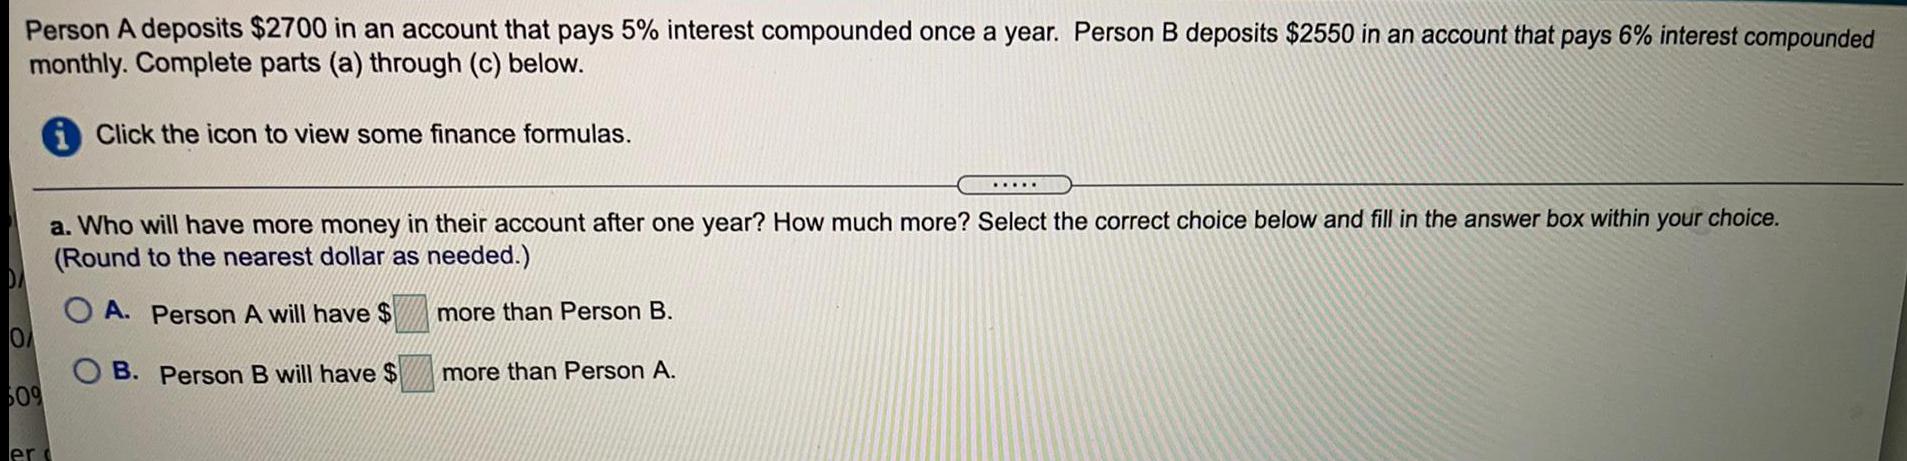
StatisticsPerson A deposits $2700 in an account that pays 5% interest compounded once a year. Person B deposits $2550 in an account that pays 6% interest compounded monthly. Complete parts (a) through (c) below.
a. Who will have more money in their account after one year? How much more? Select the correct choice below and fill in the answer box within your choice.
(Round to the nearest dollar as needed.)
A. Person A will have $ more than Person B.
B. Person B will have $ more than Person A.
Math
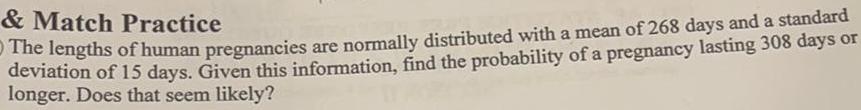
StatisticsThe lengths of human pregnancies are normally distributed with a mean of 268 days and a standard deviation of 15 days. Given this information, find the probability of a pregnancy lasting 308 days or longer. Does that seem likely?
Math
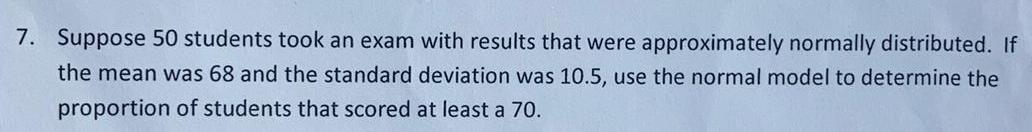
StatisticsSuppose 50 students took an exam with results that were approximately normally distributed. If the mean was 68 and the standard deviation was 10.5, use the normal model to determine the proportion of students that scored at least a 70.

Math
StatisticsThe area under a particular normal curve between 8 and 11 is 0.7794. A normally distributed variable has the same mean and standard deviation as the parameters for this normal curve. What percentage of all possible observations of the variable lie between 8 and 11?
Math
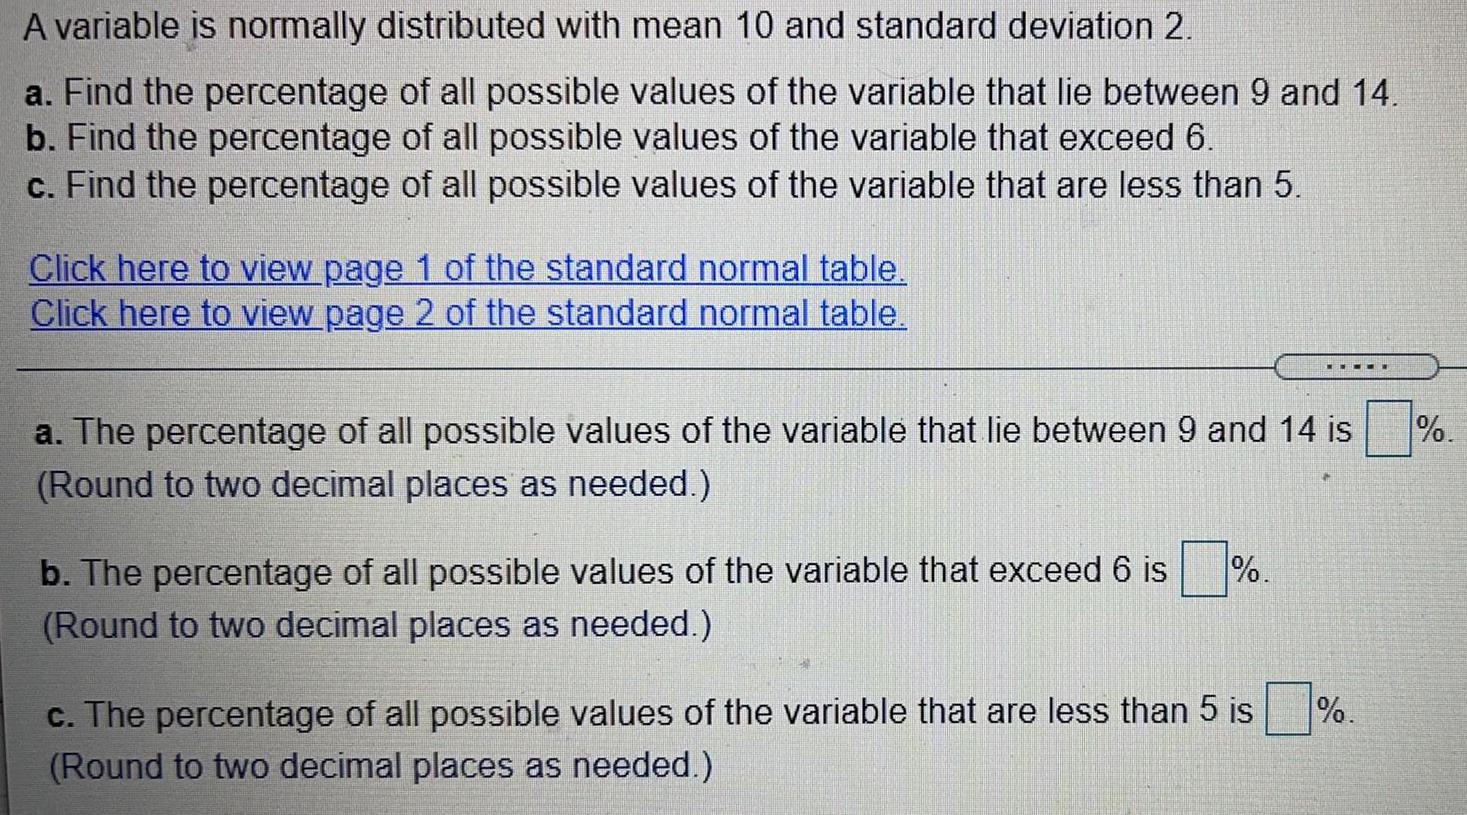
StatisticsA variable is normally distributed with mean 10 and standard deviation 2.
a. Find the percentage of all possible values of the variable that lie between 9 and 14.
b. Find the percentage of all possible values of the variable that exceed 6.
c. Find the percentage of all possible values of the variable that are less than 5.
Math
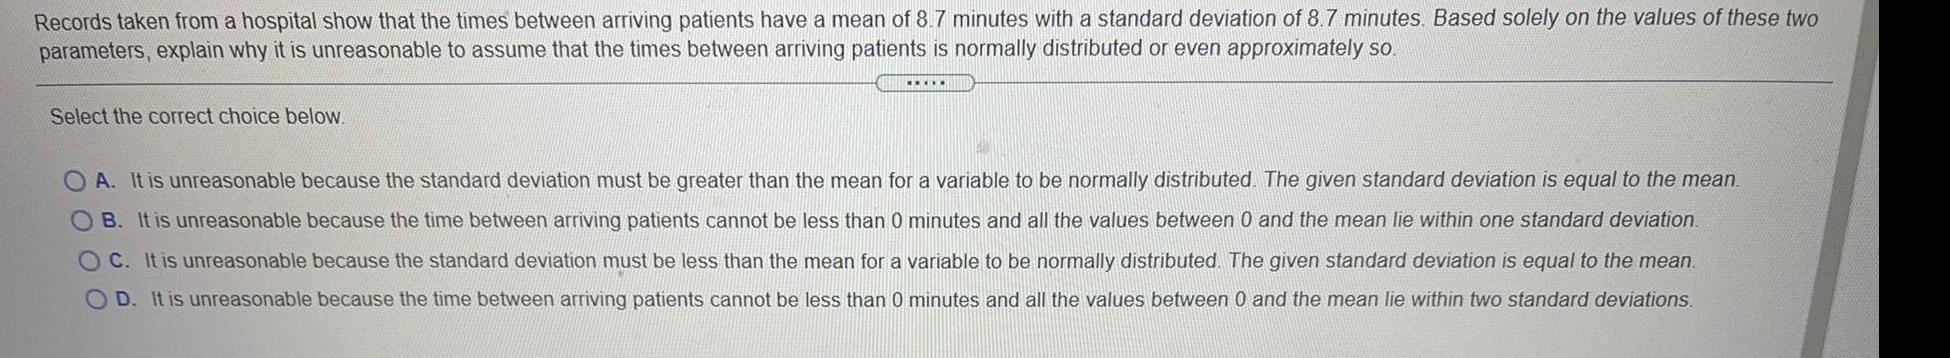
StatisticsRecords taken from a hospital show that the times between arriving patients have a mean of 8.7 minutes with a standard deviation of 8.7 minutes. Based solely on the values of these two
parameters, explain why it is unreasonable to assume that the times between arriving patients is normally distributed or even approximately so.
Select the correct choice below.
*****
A. It is unreasonable because the standard deviation must be greater than the mean for a variable to be normally distributed. The given standard deviation is equal to the mean.
B. It is unreasonable because the time between arriving patients cannot be less than 0 minutes and all the values between 0 and the mean lie within one standard deviation.
C. It is unreasonable because the standard deviation must be less than the mean for a variable to be normally distributed. The given standard deviation is equal to the mean.
D. It is unreasonable because the time between arriving patients cannot be less than 0 minutes and all the values between 0 and the mean lie within two standard deviations.
Math
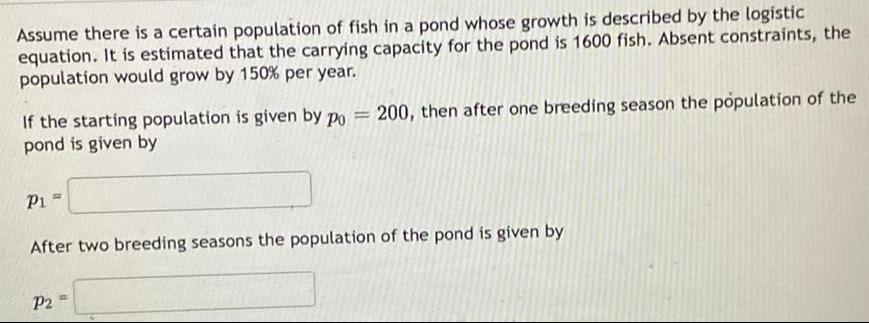
StatisticsAssume there is a certain population of fish in a pond whose growth is described by the logistic equation. It is estimated that the carrying capacity for the pond is 1600 fish. Absent constraints, the population would grow by 150% per year.
If the starting population is given by po = 200, then after one breeding season the population of the pond is given by
P1 =
After two breeding seasons the population of the pond is given by
P2=
Math
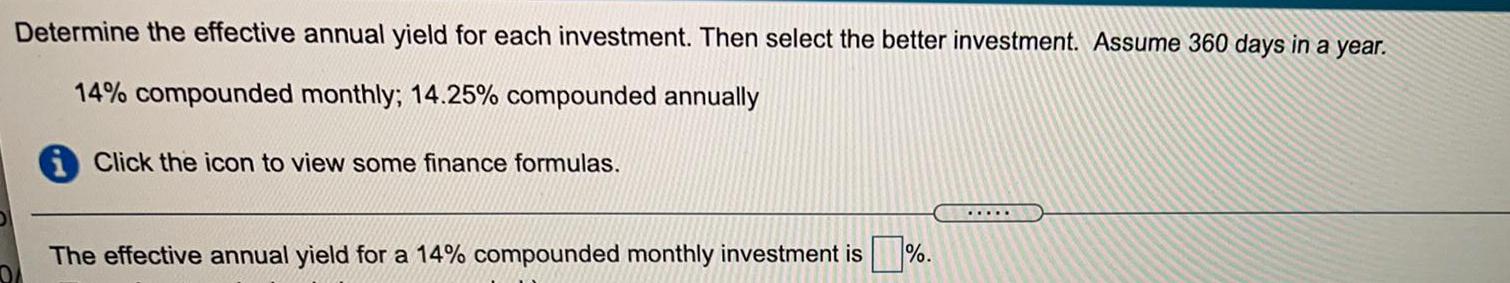
StatisticsDetermine the effective annual yield for each investment. Then select the better investment. Assume 360 days in a year.
14% compounded monthly; 14.25% compounded annually
The effective annual yield for a 14% compounded monthly investment is %.
Math
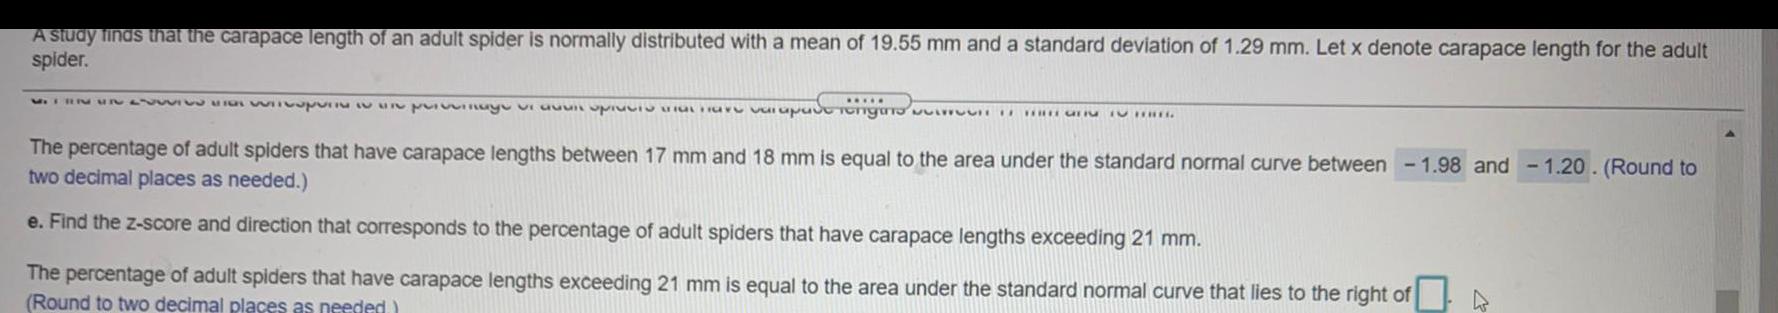
StatisticsA study finds that the carapace length of an adult spider is normally distributed with a mean of 19.55 mm and a standard deviation of 1.29 mm. Let x denote carapace length for the adult spider. VIIHNEN an permaye vi avvn sprecio a vapadorongan u THREE CER IV TREG The percentage of adult spiders that have carapace lengths between 17 mm and 18 mm is equal to the area under the standard normal curve between 1.98 and - 1.20. (Round to two decimal places as needed.)
e. Find the z-score and direction that corresponds to the percentage of adult spiders that have carapace lengths exceeding 21 mm.
The percentage of adult spiders that have carapace lengths exceeding 21 mm is equal to the area under the standard normal curve that lies to the right of
(Round to two decimal places as needed)
Math
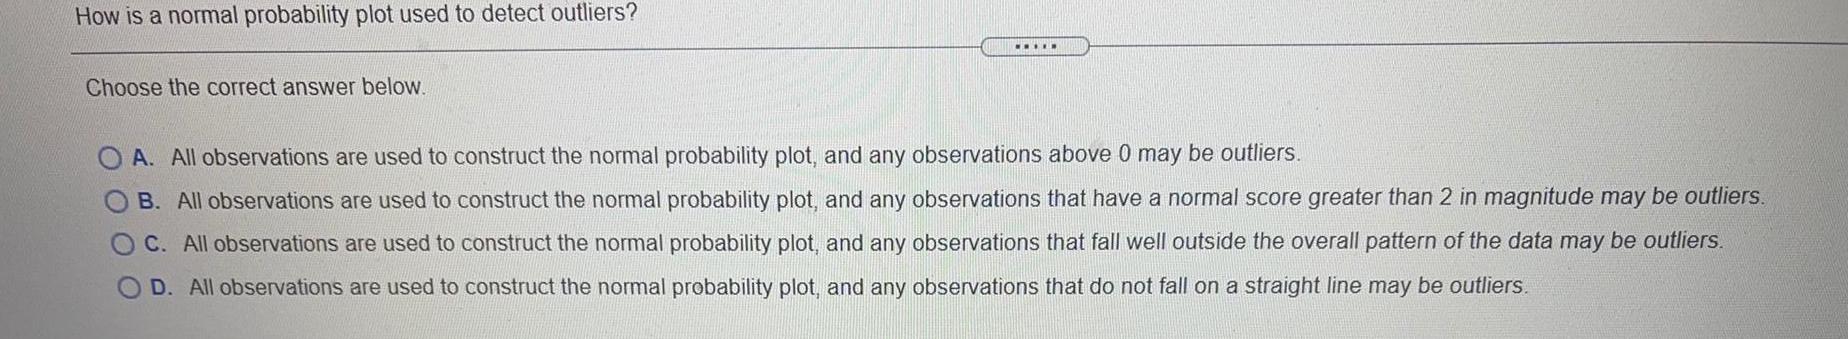
StatisticsHow is a normal probability plot used to detect outliers?
Choose the correct answer below.
A. All observations are used to construct the normal probability plot, and any observations above 0 may be outliers.
B. All observations are used to construct the normal probability plot, and any observations that have a normal score greater than 2 in magnitude may be outliers.
C. All observations are used to construct the normal probability plot, and any observations that fall well outside the overall pattern of the data may be outliers.
D. All observations are used to construct the normal probability plot, and any observations that do not fall on a straight line may be outliers.
Math
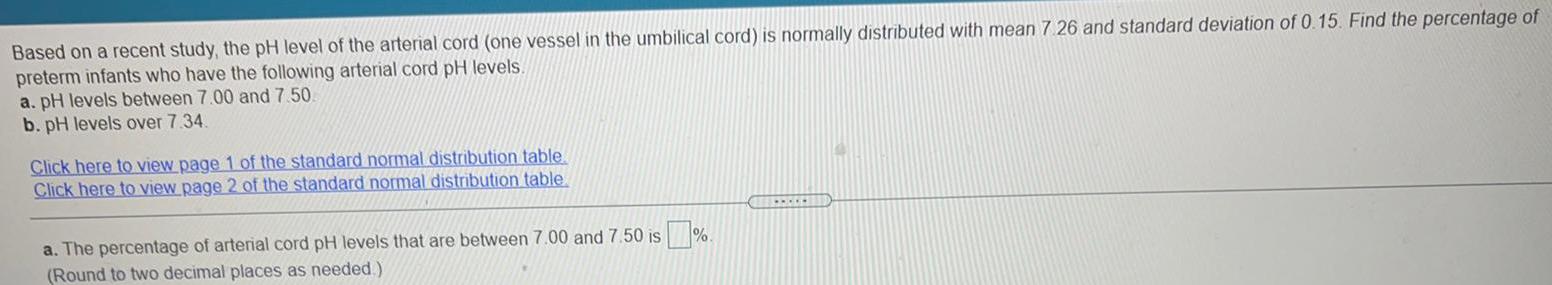
StatisticsBased on a recent study, the pH level of the arterial cord (one vessel in the umbilical cord) is normally distributed with mean 7.26 and standard deviation of 0.15. Find the percentage of preterm infants who have the following arterial cord pH levels.
a. pH levels between 7.00 and 7.50
b. pH levels over 7.34.
a. The percentage of arterial cord pH levels that are between 7.00 and 7.50 is
(Round to two decimal places as needed.)

Math
StatisticsYou invest $1950 in an account paying 5.9% interest compounded daily. What is the account's effective annual yield? Assume 360 days in a year.
Math
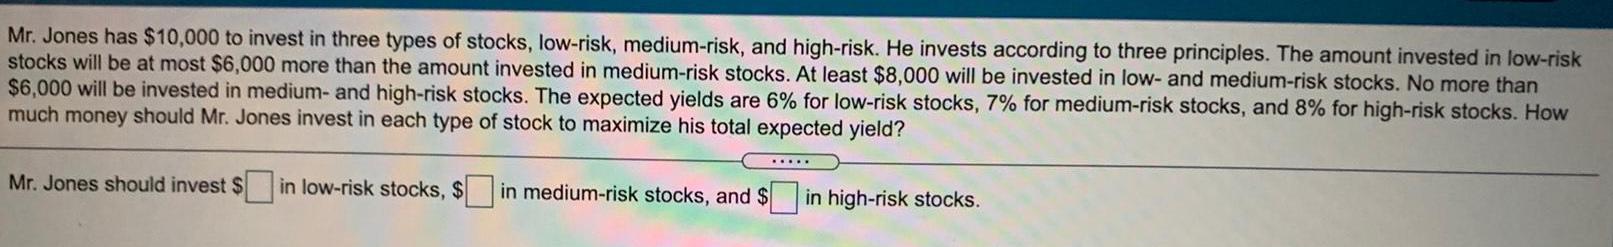
StatisticsMr. Jones has $10,000 to invest in three types of stocks, low-risk, medium-risk, and high-risk. He invests according to three principles. The amount invested in low-risk stocks will be at most $6,000 more than the amount invested in medium-risk stocks. At least $8,000 will be invested in low- and medium-risk stocks. No more than $6,000 will be invested in medium- and high-risk stocks. The expected yields are 6% for low-risk stocks, 7% for medium-risk stocks, and 8% for high-risk stocks. How much money should Mr. Jones invest in each type of stock to maximize his total expected yield?
Mr. Jones should invest $ in low-risk stocks, $ in medium-risk stocks, and $ in high-risk stocks.
Math
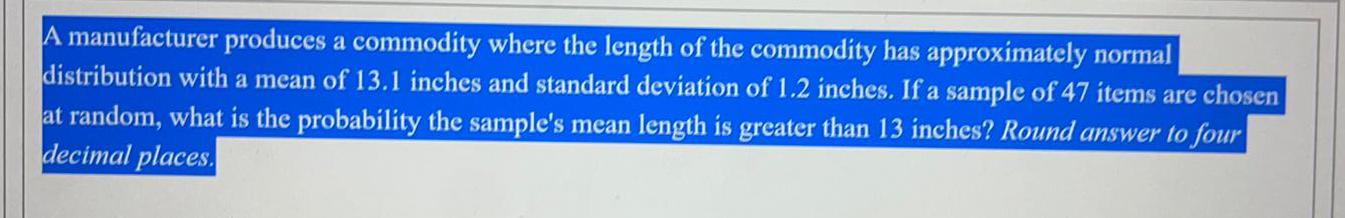
StatisticsA manufacturer produces a commodity where the length of the commodity has approximately normal distribution with a mean of 13.1 inches and standard deviation of 1.2 inches. If a sample of 47 items are chosen at random, what is the probability the sample's mean length is greater than 13 inches? Round answer to four decimal places.
Math
StatisticsA student deposits $300 in a savings account that pays 4% annual interest. At the end of 9 years, how much money will be in the savings account? Round your answer to the nearest cent.
The savings account will be worth $ at the end of 9 years.
Math
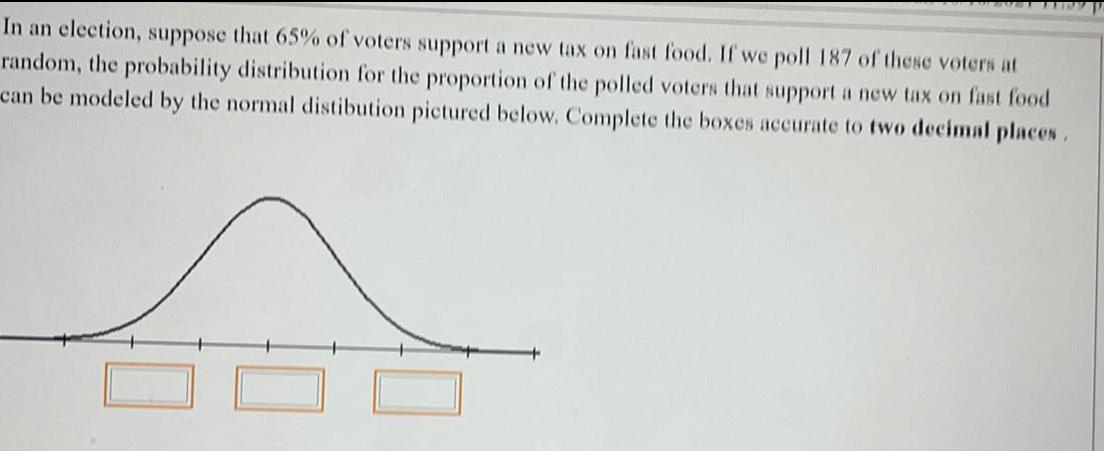
StatisticsIn an election, suppose that 65% of voters support a new tax on fast food. If we poll 187 of these voters at random, the probability distribution for the proportion of the polled voters that support a new tax on fast food can be modeled by the normal distibution pictured below. Complete the boxes accurate to two decimal places.
Math
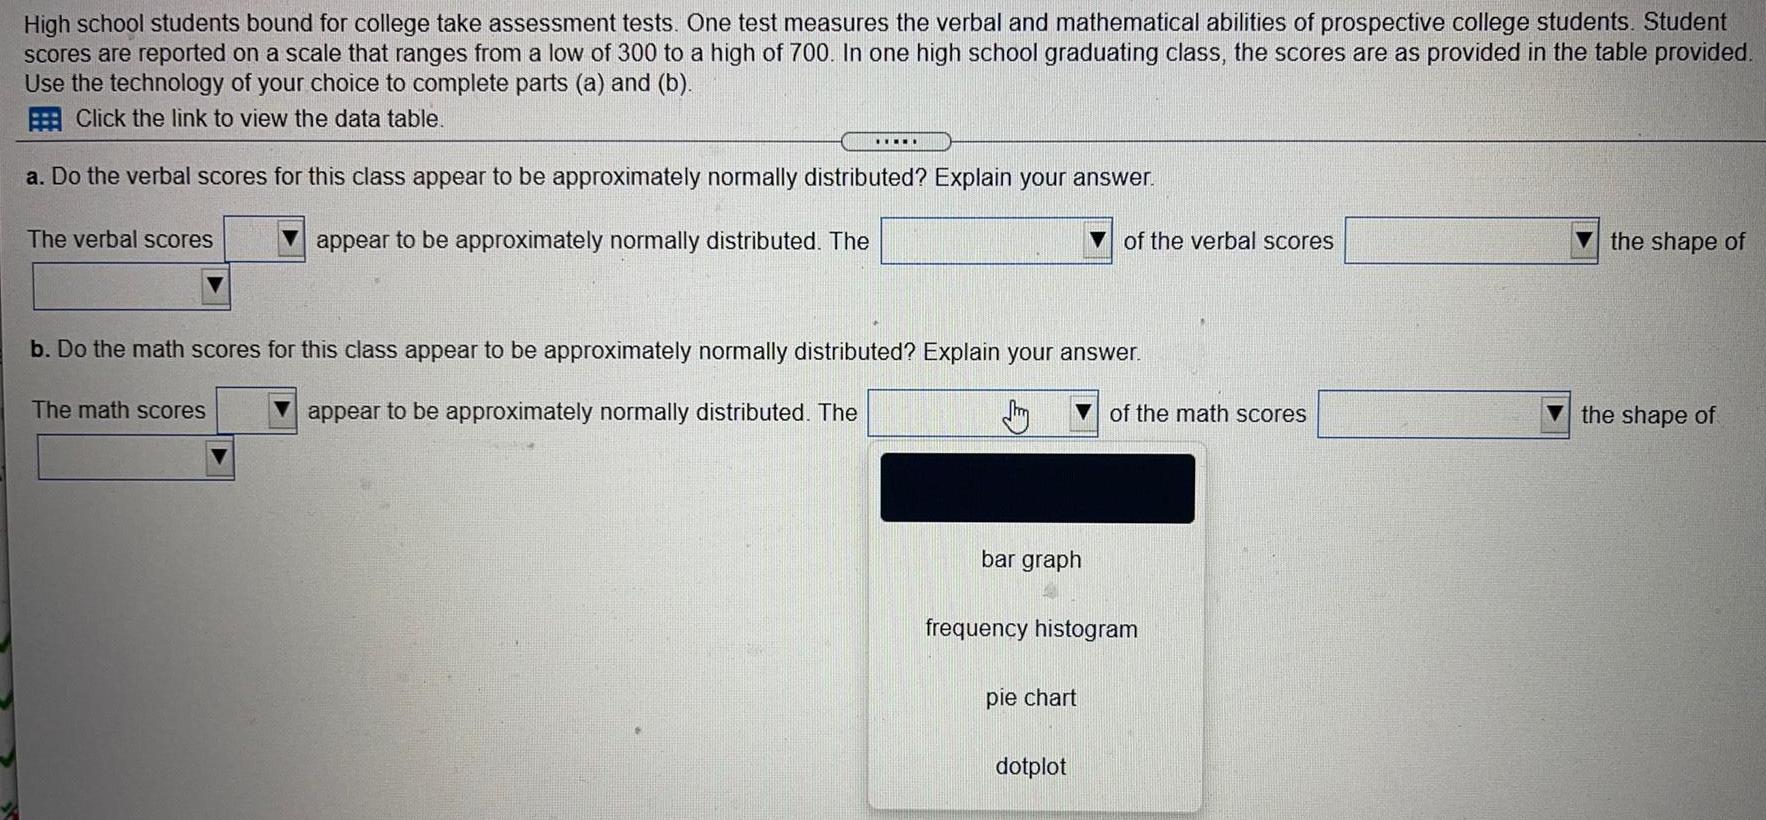
StatisticsHigh school students bound for college take assessment tests. One test measures the verbal and mathematical abilities of prospective college students. Student scores are reported on a scale that ranges from a low of 300 to a high of 700. In one high school graduating class, the scores are as provided in the table provided. Use the technology of your choice to complete parts (a) and (b). Click the link to view the data table.
Math
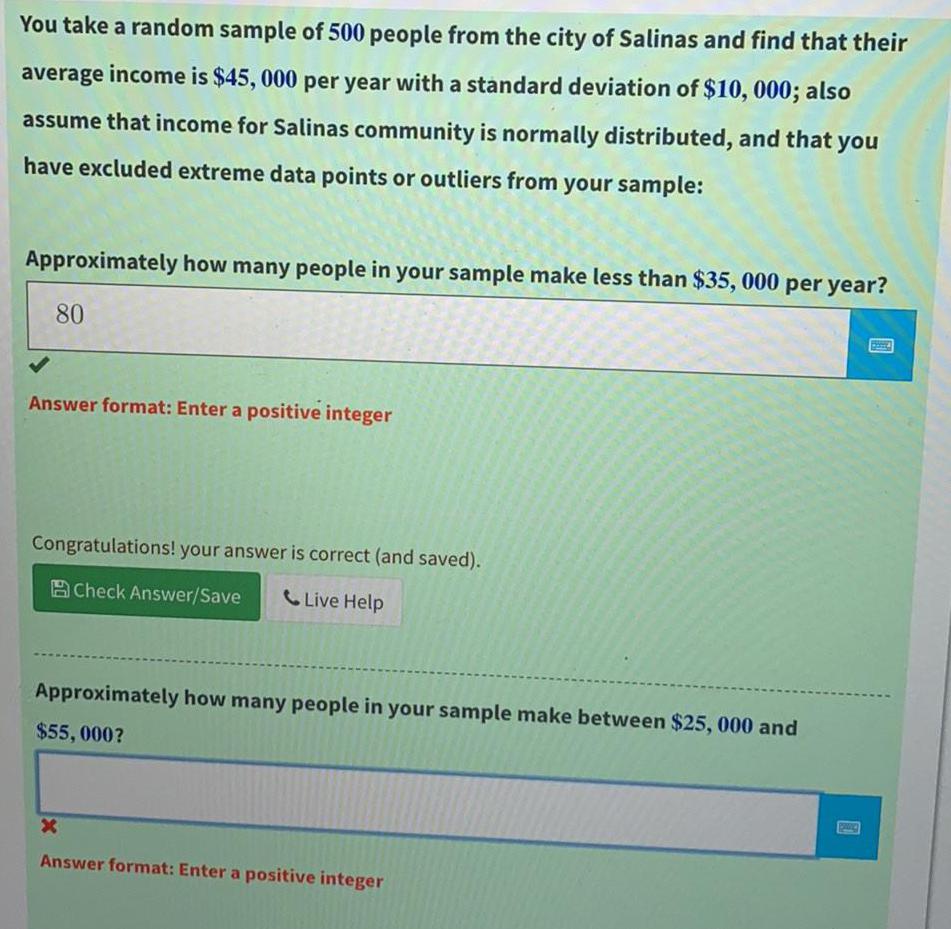
StatisticsYou take a random sample of 500 people from the city of Salinas and find that their
average e income is $45, 000 per year with a standard deviation of $10, 000; also
assume that income for Salinas community is normally distributed, and that you
have excluded extreme data points or outliers from your sample:
Approximately how many people in your sample make less than $35, 000 per year?
80
Answer format: Enter a positive integer
Congratulations! your answer is correct (and saved).
Check Answer/Save
Live Help
Approximately how many people in your sample make between $25,000 and
$55,000?
Answer format: Enter a positive integer
Math
StatisticsOn a common measure of extroversion, the general population has an average score of 51 with a standard deviation of 30.
he probability of a researcher randomly selecting an individual who has an extroversion score of 62 or more?
Math
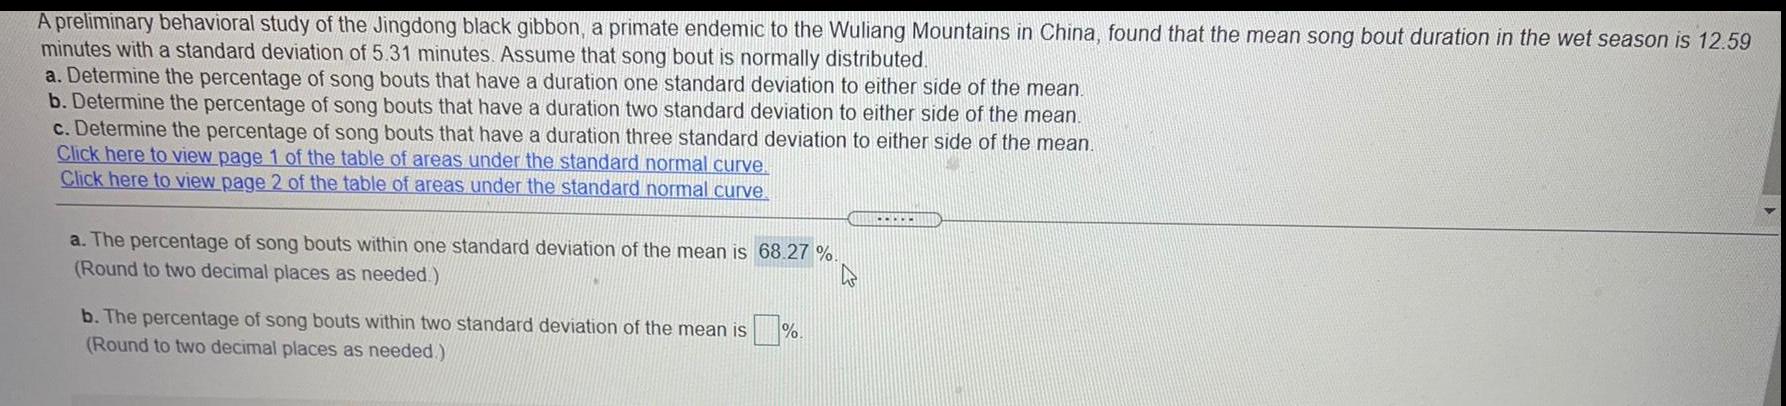
StatisticsA preliminary behavioral study of the Jingdong black gibbon, a primate endemic to the Wuliang Mountains in China, found that the mean song bout duration in the wet season is 12.59
minutes with a standard deviation of 5.31 minutes. Assume that song bout is normally distributed.
a. Determine the percentage of song bouts that have a duration one standard deviation to either side of the mean.
b. Determine the percentage of song bouts that have a duration two standard deviation to either side of the mean.
c. Determine the percentage of song bouts that have a duration three standard deviation to either side of the mean.
Click here to view page 1 of the table of areas under the standard normal curve.
Click here to view page 2 of the table of areas under the standard normal curve
a. The percentage of song bouts within one standard deviation of the mean is 68.27 %.
(Round to two decimal places as needed.)
b. The percentage of song bouts within two standard deviation of the mean is
(Round to two decimal places as needed.)
%
.....
Math
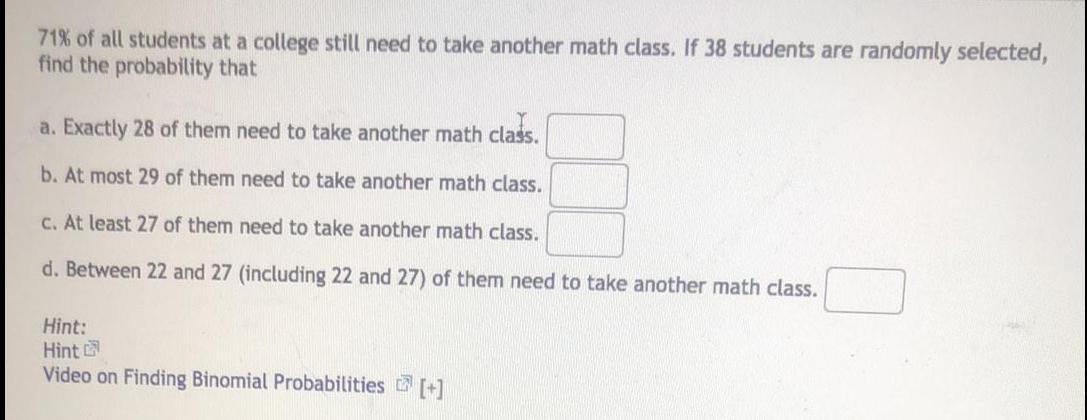
Statistics71% of all students at a college still need to take another math class. If 38 students are randomly selected, find the probability that
a. Exactly 28 of them need to take another math class.
b. At most 29 of them need to take another math class.
c. At least 27 of them need to take another math class.
d. Between 22 and 27 (including 22 and 27) of them need to take another math class.
Math
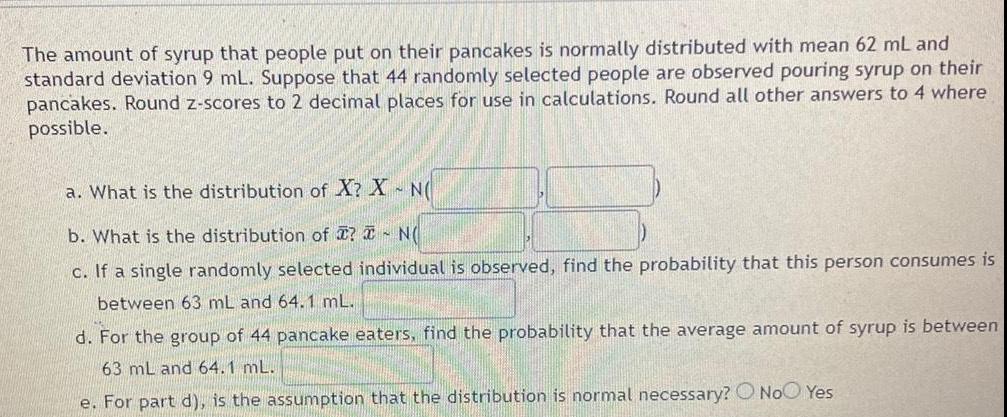
StatisticsThe amount of syrup that people put on their pancakes is normally distributed with mean 62 mL and standard deviation 9 mL. Suppose that 44 randomly selected people are observed pouring syrup on their pancakes. Round z-scores to 2 decimal places for use in calculations. Round all other answers to 4 where possible.
a. What is the distribution of X? X - N(
b. What is the distribution of ? - N(
c. If a single randomly selected individual is observed, find the probability that this person consumes is
d. For the group of 44 pancake eaters, find the probability that the average amount of syrup is between
e. For part d), is the assumption that the distribution is normal necessary?
Math
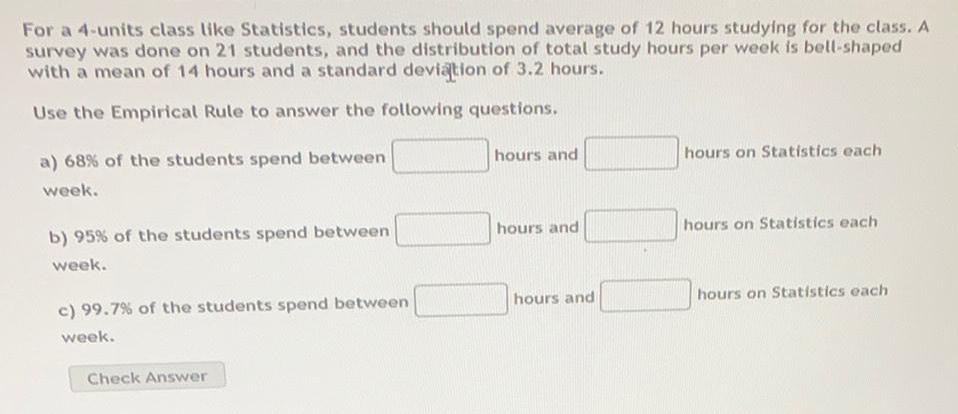
StatisticsFor a 4-units class like Statistics, students should spend average of 12 hours studying for the class. A
survey was done on 21 students, and the distribution of total study hours per week is bell-shaped
with a mean of 14 hours and a standard deviation of 3.2 hours.
Use the Empirical Rule to answer the following questions.
a) 68% of the students spend between
week.
b) 95% of the students spend between
week.
c) 99.7% of the students spend between
week.
Check Answer
hours and
hours and
hours and
hours on Statistics each
hours on Statistics each
hours on Statistics each
Math
StatisticsGoogle it: According to a report of the Nielsen Company, 86% of internet searches used the Google search engine. A sample of 100 searches is studied.
Use the Cumulative Normal Distribution Table or technology. Round your answer to four decimal places.
(a) Approximate the probability that more than 82 of the searches used Google.
The probability that more than 82 of the searches used Google was approximately
Math
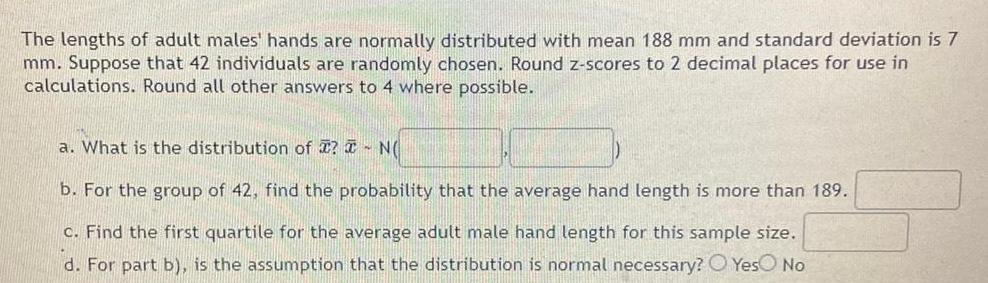
StatisticsThe lengths of adult males' hands are normally distributed with mean 188 mm and standard deviation is 7 mm. Suppose that 42 individuals are randomly chosen. Round z-scores to 2 decimal places for use in calculations. Round all other answers to 4 where possible.
a. What is the distribution of ? - N
b. For the group of 42, find the probability that the average hand length is more than 189.
c. Find the first quartile for the average adult male hand length for this sample size.
d. For part b), is the assumption that the distribution is normal necessary? Yes No
Math
StatisticsA Food Marketing Institute found that 26% of households spend more than $125 a week on groceries. Assume the population proportion is 0.26 and a simple random sample of 192 households is selected from the population. What is the probability that the sample proportion of households spending more than $125 a week is less than 0.25? There is a probability that the sample proportion of households spending more than $125 a week is less than 0.25. Round the answer to 4 decimal places, pm
Math
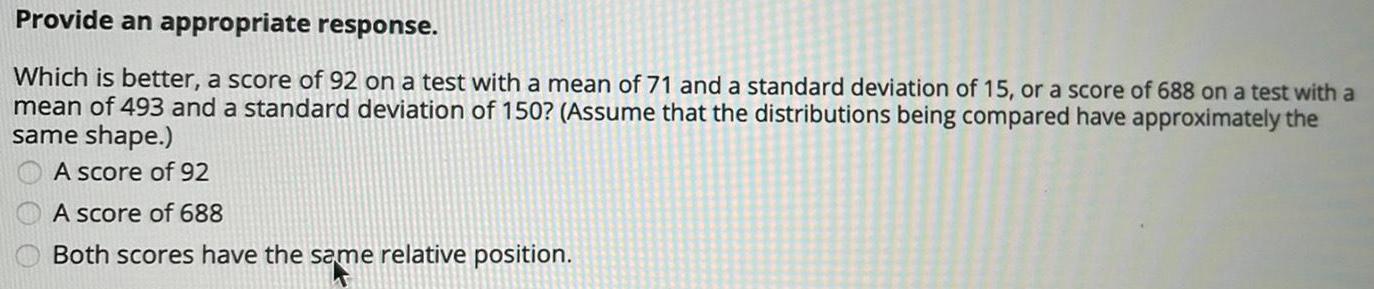
StatisticsWhich is better, a score of 92 on a test with a mean of 71 and a standard deviation of 15, or a score of 688 on a test with a mean of 493 and a standard deviation of 150? (Assume that the distributions being compared have approximately the same shape.)
A score of 92
A score of 688
Both scores have the same relative position.
Math
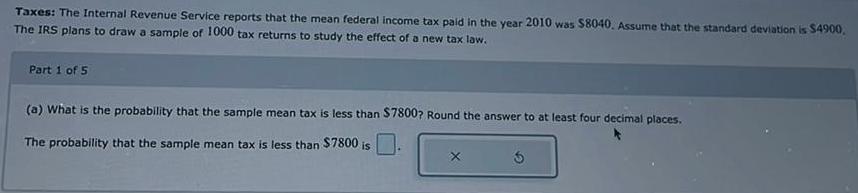
StatisticsTaxes: The Internal Revenue Service reports that the mean federal income tax paid in the year 2010 was $8040. Assume that the standard deviation is $4900,
The IRS plans to draw a sample of 1000 tax returns to study the effect of a new tax law.
(a) What is the probability that the sample mean tax is less than $7800? Round the answer to at least four decimal places.
Math
Statistics(a) Approximate the probability that 71 or more have hypertension.
The probability that 71 or more have hypertension is approximately.
Math
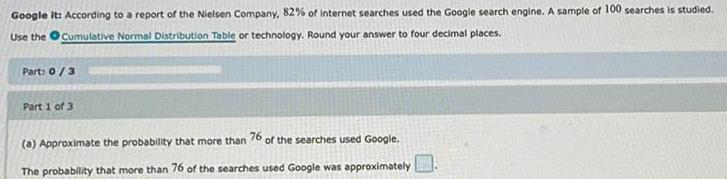
StatisticsGoogle it: According to a report of the Nielsen Company, 82% of internet searches used the Google search engine. A sample of 100 searches is studied.
Use the Cumulative Normal Distribution Table or technology. Round your answer to four decimal places.
(a) Approximate the probability that more than 76 of the searches used Google.
The probability that more than 76 of the searches used Google was approximately
Math
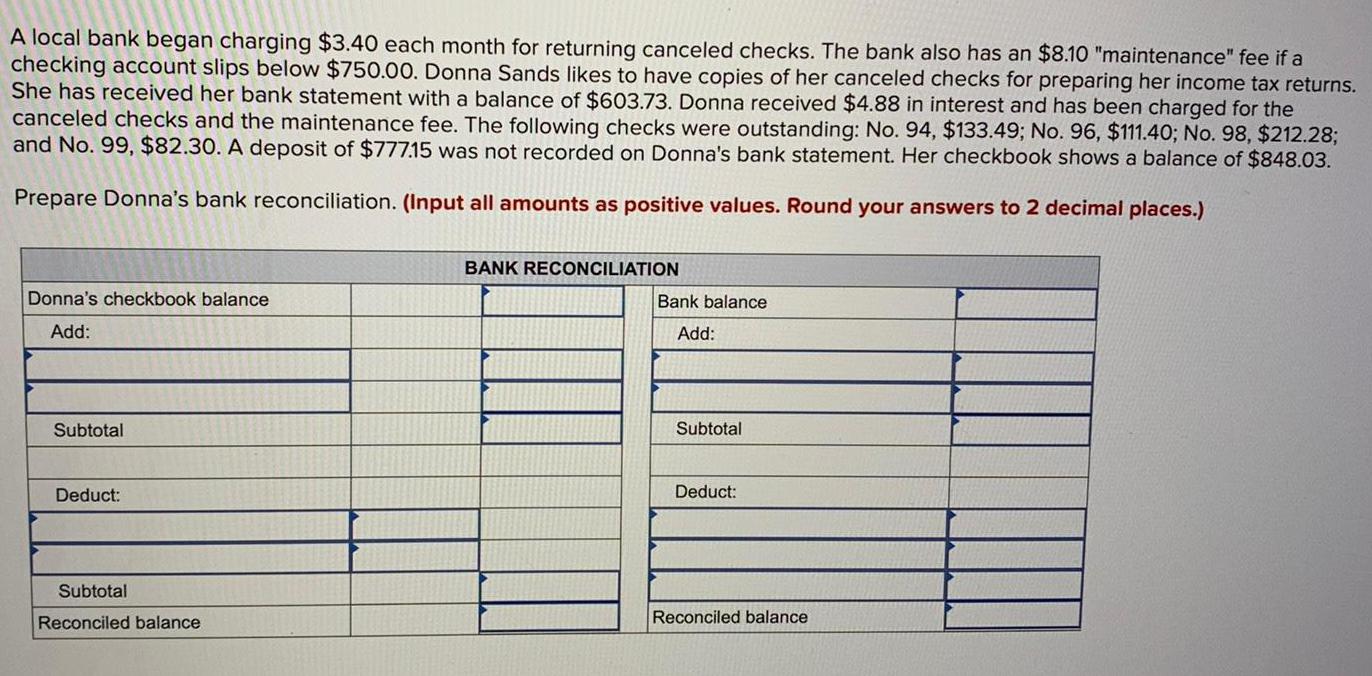
StatisticsA local bank began charging $3.40 each month for returning canceled checks. The bank also has an $8.10 "maintenance" fee if a checking account slips below $750.00. Donna Sands likes to have copies of her canceled checks for preparing her income tax returns. She has received her bank statement with a balance of $603.73. Donna received $4.88 in interest and has been charged for the canceled checks and the maintenance fee. The following checks were outstanding: No. 94, $133.49; No. 96, $111.40; No. 98, $212.28; and No. 99, $82.30. A deposit of $777.15 was not recorded on Donna's bank statement. Her checkbook shows a balance of $848.03.
Prepare Donna's bank reconciliation. (Input all amounts as positive values. Round your answers to 2 decimal places.)
Math
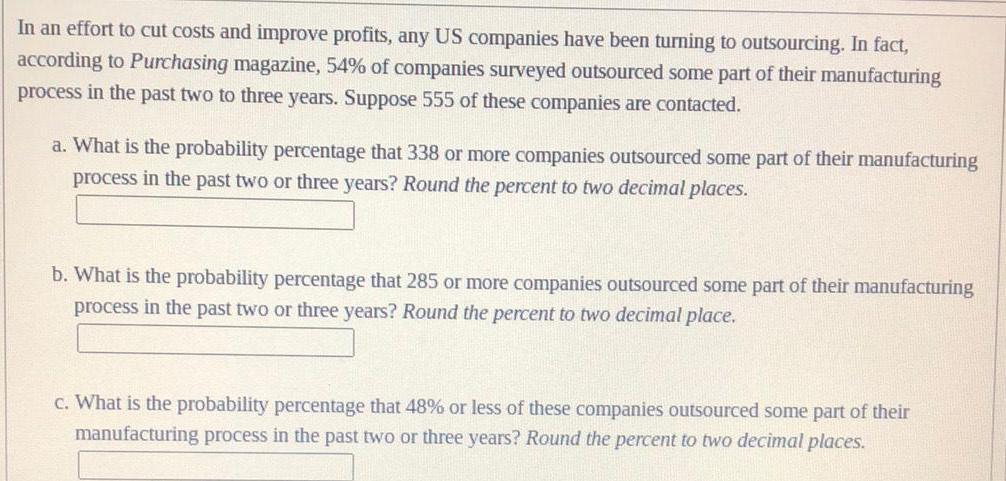
StatisticsIn an effort to cut costs and improve profits, any US companies have been turning to outsourcing. In fact, according to Purchasing magazine, 54% of companies surveyed outsourced some part of their manufacturing process in the past two to three years. Suppose 555 of these companies are contacted.
a. What is the probability percentage that 338 or more companies outsourced some part of their manufacturing process in the past two or three years? Round the percent to two decimal places.
b. What is the probability percentage that 285 or more companies outsourced some part of their manufacturing process in the past two or three years? Round the percent to two decimal place.
c. What is the probability percentage that 48% or less of these companies outsourced some part of their manufacturing process in the past two or three years? Round the percent to two decimal places.
Math
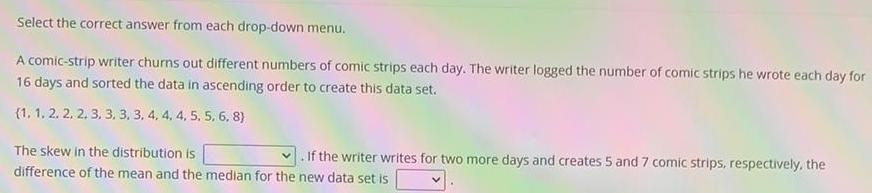
StatisticsSelect the correct answer from each drop-down menu.
A comic-strip writer churns out different numbers of comic strips each day. The writer logged the number of comic strips he wrote each day for 16 days and sorted the data in ascending order to create this data set.
(1, 1, 2, 2, 2, 3, 3, 3, 3, 4, 4, 4, 5, 5, 6, 8)
The skew in the distribution is . If the writer writes for two more days and creates 5 and 7 comic strips, respectively, the difference of the mean and the median for the new data set is
Math
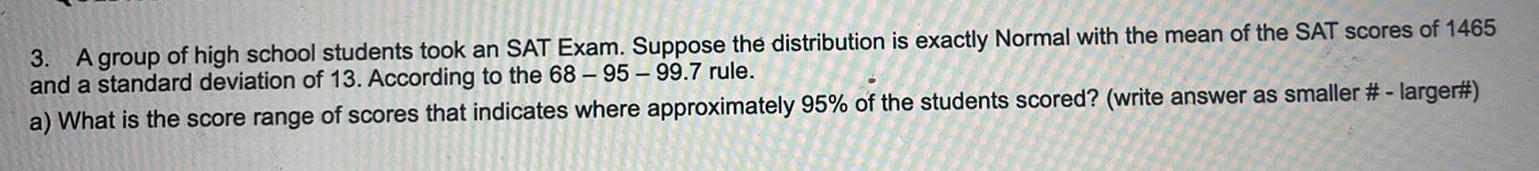
StatisticsA group of high school students took an SAT Exam. Suppose the distribution is exactly Normal with the mean of the SAT scores of 1465 and a standard deviation of 13. According to the 68-95-99.7 rule.
a) What is the score range of scores that indicates where approximately 95% of the students scored? (write answer as smaller # - larger#)
Math
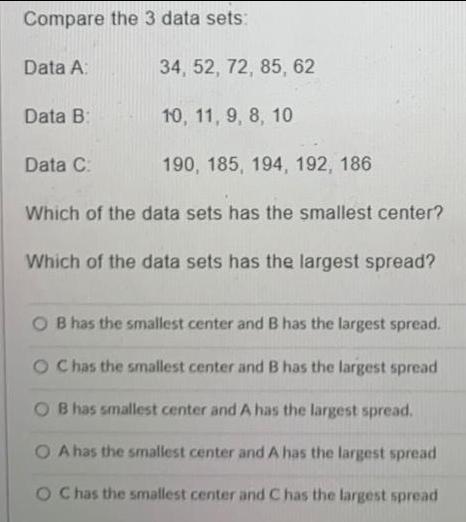
StatisticsCompare the 3 data sets:
Data A: 34, 52, 72, 85, 62
Data B: 10, 11, 9, 8, 10
Data C: 190, 185, 194, 192, 186
Which of the data sets has the smallest center?
Which of the data sets has the largest spread?
B has the smallest center and B has the largest spread.
C has the smallest center and B has the largest spread
B has smallest center and A has the largest spread.
A has the smallest center and A has the largest spread
C has the smallest center and C has the largest spread
Math
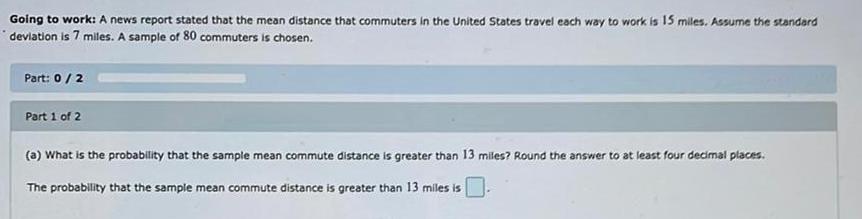
StatisticsGoing to work: A news report stated that the mean distance that commuters in the United States travel each way to work is 15 miles. Assume the standard deviation is 7 miles. A sample of 80 commuters is chosen.
(a) What is the probability that the sample mean commute distance is greater than 13 miles? Round the answer to at least four decimal places.
The probability that the sample mean commute distance is greater than 13 miles is
Math
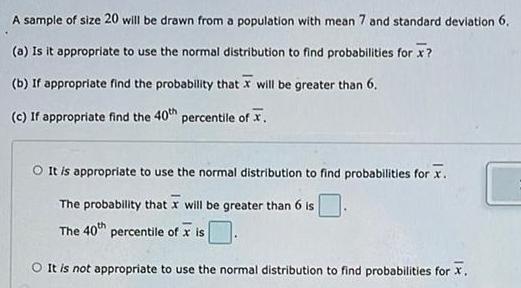
StatisticsA sample of size 20 will be drawn from a population with mean 7 and standard deviation 6.
(a) Is it appropriate to use the normal distribution to find probabilities for x̄ ?
(b) If appropriate find the probability that x̄ will be greater than 6.
(c) If appropriate find the 40th percentile of x̄.
It is appropriate to use the normal distribution to find probabilities for x̄.
The probability that x̄ will be greater than 6 is
The 40th percentile of x̄ is
It is not appropriate to use the normal distribution to find probabilities for x̄.
Math
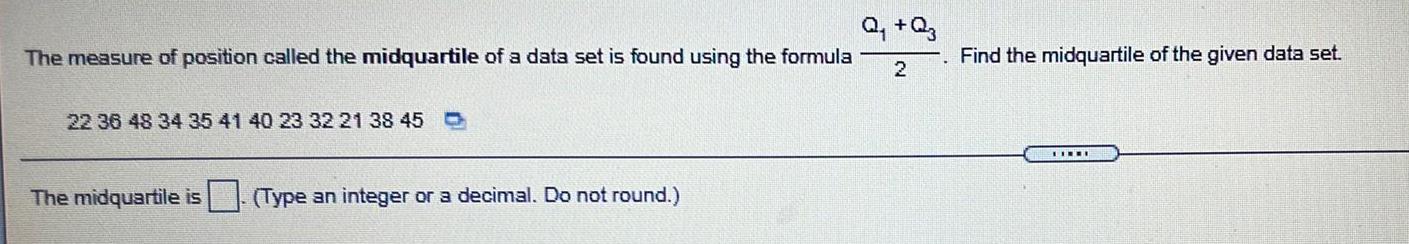
StatisticsThe measure of position called the midquartile of a data set is found using the formula Q₁ +Qz / 2. Find the midquartile of the given data set.
22 36 48 34 35 41 40 23 32 21 38 45
The midquartile is
(Type an integer or a decimal. Do not round.)

Math
StatisticsFind the minimum payment on an unpaid balance of $1,191.74. Assume that the minimum payment on a credit card is the greater of $14 or 3% of the unpaid balance.
The minimum payment is $ (Round to the nearest cent as needed.)
Math
StatisticsFor a production level of x units of a commodity, the cost function in dollars is C=200x +4100.
The demand equation is p = 300 -0.05x. What price p will maximize the profit?
A) $100 B) $250 C) $900 D) $1500 E) $6000
Math
StatisticsThe average resting heart rate of a population is 88 beats per minute, with a standard deviation of 13 bpm. Find the z-scores that correspond to each of the following heart rates. Round your answers to the nearest hundredth, if necessary.
(a) 111 bpm
Z=
(b) 67 bpm
Z=
Math
StatisticsHilda is taking out an $11,000 personal loan that she will repay in 5 years. If she receives a 10% interest rate, her monthly payments will be $233.72. If she receives an 18% interest rate, her monthly payments will be $279.33.
How much less interest will Hilda pay in interest if she qualifies for the lower interest rate?
Math
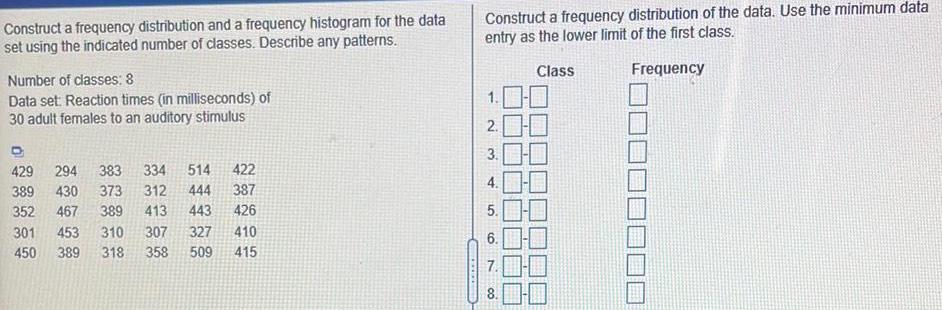
StatisticsConstruct a frequency distribution and a frequency histogram for the data set using the indicated number of classes. Describe any patterns.
Number of classes: 8
Data set: Reaction times (in milliseconds) of
30 adult females to an auditory stimulus
429 294 383 334 514 422
389 430 373 312 444 387
352 467 389 413 443 426
301 453 310 307 327 410
450 389 318 358 509 415
Construct a frequency distribution of the data. Use the minimum data entry as the lower limit of the first class.
Class Frequency
Math
StatisticsA theater group sells tickets to a play. If an adult ticket costs $12.50 and a child ticket costs $8.75, then how much money will the group collect by selling 70 adult tickets and 15 child tickets?
A. $1006.25
B. $1000.00
C. $875.00
D. $131.25
Math
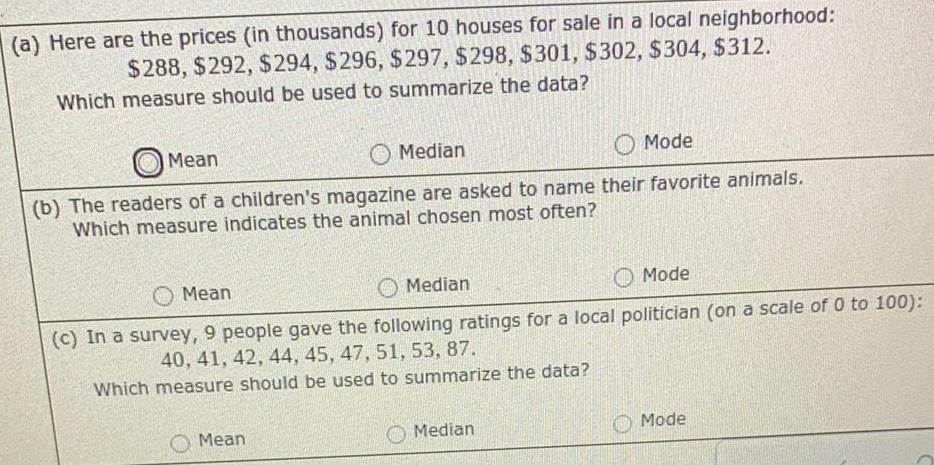
Statistics(a) Here are the prices (in thousands) for 10 houses for sale in a local neighborhood:
$288, $292, $294, $296, $297, $298, $301, $302, $304, $312.
Which measure should be used to summarize the data?
Mean
Median
Mode
(b) The readers of a children's magazine are asked to name their favorite animals.
Which measure indicates the animal chosen most often?
Mean
Median
Mode
(c) In a survey, 9 people gave the following ratings for a local politician (on a scale of 0 to 100):
40, 41, 42, 44, 45, 47, 51, 53, 87.
Which measure should be used to summarize the data?
Mean
Median
Mode
Math
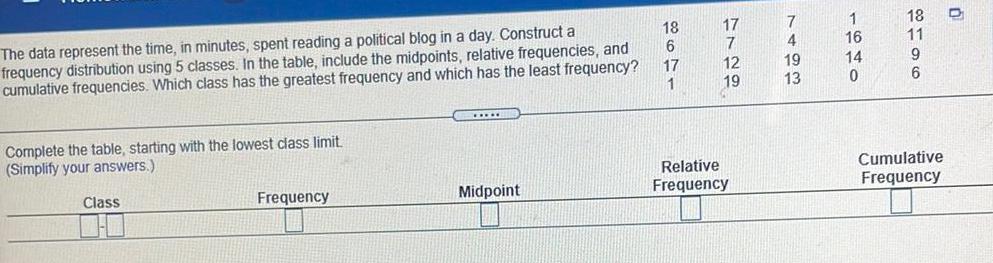
StatisticsThe data represent the time, in minutes, spent reading a political blog in a day. Construct a frequency distribution using 5 classes. In the table, include the midpoints, relative frequencies, and cumulative frequencies. Which class has the greatest frequency and which has the least frequency?
18 17 7 1 18
6 7 4 16 11
17 12 19 14 9
1 19 13 0 6
Complete the table, starting with the lowest class limit.
(Simplify your answers.)
Class Frequency Midpoint Relative Frequency Cumulative Frequency
Math
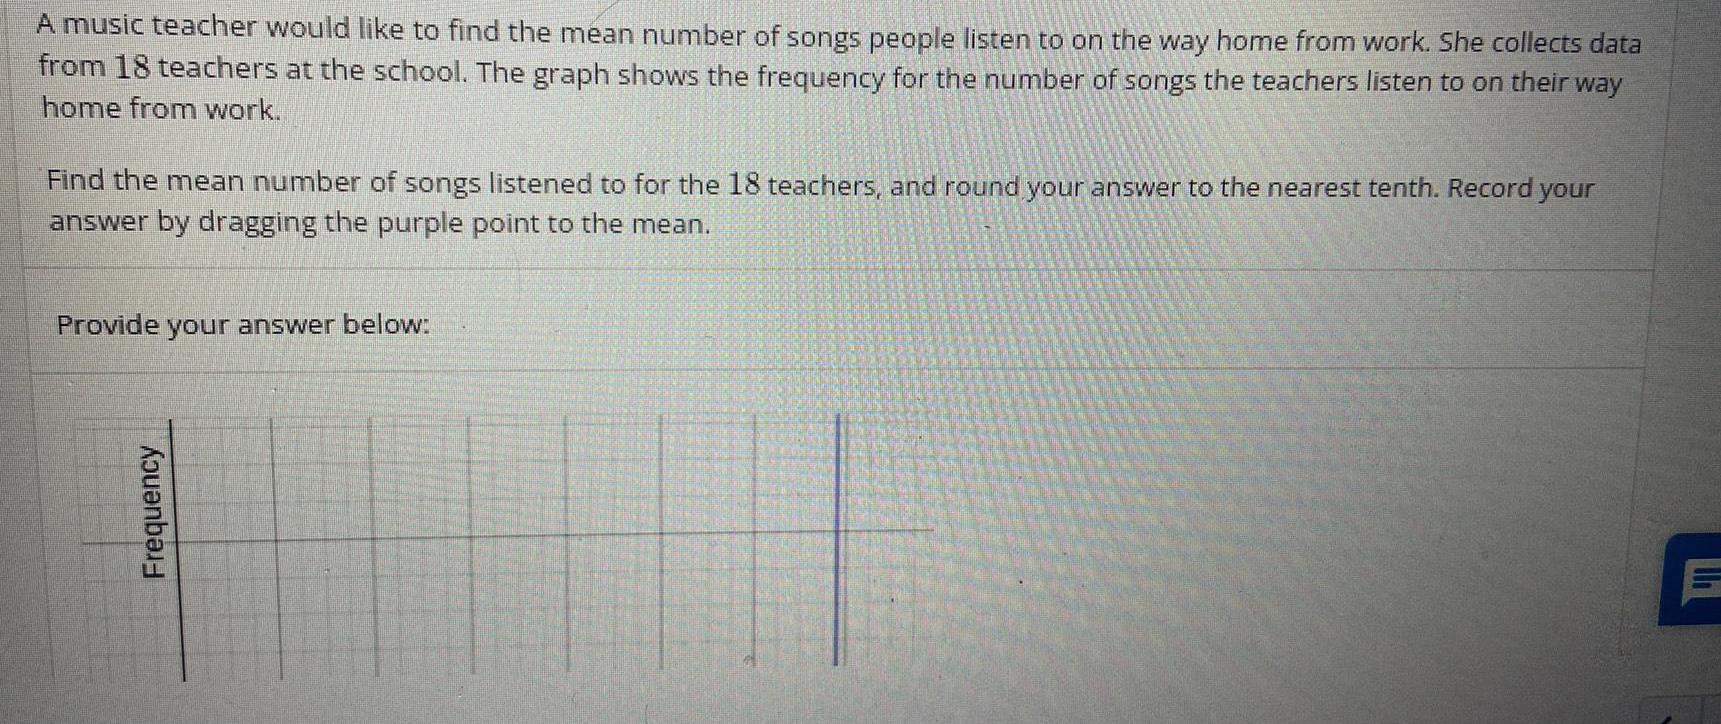
StatisticsA music teacher would like to find the mean number of songs people listen to on the way home from work. She collects data from 18 teachers at the school. The graph shows the frequency for the number of songs the teachers listen to on their way home from work.
Find the mean number of songs listened to for the 18 teachers, and round your answer to the nearest tenth. Record your answer by dragging the purple point to the mean.
Provide your answer below:
Math
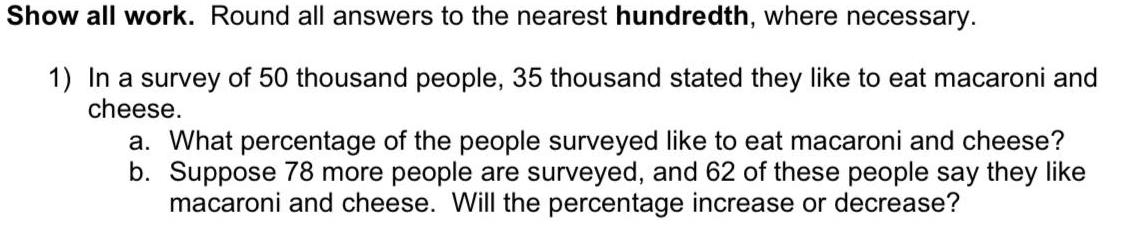
StatisticsIn a survey of 50 thousand people, 35 thousand stated they like to eat macaroni and cheese.
a. What percentage of the people surveyed like to eat macaroni and cheese?
b. Suppose 78 more people are surveyed, and 62 of these people say they like macaroni and cheese. Will the percentage increase or decrease?
Math
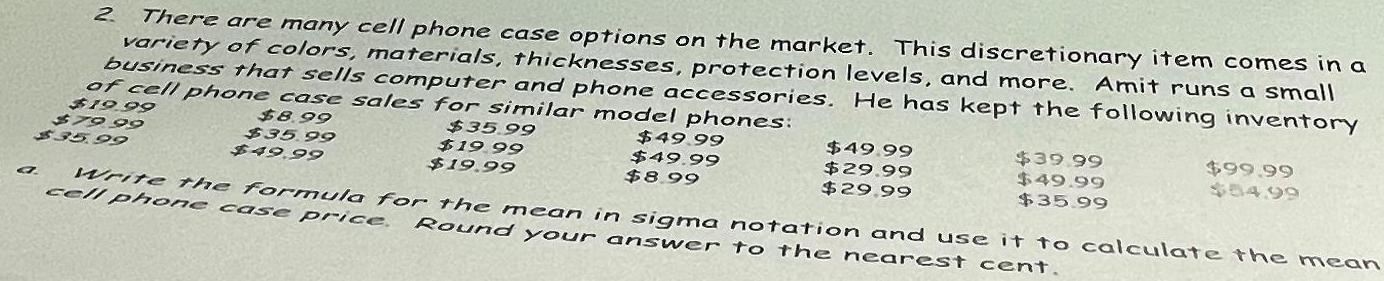
StatisticsThere are many cell phone case options on the market. This discretionary item comes in a variety of colors, materials, thicknesses, protection levels, and more. Amit runs a small business that sells computer and phone accessories. He has kept the following inventory of cell phone case sales for similar model phones:
Math
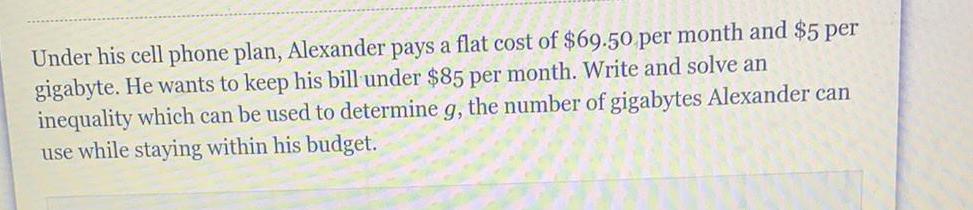
StatisticsUnder his cell phone plan, Alexander pays a flat cost of $69.50 per month and $5 per gigabyte. He wants to keep his bill under $85 per month. Write and solve an inequality which can be used to determine g, the number of gigabytes Alexander can use while staying within his budget.