Statistics Questions and Answers

Math
StatisticsRecent news articles have discussed the connection between a rare genetic mutation and breast cancer in women. One of the companies offering this BRCA genetic test is Quest, and this company claims a 98% accuracy rate. In the general population about 1 in 405 people would actually carry this BRCA1 genetic mutation.
Hint: Construct a table as in your course materials. Use a population size of 40500 women.
What is the likelihood that someone has the BRCA mutation, if they test positive? (Round your probability to the nearest tenth of a percent!)

Math
StatisticsYou are interested in estimating the the mean lifespan of a cell phone. From past data, you estimate that the standard deviation to be approximately 1.3 years. What sample size would you need to in order to estimate the mean lifespan of a cell phone, with a 90% confidence level, to within 0.5 years?
Sample Size: n ≥

Math
StatisticsDetermine which sampling method was used in the following study.
A certain species of tree in Gove County, Kansas was dying off due to an infestation. A study was produced to determine the percentage of trees that were dying due to this infestation. Rangers went across the entire county and checked every tree to determine whether or not it was infested.
sample
random selection
voluntary response
census
Math
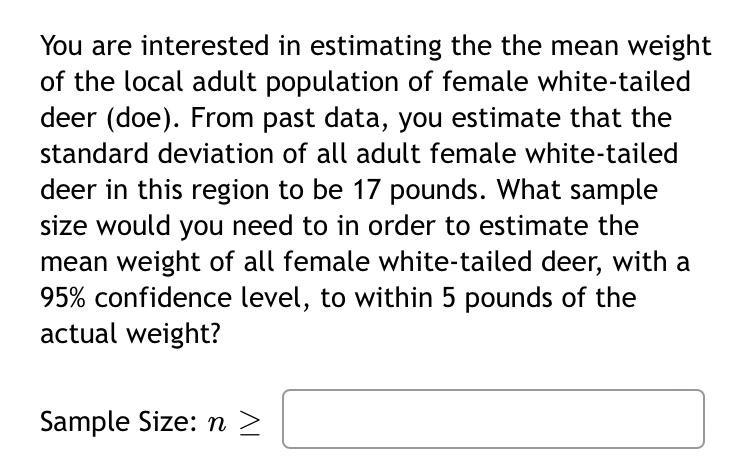
StatisticsYou are interested in estimating the the mean weight of the local adult population of female white-tailed deer (doe). From past data, you estimate that the standard deviation of all adult female white-tailed deer in this region to be 17 pounds. What sample size would you need to in order to estimate the mean weight of all female white-tailed deer, with a 95% confidence level, to within 5 pounds of the actual weight?
Sample Size: n≥
Math
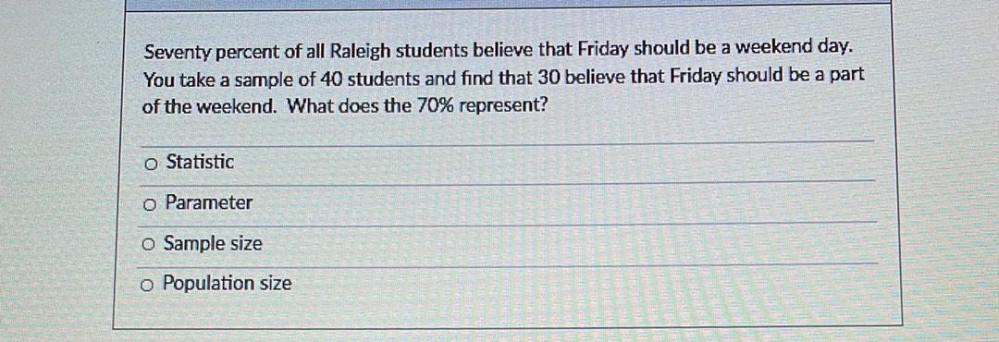
StatisticsSeventy percent of all Raleigh students believe that Friday should be a weekend day. You take a sample of 40 students and find that 30 believe that Friday should be a part of the weekend. What does the 70% represent?
1. Statistic
2. Parameter
3. Sample size
4. Population size
Math
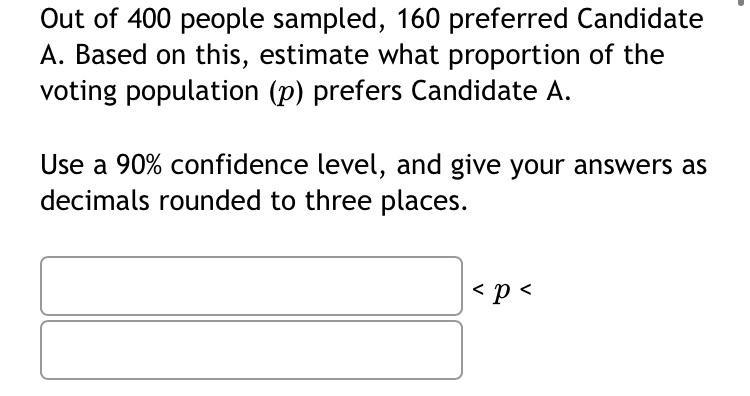
StatisticsOut of 400 people sampled, 160 preferred Candidate
A. Based on this, estimate what proportion of the voting population (p) prefers Candidate A.
Use a 90% confidence level, and give your answers as decimals rounded to three places.
_________ < p < _________
Math
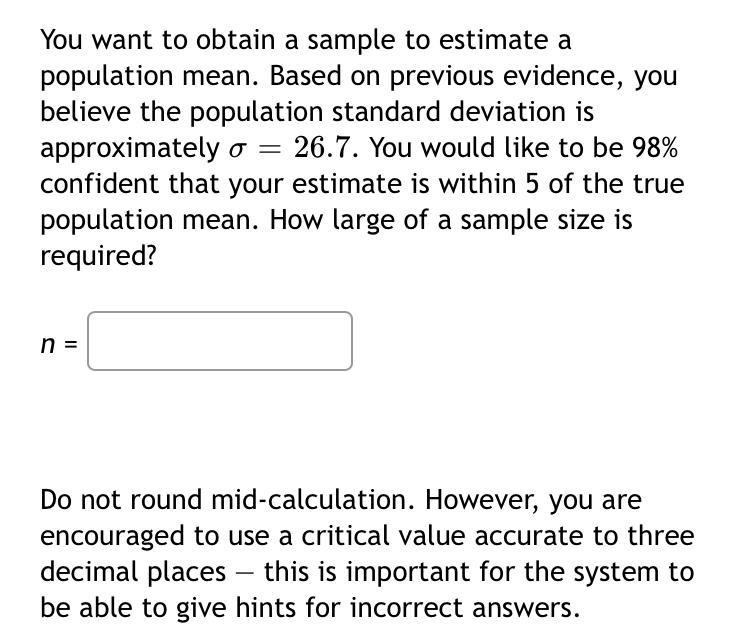
StatisticsYou want to obtain a sample to estimate a population mean. Based on previous evidence, you believe the population standard deviation is approximately σ = 26.7. You would like to be 98% confident that your estimate is within 5 of the true population mean. How large of a sample size is required?
Do not round mid-calculation. However, you are encouraged to use a critical value accurate to three decimal places - this is important for the system to be able to give hints for incorrect answers.
Math
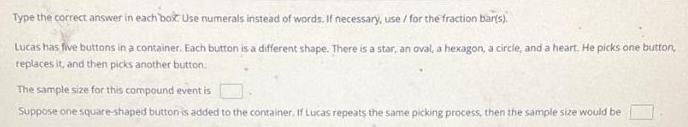
StatisticsType the correct answer in each box Use numerals instead of words. If necessary, use / for the fraction bar(s).
Lucas has five buttons in a container. Each button is a different shape. There is a star, an oval, a hexagon, a circle, and a heart. He picks one button, replaces it, and then picks another button.
The sample size for this compound event is
Suppose one square-shaped button is added to the container. If Lucas repeats the same picking process, then the sample size would be

Math
StatisticsThe function fx)=80,000+0.2x/ x yields the average cost in dollars for a company to produce x copies of a comic book.
Which statement best fits the situation modeled by the function?
The company earns 20% of the issue price as profit from each copy sold.
The company earns 20 cents as profit from each copy sold.
The company spends 20% of the issue price on materials to produce each copy
The company spends 20 cents on materials to produce each copy.
Math
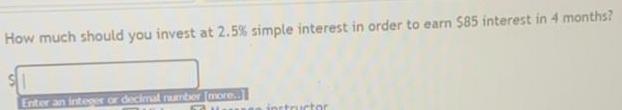
StatisticsHow much should you invest at 2.5% simple interest in order to earn $85 interest in 4 months?

Math
StatisticsSuppose one would like to construct a 93% confidence interval for a sample mean, when the population. standard deviation is known. Determine the z-value that would be used to construct such a confidence interval. Round the solution to two decimal places.

Math
StatisticsSuppose you want to have $800,000 for retirement in 20 years. Your account earns 10% interest.
a) How much would you need to deposit in the account each month?
b) How much interest will you earn?
![For the given probability density function, over the given interval, find the mean, the variance, and the standard deviation.
f(x) = 4, [2.25, 2.50]
A. μ=2.375; σ²=0.0052; σ = 0.072
B. μ= 2.500; σ² = 0.0048; σ = 0.069
C. μ=2.500; σ² = 0.0049; σ = 0.070
D. μ=2.375; σ² = 0.021; σ = 0.144](https://media.kunduz.com/media/sug-question/raw/84567198-1658663482.7464163.jpeg?w=256)
Math
StatisticsFor the given probability density function, over the given interval, find the mean, the variance, and the standard deviation.
f(x) = 4, [2.25, 2.50]
A. μ=2.375; σ²=0.0052; σ = 0.072
B. μ= 2.500; σ² = 0.0048; σ = 0.069
C. μ=2.500; σ² = 0.0049; σ = 0.070
D. μ=2.375; σ² = 0.021; σ = 0.144

Math
StatisticsA company, which manufactures lawn mowers, estimates its daily profit, p(n) in dollars, to be given by p(n) = -n²+ 100n, where n is the number of mowers produced. The company can manufacture at most 45 lawn mowers a day.
a) How many mowers should this company produced daily to maximize the profit?
b) What will its daily profit be?

Math
StatisticsSuppose Chris places $7000 in an account that pays 16% interest compounded each year. Assume that no withdrawals are made from the account.
Follow the instructions below. Do not do any rounding.
(a) Find the amount in the account at the end of 1 year.
(b) Find the amount in the account at the end of 2 years.
Math
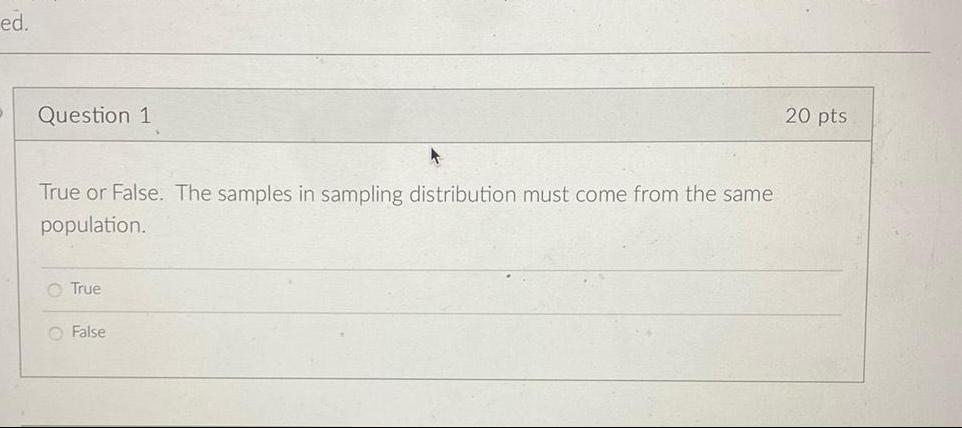
StatisticsTrue or False. The samples in sampling distribution must come from the same
population.
True
False
Math
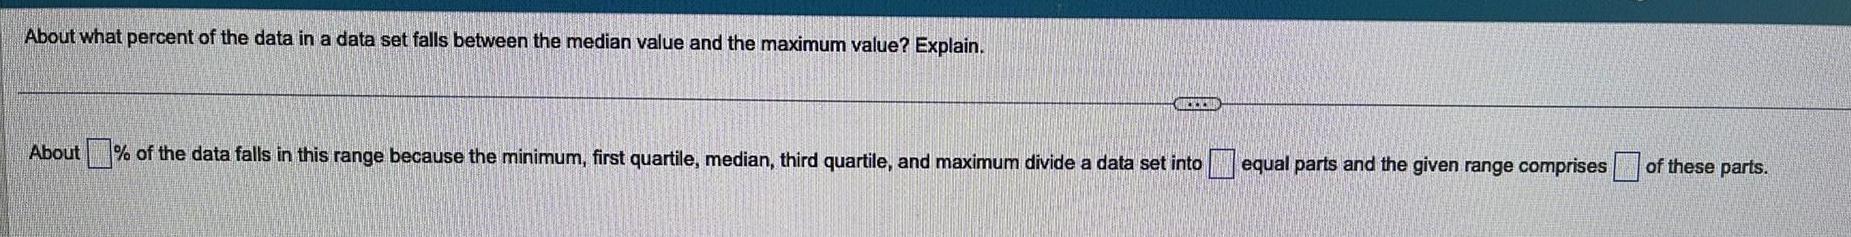
StatisticsAbout what percent of the data in a data set falls between the median value and the maximum value? Explain.
About___% of the data falls in this range because the minimum, first quartile, median, third quartile, and maximum divide a data set into___equal parts and the given range comprises___of these parts.
Math
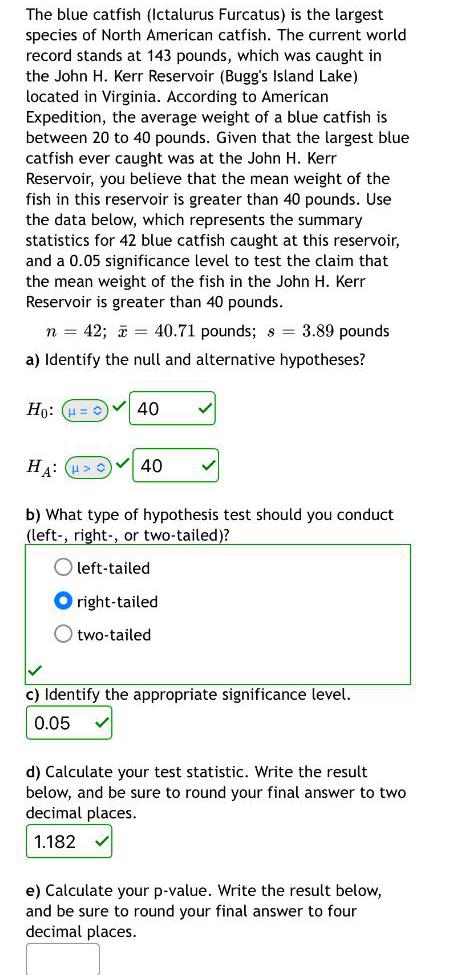
StatisticsThe blue catfish (Ictalurus Furcatus) is the largest species of North American catfish. The current world record stands at 143 pounds, which was caught in the John H. Kerr Reservoir (Bugg's Island Lake) located in Virginia. According to American Expedition, the average weight of a blue catfish is between 20 to 40 pounds. Given that the largest blue catfish ever caught was at the John H. Kerr Reservoir, you believe that the mean weight of the fish in this reservoir is greater than 40 pounds. Use the data below, which represents the summary statistics for 42 blue catfish caught at this reservoir, and a 0.05 significance level to test the claim that the mean weight of the fish in the John H. Kerr Reservoir is greater than 40 pounds.
n = 42; = 40.71 pounds; s = 3.89 pounds
a) Identify the null and alternative hypotheses?
Ho:
HA:
b) What type of hypothesis test should you conduct (left-, right-, or two-tailed)?
left-tailed
right-tailed
two-tailed
c) Identify the appropriate significance level.
d) Calculate your test statistic. Write the result below, and be sure to round your final answer to two decimal places.
e) Calculate your p-value. Write the result below, and be sure to round your final answer to four
decimal places.
Math
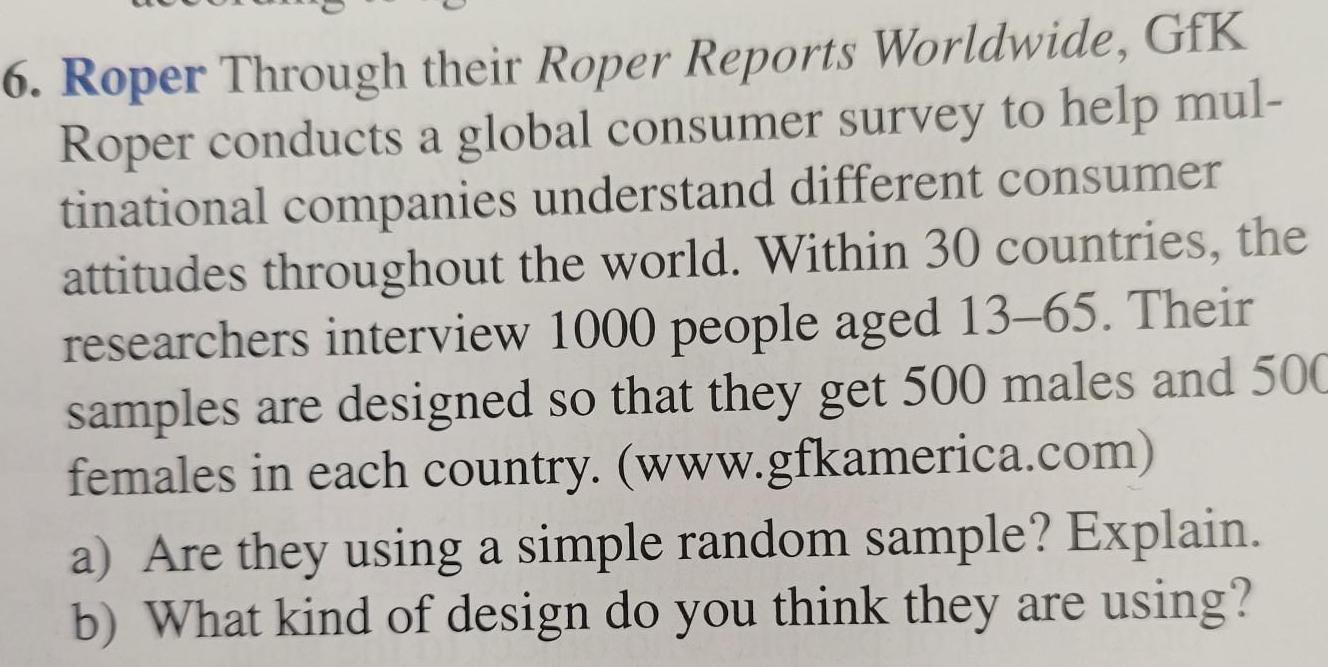
StatisticsRoper Through their Roper Reports Worldwide, GfK Roper conducts a global consumer survey to help mul- tinational companies understand different consumer attitudes throughout the world. Within 30 countries, the researchers interview 1000 people aged 13-65. Their samples are designed so that they get 500 males and 500 females in each country. (www.gfkamerica.com)
a) Are they using a simple random sample? Explain.
b) What kind of design do you think they are using?
Math
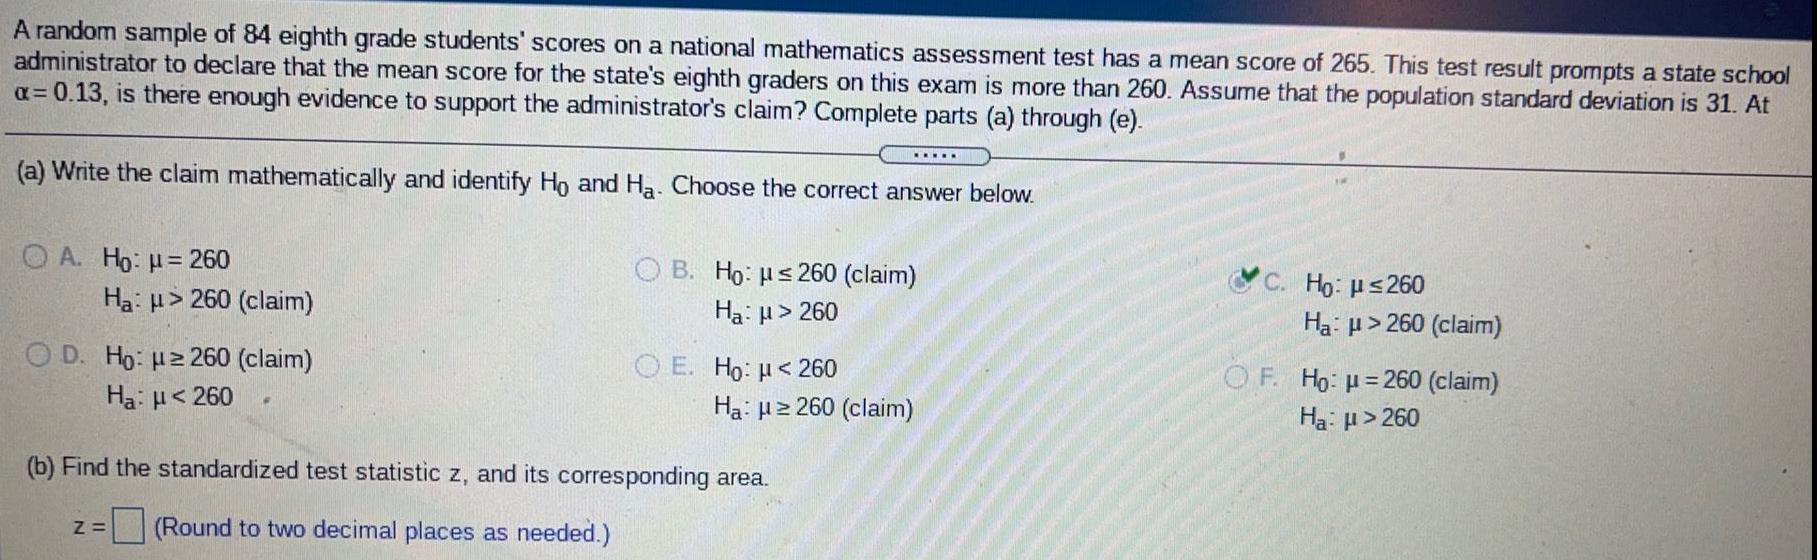
StatisticsA random sample of 84 eighth grade students' scores on a national mathematics assessment test has a mean score of 265. This test result prompts a state school administrator to declare that the mean score for the state's eighth graders on this exam is more than 260. Assume that the population standard deviation is 31. At a=0.13, is there enough evidence to support the administrator's claim? Complete parts (a) through (e).
(a) Write the claim mathematically and identify Ho and Ha. Choose the correct answer below.
(b) Find the standardized test statistic z, and its corresponding area.

Math
StatisticsWatching TV: In 2012, the General Social Survey asked a sample of 1314 people how much time they spent watching TV each
day. The mean number of hours was 2.85 with a standard deviation of 2.62. A sociologist claims that people watch a mean of 3
hours of TV per day. Do the data provide sufficient evidence to conclude that the mean hours of TV watched per day is less than
the claim? Use the a= 0.05 level of significance and the P-value method with the TI-84 Plus calculator.
Part 1 of 4
(a) State the appropriate null and alternate hypotheses.
Ho:
This hypothesis test is a (Choose one) test.
O<O
DO
X
O<O
L
0-0
3

Math
StatisticsAssume that you want to test the claim that the paired sample data come from a
population for which the mean difference is ud = 0. Compute the value of the t test
statistic. Round intermediate calculations to four decimal places as needed and final
answers to three decimal places as needed.
29 31 23 27 26 26 34 30
27 27 29 27 27 31 34 29
t = -0.185
t = 0.690
t = -0.523
t = -1.480

Math
StatisticsDetermine the mean, median, mode and midrange of the set of data.
59, 52, 39, 50, 60, 47, 63
The mean is
(Round to the nearest tenth as needed.)
The median is
Select the correct choice below and fill in any answer boxes within your choice.
OA. The mode is
OB. There is no mode.
The midrange is
(Use a comma to separate answers as needed.)

Math
StatisticsHeavy children: Are children heavier now than they were in the past? The National Health and Nutrition Examination Survey
(NHANES) taken between 1999 and 2002 reported that the mean weight of six-year-old girls in the United States was 49.3
pounds. Another NHANES survey, published in 2008, reported that a sample of 205 six-year-old girls weighed between 2003 and
2006 had an average weight of 50.2 pounds. Assume the population standard deviation is a = 15.3 pounds. Can you conclude
that the mean weight of six-year-old girls in 2006 is different from what it was in 2002? Use the a = 0.05 level of significance and
the P-value method with the TI-84 calculator.
Part 1 of 4
State the appropriate null and alternate hypotheses.
Ho:u= 49.3
H₁: = 49.3
The hypothesis test is a two-tailed ▼test.
Part: 1/4 -
Part 2 of 4
Compute the P-value. Round your answer to at least four decimal places.
P-value=
Math
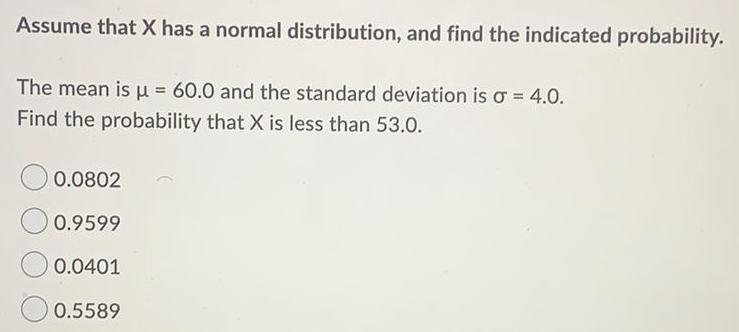
StatisticsAssume that X has a normal distribution, and find the indicated probability.
The mean is μ = 60.0 and the standard deviation is o = 4.0.
Find the probability that X is less than 53.0.
0.0802
0.9599
0.0401
0.5589

Math
StatisticsIs there a doctor in the house? A market research firm reported the mean annual earnings of all family practitioners in the
United States was $178,258. A random sample of 43 family practitioners in Los Angeles had mean earnings of x = $193,010 with
a standard deviation of $42,777. Do the data provide sufficient evidence to conclude that the mean salary for family practitioners
in Los Angeles is greater than the national average? Use the a= 0.05 level of significance and the P-value method with the TI-84
Plus calculator.
Part 1 of 4
State the appropriate null and alternate hypotheses.
Ho
H₁ :
This hypothesis test is a (Choose one)
test.

Math
StatisticsEfficient manufacturing: Efficiency experts study the processes used to manufacture items in order to make them as efficient as
possible. One of the steps used to manufacture a metal clamp involves the drilling of three holes. In a sample of 95 clamps, the
mean time to complete this step was 55.3 seconds. Assume that the population standard deviation is = 12 seconds. Round the
critical value to no less than three decimal places.
Part 1 of 2
(a) Construct an 80% confidence interval for the mean time needed to complete this step. Round the answer to at least one
decimal place.
An 80% confidence interval for the mean is < <

Math
StatisticsFind the P-value for the indicated hypothesis test.
A random sample of 139 forty-year-old men contains 26% smokers. Find the P-value
for a test to reject the claim that the percentage of forty-year-old men that smoke is
22%.
0.2542
0.2802
0.1271
0.1401

Math
StatisticsFind the P-value for the indicated hypothesis test. Round all proportions and
standard scores to two decimal places.
In a sample of 47 adults selected randomly from one town, it is found that 9 of them
have been exposed to a particular strain of the flu. Find the P-value for a test of the
claim that the proportion of all adults in the town that have been exposed to this
strain of the flu is 8%.
0.9946
0.0045
0.0054
0.0027

Math
StatisticsFind the critical value(s) and rejection region(s) for the indicated t-test, level of significance a, and sample size n.vTwo-tailed test, a= 0.01, n = 13
Click the icon to view the t-distribution table.
The critical value(s) is/are
(Round to the nearest thousandth as needed. Use a comma to separate answers as needed.)
Determine the rejection region(s). Select the correct choice below and fill in the answer box(es) within your choice.
(Round to the nearest thousandth as needed.)
A. t< and t>
B.
C. t<
D. t>

Math
StatisticsHow's the economy? A pollster wants to construct a 99% confidence interval for the proportion of adults who believe that
economic conditions are getting better.
Part: 0 / 2
Part 1 of 2
(a) A poll taken in July 2010 estimates this proportion to be 0.3. Using this estimate, what sample size is needed so that the
confidence interval will have a margin of error of 0.01?
A sample of adults is needed to obtain a 99% confidence interval with a margin of error
of 0.01.

Math
StatisticsConstruct the indicated confidence interval for the difference between population proportions P1.P2. Assume that the samples are independent and that they have been randomly selected.
In a random sample of 500 people aged 20-24, 22% were smokers. In a random sample of 450 people aged 25-29, 14% were smokers. Construct a 95% confidence interval for the difference between the population proportions p1 - P2.
0.048 P1-P2 < 0.112
0.035 P1-P2 < 0.125
0.025 P1-P2 < 0.135
0.032 P1-P2 < 0.128

Math
StatisticsUse the given information to find the P-value. Also, use a 0.05 significance level and
state the conclusion about the null hypothesis (reject the null hypothesis or fail to
reject the null hypothesis).
With H₁: p > 0.554, the test statistic is z = 1.34.
0.0901; fail to reject the null hypothesis
0.0901; reject the null hypothesis
0.1802; reject the null hypothesis
0.9099; fail to reject the null hypothesis
Math
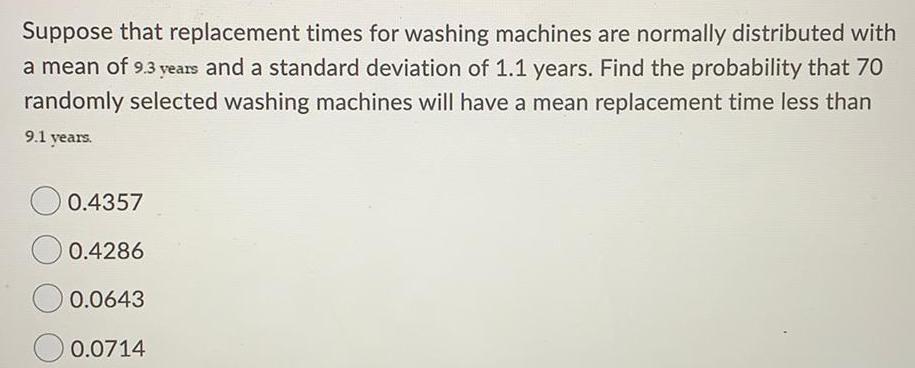
StatisticsSuppose that replacement times for washing machines are normally distributed with
a mean of 9.3 years and a standard deviation of 1.1 years. Find the probability that 70
randomly selected washing machines will have a mean replacement time less than
9.1 years.
0.4357
0.4286
0.0643
0.0714

Math
StatisticsSAT scores: A college admissions officer takes a simple random sample of 100 entering freshmen and computes their mean
mathematics SAT score to be 446. Assume the population standard deviation is a =
(a) Construct a 98% confidence interval for the mean mathematics SAT score for the entering freshman class. Round the
answer to the nearest whole number.
A 98% confidence interval for the mean mathematics SAT score is

Math
StatisticsYour medical research team is investigating the mean cost of a 30-day supply of a certain heart medication. A pharmaceutical company thinks that the mean cost is more than $91. You want to support this claim. How would you write the null and alternative hypotheses?

Math
StatisticsUse the given information to find the minimum sample size required to estimate an
unknown population mean μ. How many commuters must be randomly selected to estimate the mean driving time of Chicago commuters? We want 90% confidence that the sample mean is within 4 minutes of the population mean, and the population standard deviation is known to be 9 minutes.
34
28
14
20

Math
StatisticsA final exam in Math 160 has a mean of 73 with standard deviation 7.8. If 24
students are randomly selected, find the probability that the mean of their test
scores is less than 70.
0.0301
0.0278
0.9699
0.1006

Math
StatisticsAssume that a sample is used to estimate a population proportion p. Find the
margin of error E that corresponds to the given statistics and confidence level.
Round the margin of error to four decimal places.
95% confidence; n = 2388, x = 1672
0.0206
0.0156
0.0184
0.0248

Math
StatisticsA population has a mean µ = 78 and a standard deviation σ =27. Find the mean and standard deviation of a sampling distribution of sample means with sample size n= 81.

Math
StatisticsIntelligence quotients (IQs) on the Stanford-Binet intelligence test are normally distributed with a mean of 100 and a standard deviation of 16. Use the 68-95-99.7 Rule to find the percentage of people with IQs between 84 and 116.

Math
StatisticsThe mean annual tuition and fees for a sample of 10 private colleges was $36,000 with a standard deviation of $4900 A dotplot shows that it is reasonable to assume that the population is approximately normal. You wish to test whether the mean tuition and fees for private colleges is different from $37,900.
State a conclusion regarding H0. Use the a = 0.10 level of significance.
A) Reject H0. The mean annual tuition and fees appears to be different from $37,900.
B) There is not enough information to draw a conclusion.
C) Do not reject H0
There is insufficient evidence to conclude that the mean annual tuition and fees is different from $37,900.

Math
StatisticsIn a random sample of six people, the mean driving distance to work was 24.1 miles and the standard deviation was 7.5 miles. Assuming the population is normally distributed and using the t-distribution, a 95% confidence interval for the population mean μ is (16.2, 32.0) (and the margin of error is 7.9). Through research, it has been found that the population standard deviation of driving distances to work is 6.3. Using the standard normal distribution with the appropriate calculations for a standard deviation that is known, find the margin of error and construct a 95% confidence interval for the population mean μ. Interpret and compare the results.

Math
StatisticsIn a random sample of eight cell phones, the mean full retail price was $449.00 and the standard deviation was $225.00. Assume the population is normally distributed and use the t-distribution to find the margin of error and construct a 95% confidence interval for the population mean u. Interpret the results.

Math
StatisticsUse the standard normal distribution or the t-distribution to construct a 90% confidence interval for the population mean. Justify your decision. If neither distribution can be used, explain why. Interpret the results. In a random sample of 17 mortgage institutions, the mean interest rate was 3.45% and the standard deviation was 0.38%. Assume the interest rates are normally distributed.
Which distribution should be used to construct the confidence interval?
A. Use a normal distribution because n∠30 and the interest rates are normally distributed.
B. Use a normal distribution because the interest rates are normally distributed and σ is known.
C. Use a t-distribution because it is a random sample, σ is unknown, and the interest rates are normally distributed.
D. Use a t-distribution because the interest rates are normally distributed and σ is known.
E. Cannot use the standard normal distribution or the t-distribution because σ is unknown, n<30, and the interest rates are not normally distributed.

Math
StatisticsThe weight of an organ in adult males has a bell-shaped distribution with a mean of 350 grams and a standard deviation of 45 grams. Use the empirical rule to
determine the following.
(a) About 95% of organs will be between what weights?
(b) What percentage of organs weighs between 305 grams and 395 grams?
(c) What percentage of organs weighs less than 305 grams or more than 395 grams?
(d) What percentage of organs weighs between 260 grams and 485 grams?
(a) and grams (Use ascending order.)

Math
StatisticsUse the confidence interval to find the estimated margin of error. Then find the sample mean.
A biologist reports a confidence interval of (3.5,4.3) when estimating the mean height (in centimeters) of a sample of seedlings.

Math
StatisticsIn a random sample of 8 people, the mean commute time to work was 36.5 minutes and the standard deviation was 7.2 minutes. A 98% confidence
interval using the t-distribution was calculated to be (28.9,44.1). After researching commute times to work, it was found that the population standard
deviation is 8.7 minutes. Find the margin of error and construct a 98% confidence interval using the standard normal distribution with the appropriate
calculations for a standard deviation that is known. Compare the results.

Math
StatisticsUse the confidence interval to find the margin of error and the sample mean.
(1.62,1.96)
The margin of error is 0.17.
(Round to two decimal places as needed.)
The sample mean is
………..

Math
StatisticsA nutritionist claims that the mean tuna consumption by a person is 3.2 pounds per year. A sample of 90 people shows that the mean tuna consumption by a person is 2.9 pounds per
year. Assume the population standard deviation is 1.21 pounds. At a= 0.07, can you reject the claim?
(a) Identify the null hypothesis and alternative hypothesis.
A. Ho: μ=3.2
Ha: μ≠3.2
B. Ho: μ> 3.2
Ha: μ≤3.2
C. Ho: μ≠2.9
Ha: μ=2.9
D. Ho: ≤2.9
Ha: μ>2.9
E. Ho: μ> 2.9
Ha: μ≤2.9
F. Ho: ≤3.2
Ha:p>3.2