Statistics Questions and Answers
![The normal monthly precipitation at the Seattle-Tacoma airport can be approximated by the model shown below, where R is measured in inches and t is the time in months, with t = 0 corresponding to January 1.t (Round your answers to two decimal places.)
R = 2.876 + 2.202 sin(0.576t+ 0.847)
(a) Determine the extrema of the function over a one-year period.
(b) Use integration to approximate the normal annual precipitation. (Hint: Integrate over the interval [0, 12].)
(c) Approximate the average monthly precipitation during the months of January, February, and March.](https://media.kunduz.com/media/sug-question/raw/55292830-1658080368.0746422.jpeg?w=256)
Math
StatisticsThe normal monthly precipitation at the Seattle-Tacoma airport can be approximated by the model shown below, where R is measured in inches and t is the time in months, with t = 0 corresponding to January 1.t (Round your answers to two decimal places.)
R = 2.876 + 2.202 sin(0.576t+ 0.847)
(a) Determine the extrema of the function over a one-year period.
(b) Use integration to approximate the normal annual precipitation. (Hint: Integrate over the interval [0, 12].)
(c) Approximate the average monthly precipitation during the months of January, February, and March.
Math
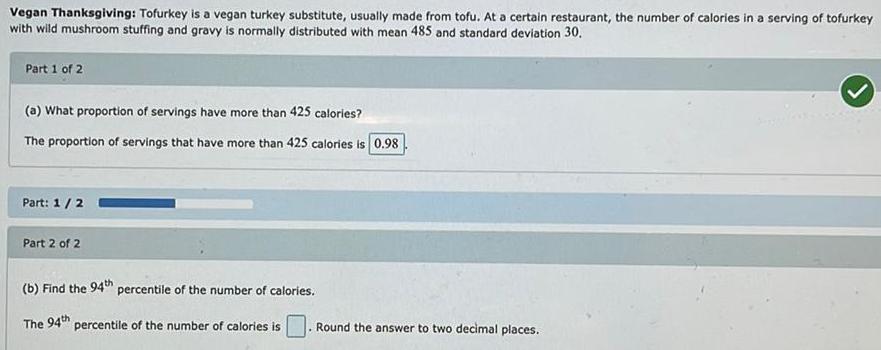
StatisticsVegan Thanksgiving: Tofurkey is a vegan turkey substitute, usually made from tofu. At a certain restaurant, the number of calories in a serving of tofurkey with wild mushroom stuffing and gravy is normally distributed with mean 485 and standard deviation 30.
(a) What proportion of servings have more than 425 calories?
The proportion of servings that have more than 425 calories is 0.98
(b) Find the 94th percentile of the number of calories.
The 94th percentile of the number of calories is
Round the answer to two decimal places.
Math
StatisticsAn assembly consists of two mechanical components. Suppose that the probabilities that the first and second components meet specifications are 0.98 and 0.85, respectively. Let X be the number of components in the assembly that meet specifications.
(a) Find the mean of X.
(b) Find the variance of X.
Math
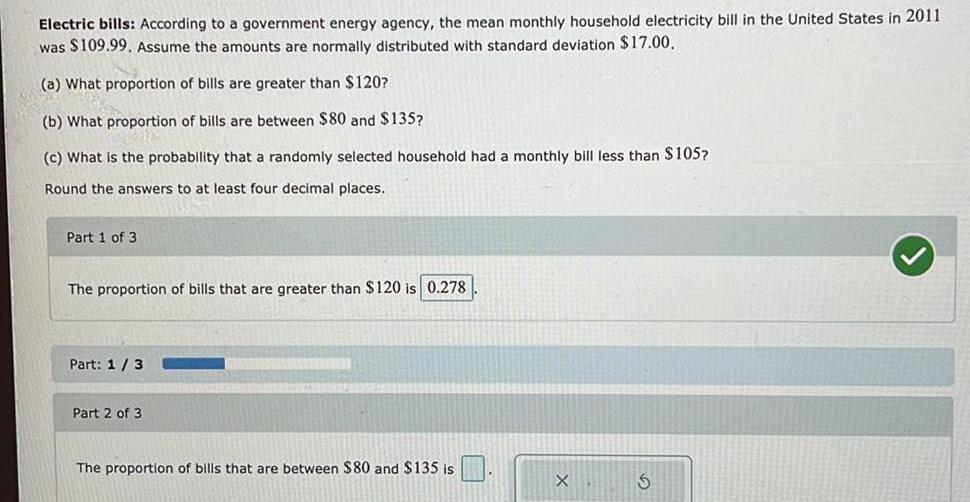
StatisticsElectric bills: According to a government energy agency, the mean monthly household electricity bill in the United States in 2011
was $109.99. Assume the amounts are normally distributed with standard deviation $17.00.
(a) What proportion of bills are greater than $120?
(b) What proportion of bills are between $80 and $135?
(c) What is the probability that a randomly selected household had a monthly bill less than $105?
Round the answers to at least four decimal places.
The proportion of bills that are greater than $120 is
Math
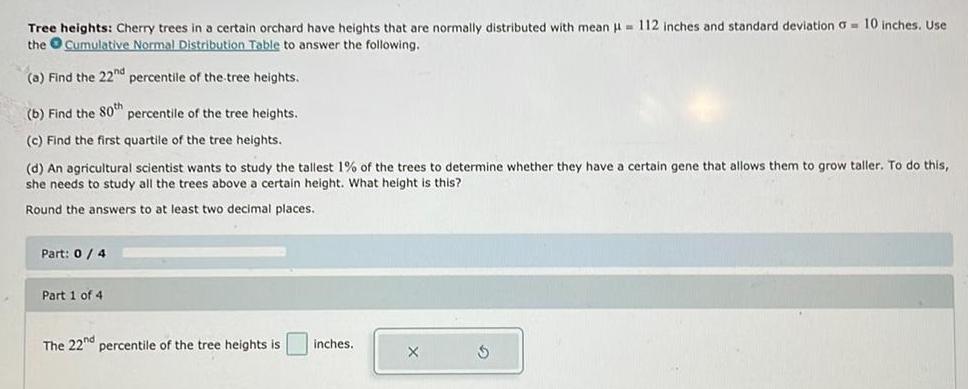
StatisticsTree heights: Cherry trees in a certain orchard have heights that are normally distributed with mean = 112 inches and standard deviation a= 10 inches. Use
the Cumulative Normal Distribution Table to answer the following.
(a) Find the 22nd percentile of the tree heights.
(b) Find the 80th percentile of the tree heights.
(c) Find the first quartile of the tree heights.
(d) An agricultural scientist wants to study the tallest 1% of the trees to determine whether they have certain gene that allows them to grow taller. To do this,
she needs to study all the trees above a certain height. What height is this?
Round the answers to at least two decimal places.
Part: 0/4
Part 1 of 4
The 22nd percentile of the tree heights is
inches.
X
Math
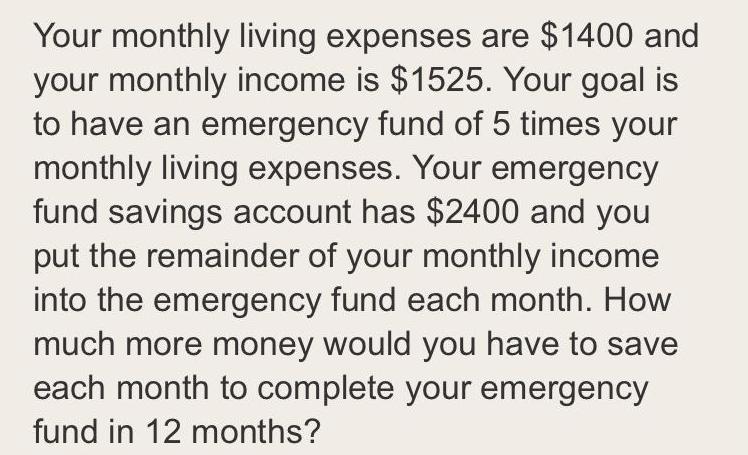
StatisticsYour monthly living expenses are $1400 and your monthly income is $1525. Your goal is to have an emergency fund of 5 times your monthly living expenses. Your emergency fund savings account has $2400 and you put the remainder of your monthly income into the emergency fund each month. How much more money would you have to save each month to complete your emergency fund in 12 months?
Math
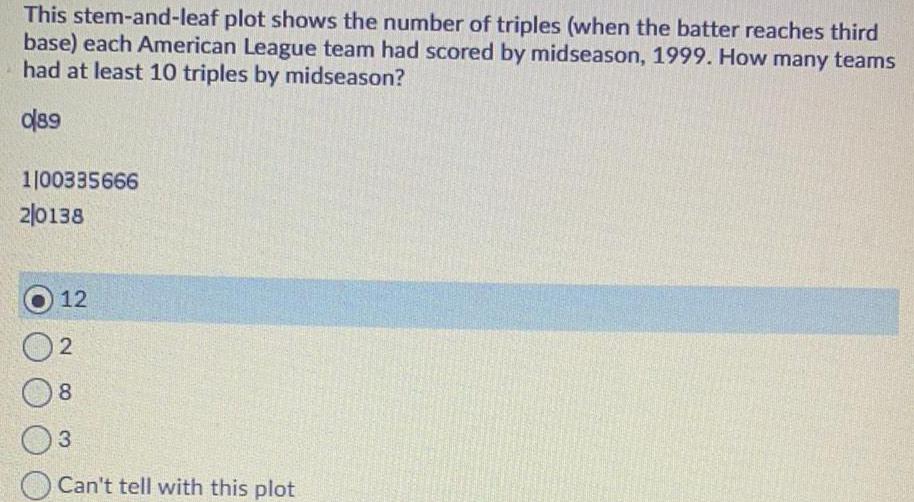
StatisticsThis stem-and-leaf plot shows the number of triples (when the batter reaches third base) each American League team had scored by midseason, 1999. How many teams had at least 10 triples by midseason?
Math
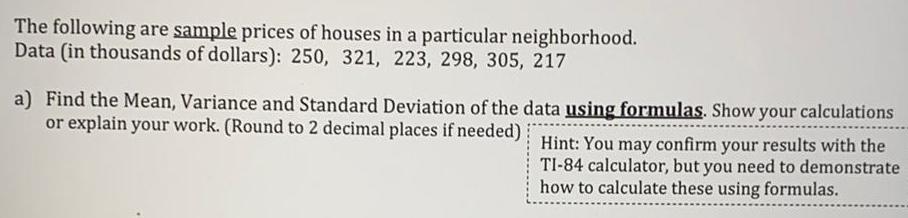
StatisticsThe following are sample prices of houses in a particular neighborhood.
Data (in thousands of dollars): 250, 321, 223, 298, 305, 217
a) Find the Mean, Variance and Standard Deviation of the data using formulas. Show your calculations
or explain your work. (Round to 2 decimal places if needed).

Math
StatisticsPablo takes classes at both Westside Community College and Pinewood Community College. At Westside, class fees are $98 per credit hour, and at Pinewood, class fees are $115 per credit hour. Pablo s taking a combined total of 13 credit hours at the two schools.
Suppose that he is taking w credit hours at Westside. Write an expression for the combined total dollar amount he paid for his class fees.
Math
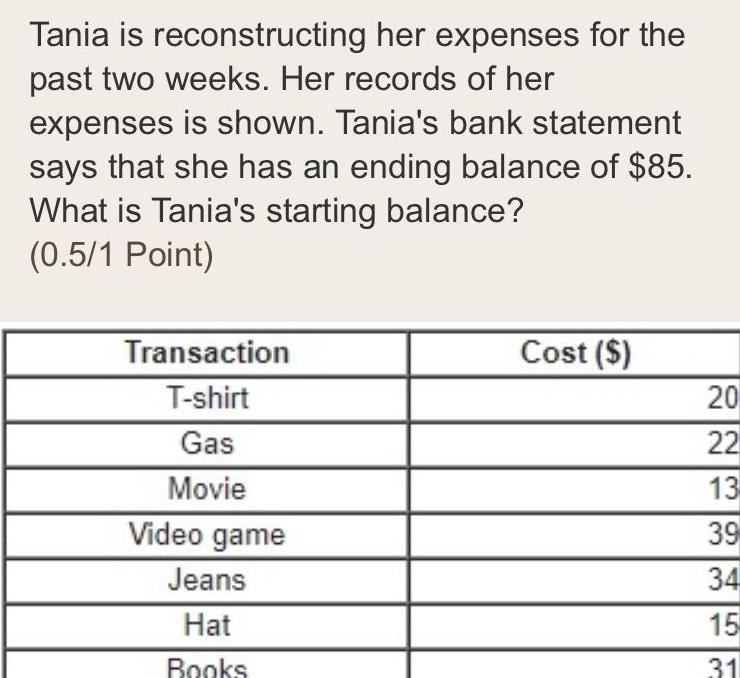
StatisticsTania is reconstructing her expenses for the past two weeks. Her records of her expenses is shown. Tania's bank statement says that she has an ending balance of $85. What is Tania's starting balance?
Transaction Cost ($)
T-shirt 20
Gas 22
Movie 13
Video game 39
Jeans 34
Hat15
Books 31
Math
Statistics(a) Find the area under the standard normal curve that lies between z=0.27 and z=1.07.
The area between z=0.27 and z= 1.07 is
Math
StatisticsSuppose that 75% of students have taken statistics. We survey 15 students and ask them if they have taken statistics. Let X be the random variable that counts how many people in such surveys that have taken statistics. Find the probability that 12 or more of the students in the survey have taken statistics. In other words find the P(X≥ 12). Give your answer to the nearest thousandths (3 decimal places).
Math
StatisticsIn a country, the mean time served by prisoners released from prison for the first time is 35.1 months. Assume the standard deviation of the times served is 17.3 months. Let x denote time served to first release by a prisoner. Complete parts (a) through (e) below.
a. Find the standardized version of x.
Z=
(Type an expression using x as the variable. Do not simplify.)

Math
StatisticsThe following data are the distances between a sample of 20 retail stores and a large distribution center. The distances are in miles.
29; 31; 36; 40; 58; 67; 68; 69; 76; 80; 81; 95; 96; 96; 99; 106; 112; 127; 145; 150
Find the value that is one standard deviation below the mean. (Round your answer to one decimal place.)
Math
StatisticsMark's morning class scored an average of 89.25 points across 4 tests. His evening class scored an average of 94.50 points across 4 tests. What was the average test score between both classes across all 8 tests? Estimate your answer to 2 decimal places.
Math
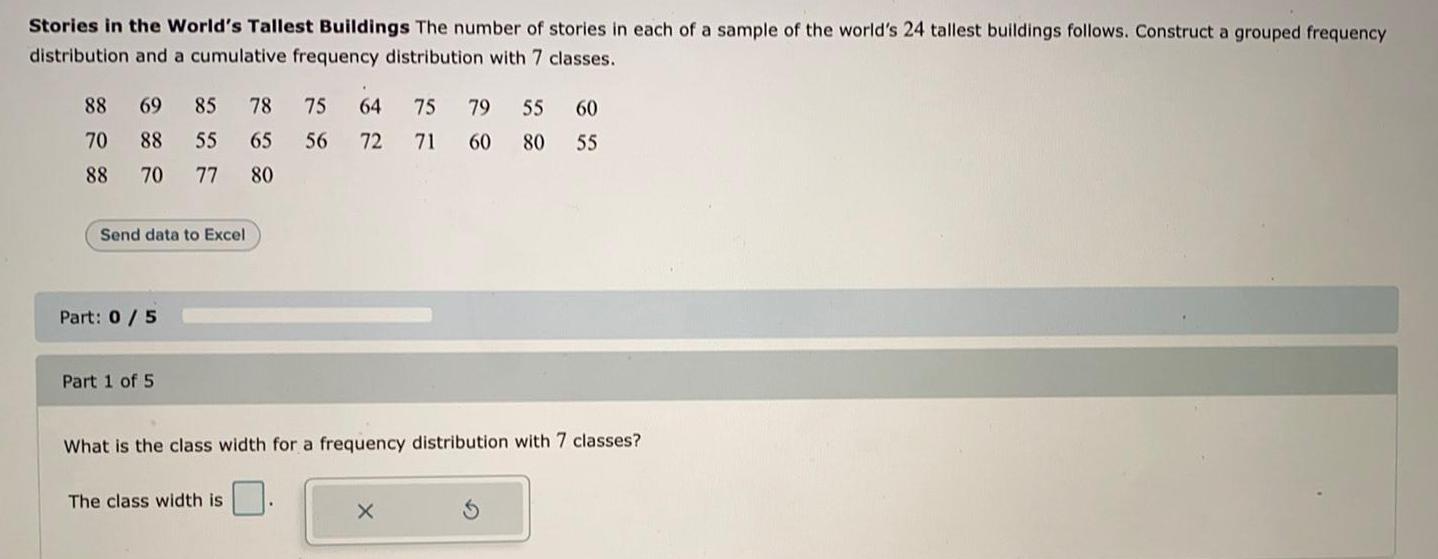
StatisticsStories in the World's Tallest Buildings The number of stories in each of a sample of the world's 24 tallest buildings follows. Construct a grouped frequency distribution and a cumulative frequency distribution with 7 classes.
88 69 85 78 75 64 75 79 55 60
70 88 55 65 56 72 71 60 80 55
88 70 77 80
What is the class width for a frequency distribution with 7 classes?
The class width is
Math
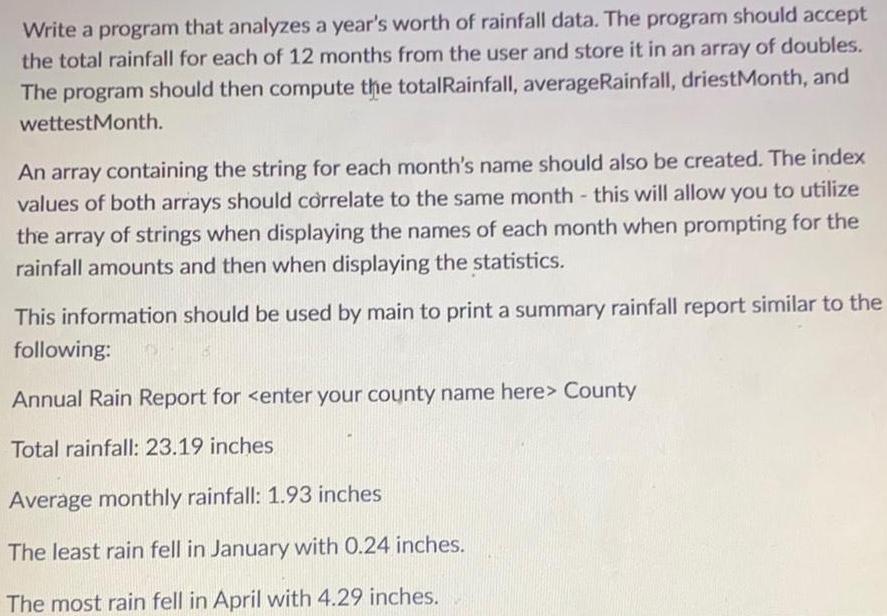
StatisticsWrite a program that analyzes a year's worth of rainfall data. The program should accept the total rainfall for each of 12 months from the user and store it in an array of doubles. The program should then compute the totalRainfall, averageRainfall, driest Month, and
wettestMonth.
An array containing the string for each month's name should also be created. The index values of both arrays should correlate to the same month - this will allow you to utilize the array of strings when displaying the names of each month when prompting for the rainfall amounts and then when displaying the statistics.
This information should be used by main to print a summary rainfall report similar to the
following:
Annual Rain Report for <enter your county name here> County
Total rainfall: 23.19 inches
Average monthly rainfall: 1.93 inches
The least rain fell in January with 0.24 inches.
The most rain fell in April with 4.29 inches.
Math
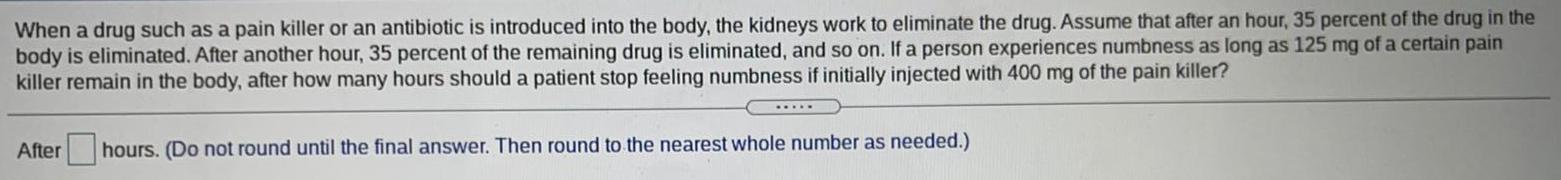
StatisticsWhen a drug such as a pain killer or an antibiotic is introduced into the body, the kidneys work to eliminate the drug. Assume that after an hour, 35 percent of the drug in the body is eliminated. After another hour, 35 percent of the remaining drug is eliminated, and so on. If a person experiences numbness as long as 125 mg of a certain pain killer remain in the body, after how many hours should a patient stop feeling numbness if initially injected with 400 mg of the pain killer?
After hours. (Do not round until the final answer. Then round to the nearest whole number as needed.)
Math
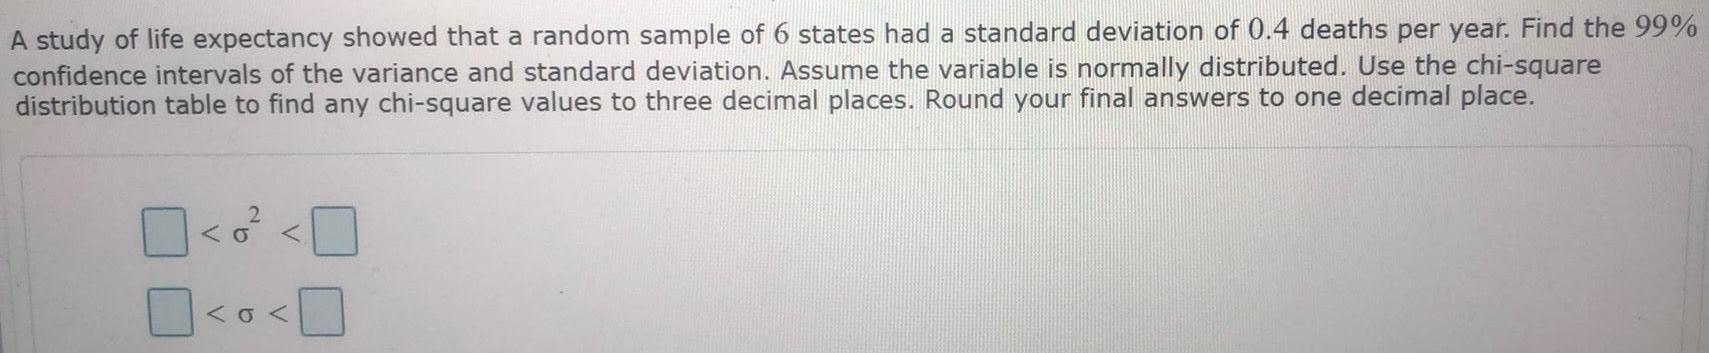
StatisticsA study of life expectancy showed that a random sample of 6 states had a standard deviation of 0.4 deaths per year. Find the 99% confidence intervals of the variance and standard deviation. Assume the variable is normally distributed. Use the chi-square distribution table to find any chi-square values to three decimal places. Round your final answers to one decimal place.
Math
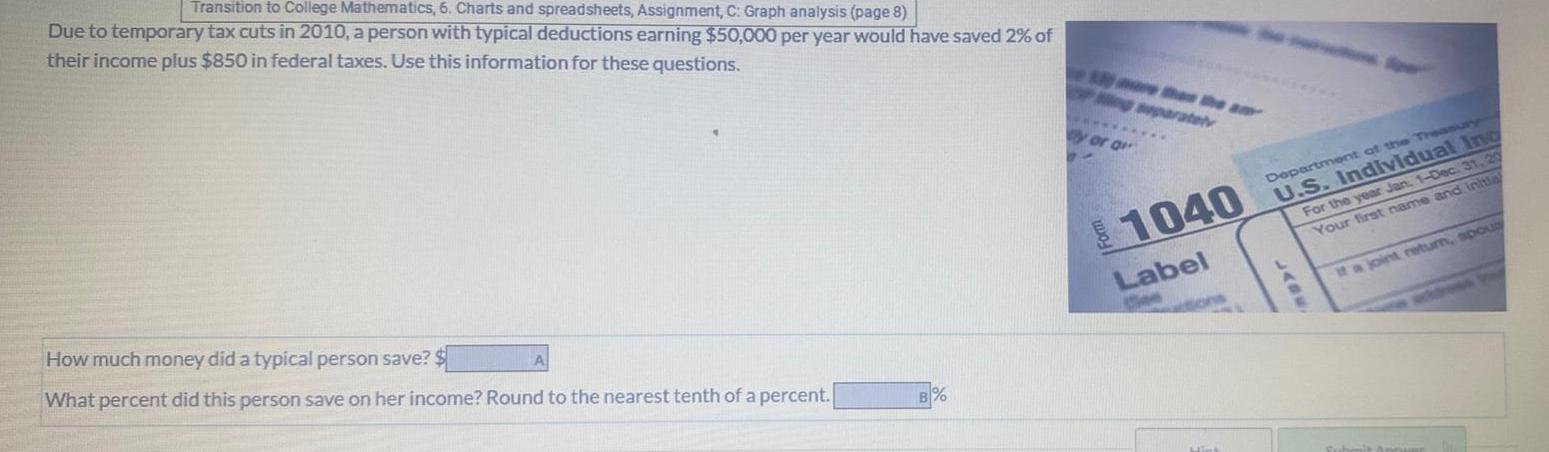
StatisticsDue to temporary tax cuts in 2010, a person with typical deductions earning $50,000 per year would have saved 2% of their income plus $850 in federal taxes. Use this information for these questions. How much money did a typical person save? $ What percent did this person save on her income? Round to the nearest tenth of a percent.
Math
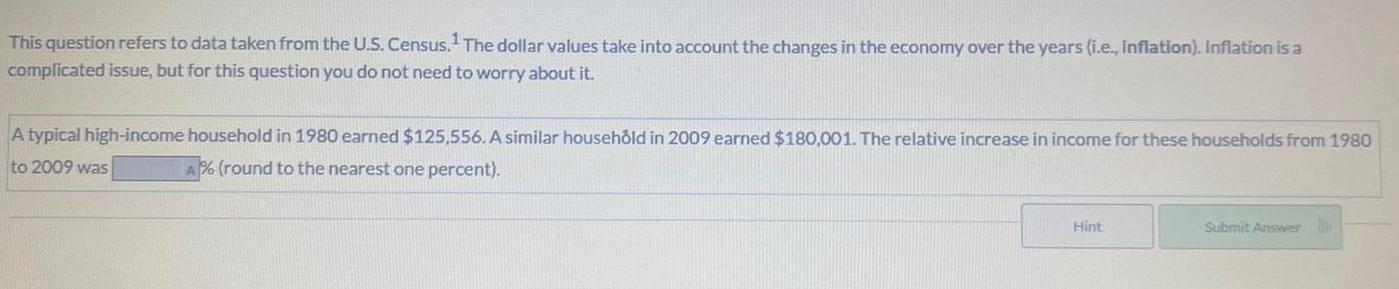
StatisticsThis question refers to data taken from the U.S. Census.¹ The dollar values take into account the changes in the economy over the years (i.e., inflation). Inflation is a complicated issue, but for this question you do not need to worry about it. A typical high-income household in 1980 earned $125,556. A similar household in 2009 earned $180,001. The relative increase in income for these households from 1980 to 2009 was
Math
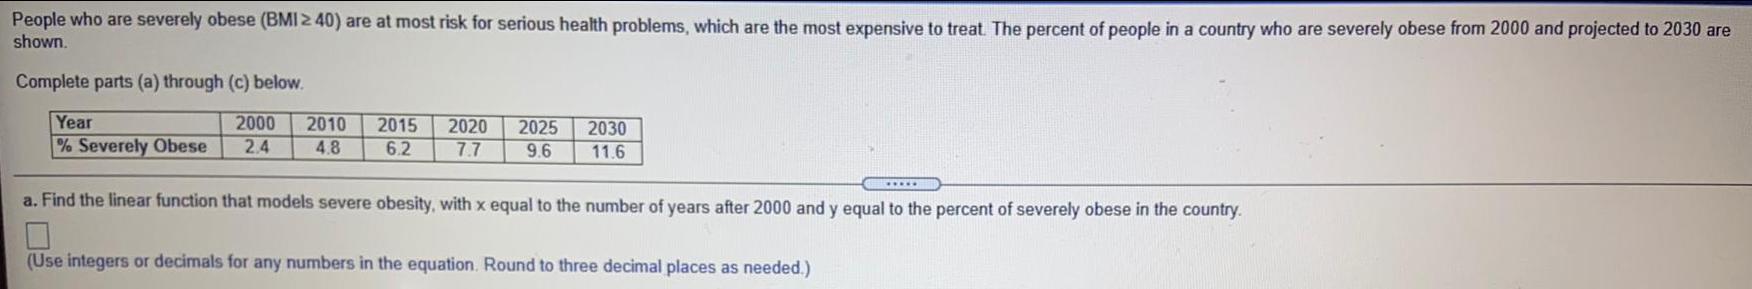
StatisticsPeople who are severely obese (BMI ≥40) are at most risk for serious health problems, which are the most expensive to treat. The percent of people in a country who are severely obese from 2000 and projected to 2030 are shown.
Complete parts (a) through (c) below.
a. Find the linear function that models severe obesity, with x equal to the number of years after 2000 and y equal to the percent of severely obese in the country.
Math
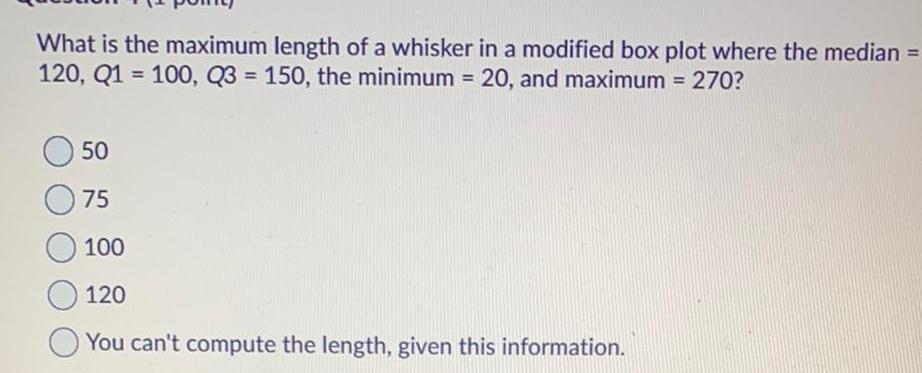
StatisticsWhat is the maximum length of a whisker in a modified box plot where the median = 120, Q1 = 100, Q3= 150, the minimum = 20, and maximum = 270?
50
75
100
120
You can't compute the length, given this information.
Math
StatisticsThe number N (in billions) of debit card transactions can be approximated by the equation N= 3.2x+8.8, where x is the number of years since 2000. In what year were there 28,000,000,000 debit card transactions? There were 28,000,000,000 debit card transactions in the year
Math
StatisticsThe formula S=C(1+r) can be used to calculate how many years, t, it will take the price of a loaf of bread to increase from C dollars to S dollars with an annual inflation rate of r, written as a decimal. How many years will it take the price of a loaf of bread to increase from $2.30 to $3.15 with an annual inflation rate of 3% ? Round your answer to the nearest tenth of a year.
Math
StatisticsYou have a distribution summarizing the number of days in the past two months (60 days) that an individual watched TV. The median number of days = 25, the lower quartile = 21, and upper quartile = 42. Given this information, which of the following statements are true?
The lower outlier threshold value is 10.
The threshold value for the upper outlier is 31.5.
This distribution is skewed to the right. There are no outliers in this distribution.
This distribution is roughly normally distributed.
Math
StatisticsAn Early Childhood Education student is doing a report on how many children aged 2 know their colors. The student collected a random sample of 50 children of age 2 and found that 42 of them knew their colors. What is the sample statistic? Give your answer in percent form.
Math
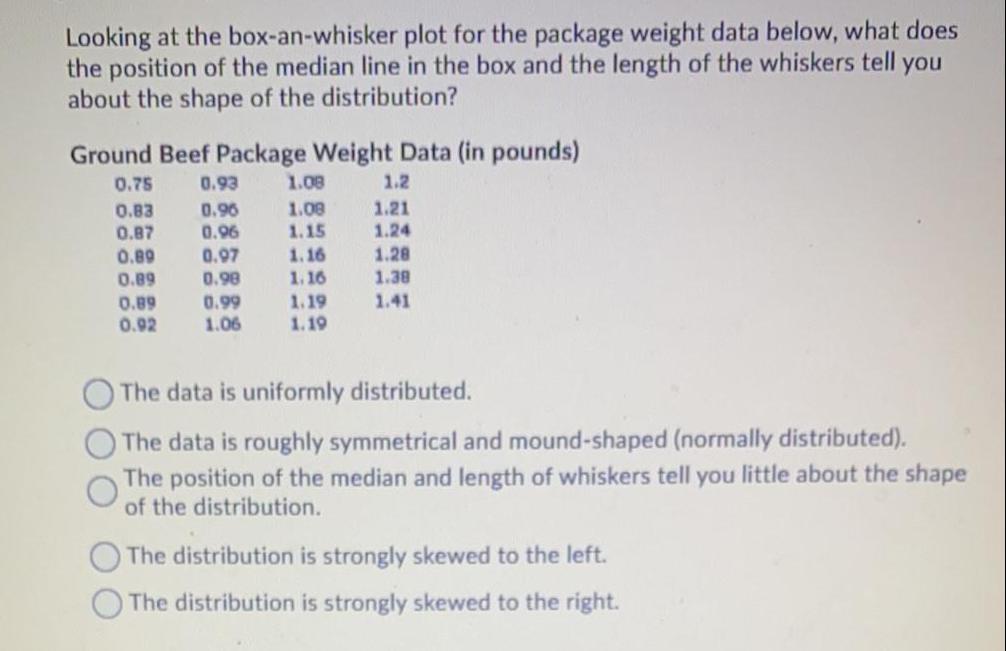
StatisticsLooking at the box-an-whisker plot for the package weight data below, what does the position of the median line in the box and the length of the whiskers tell you about the shape of the distribution?
Ground Beef Package Weight Data (in pounds)
The data is uniformly distributed.
The data is roughly symmetrical and mound-shaped (normally distributed).
The position of the median and length of whiskers tell you little about the shape of the distribution.
The distribution is strongly skewed to the left.
The distribution is strongly skewed to the right.
Math
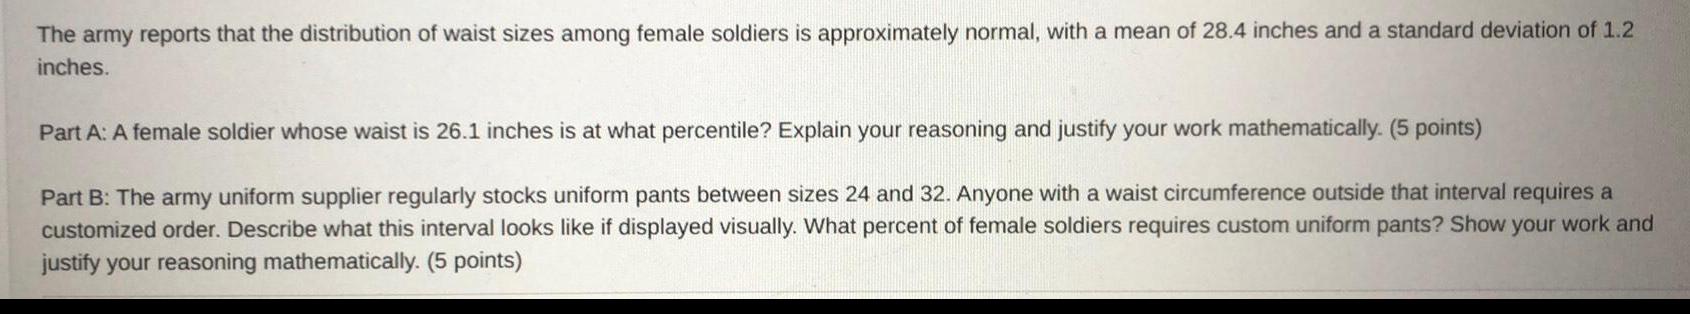
StatisticsThe army reports that the distribution of waist sizes among female soldiers is approximately normal, with a mean of 28.4 inches and a standard deviation of 1.2 inches. Part A: A female soldier whose waist is 26.1 inches is at what percentile? Explain your reasoning and justify your work mathematically. (5 points) Part B: The army uniform supplier regularly stocks uniform pants between sizes 24 and 32. Anyone with a waist circumference outside that interval requires a customized order. Describe what this interval looks like if displayed visually. What percent of female soldiers requires custom uniform pants? Show your work and justify your reasoning mathematically. (5 points)
Math
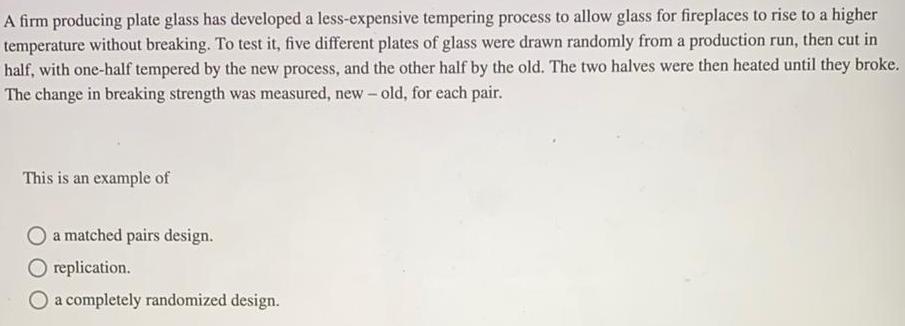
StatisticsA firm producing plate glass has developed a less-expensive tempering process to allow glass for fireplaces to rise to a higher temperature without breaking. To test it, five different plates of glass were drawn randomly from a production run, then cut in half, with one-half tempered by the new process, and the other half by the old. The two halves were then heated until they broke. The change in breaking strength was measured, new-old, for each pair.
This is an example of
a matched pairs design.
replication.
a completely randomized design.
Math
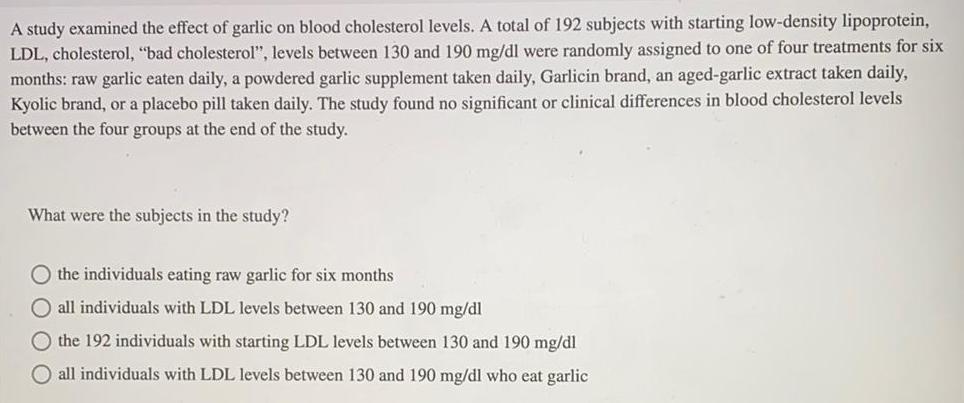
StatisticsA study examined the effect of garlic on blood cholesterol levels. A total of 192 subjects with starting low-density lipoprotein, LDL, cholesterol, "bad cholesterol", levels between 130 and 190 mg/dl were randomly assigned to one of four treatments for six months: raw garlic eaten daily, a powdered garlic supplement taken daily, Garlicin brand, an aged-garlic extract taken daily, Kyolic brand, or a placebo pill taken daily. The study found no significant or clinical differences in blood cholesterol levels between the four groups at the end of the study. What were the subjects in the study? the individuals eating raw garlic for six months all individuals with LDL levels between 130 and 190 mg/dl the 192 individuals with starting LDL levels between 130 and 190 mg/dl all individuals with LDL levels between 130 and 190 mg/dl who eat garlic
Math
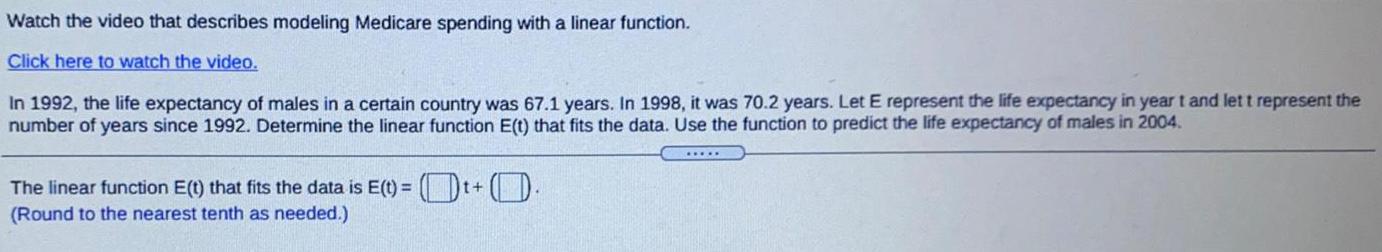
StatisticsWatch the video that describes modeling Medicare spending with a linear function. Click here to watch the video. In 1992, the life expectancy of males in a certain country was 67.1 years. In 1998, it was 70.2 years. Let E represent the life expectancy in yeart and let t represent the number of years since 1992. Determine the linear function E(t) that fits the data. Use the function to predict the life expectancy of males in 2004. The linear function E(t) that fits the data is E(t)= (¹+0. (Round to the nearest tenth as needed.)
Math
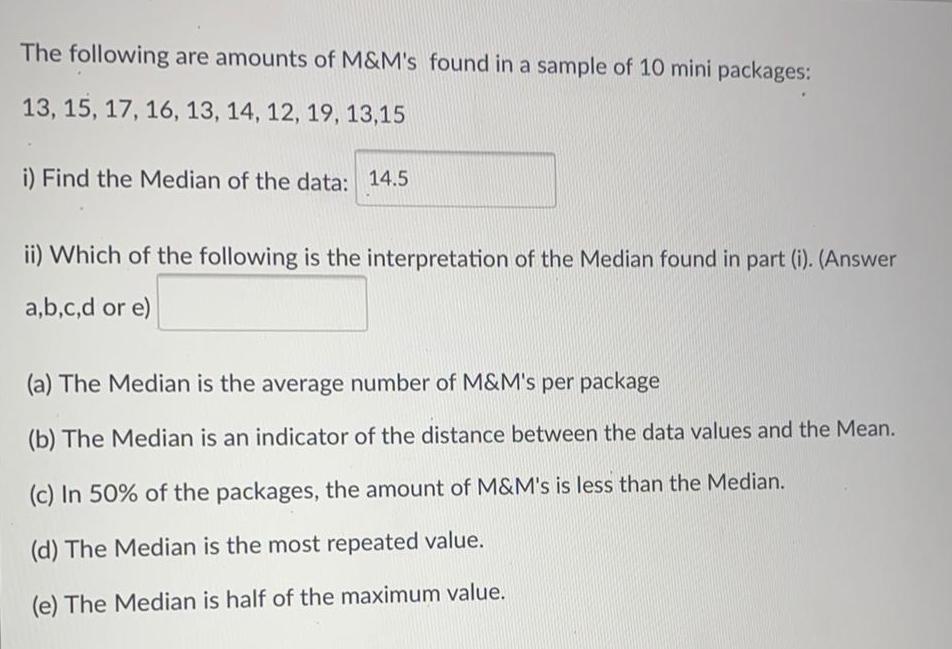
StatisticsThe following are amounts of M&M's found in a sample of 10 mini packages:
13, 15, 17, 16, 13, 14, 12, 19, 13,15
i) Find the Median of the data: 14.5
ii) Which of the following is the interpretation of the Median found in part (i). (Answer
a,b,c,d or e)
(a) The Median is the average number of M&M's per package
(b) The Median is an indicator of the distance between the data values and the Mean.
(c) In 50% of the packages, the amount of M&M's is less than the Median.
(d) The Median is the most repeated value.
(e) The Median is half of the maximum value.
Math
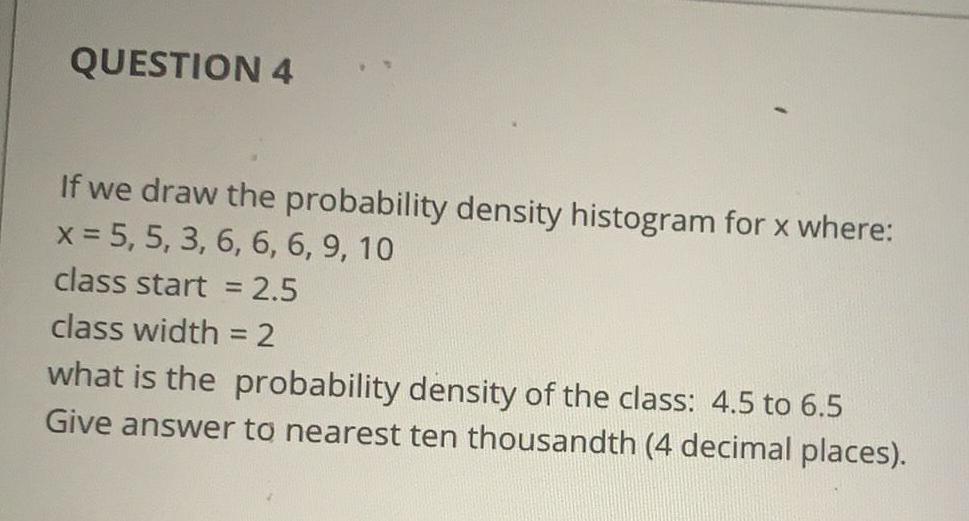
StatisticsIf we draw the probability density histogram for x where:
x = 5, 5, 3, 6, 6, 6, 9, 10
class start = 2.5
class width=2
what is the probability density of the class: 4.5 to 6.5.
Give answer to nearest ten thousandth (4 decimal places).
Math
StatisticsFind the value of an investment of $10,000 for 13 years at an annual interest rate of 3.85% compounded continuously.
The value of the investment is $
Math
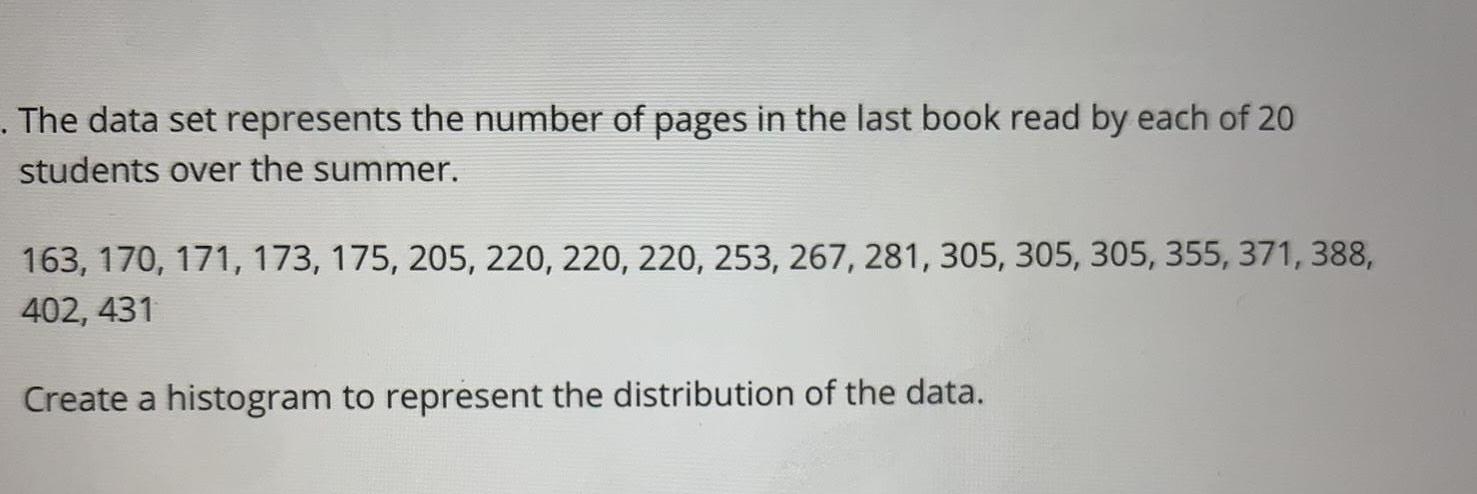
StatisticsThe data set represents the number of pages in the last book read by each of 20 students over the summer.
163, 170, 171, 173, 175, 205, 220, 220, 220, 253, 267, 281, 305, 305, 305, 355, 371, 388, 402, 431
Create a histogram to represent the distribution of the data.
Math
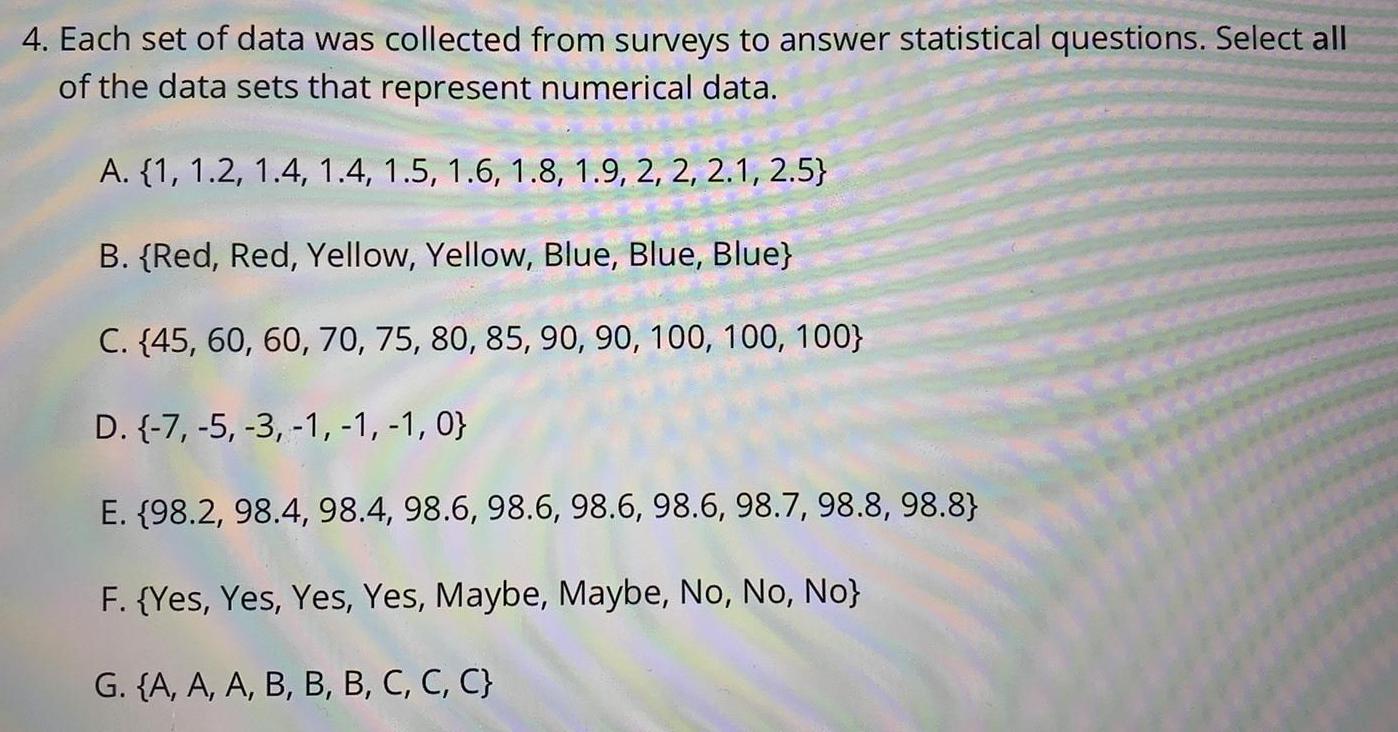
StatisticsEach set of data was collected from surveys to answer statistical questions. Select all of the data sets that represent numerical data.
A. {1, 1.2, 1.4, 1.4, 1.5, 1.6, 1.8, 1.9, 2, 2, 2.1, 2.5}
B. {Red, Red, Yellow, Yellow, Blue, Blue, Blue}
C. {45, 60, 60, 70, 75, 80, 85, 90, 90, 100, 100, 100}
D. {-7, -5, -3, -1,-1,-1, 0}
E. {98.2, 98.4, 98.4, 98.6, 98.6, 98.6, 98.6, 98.7, 98.8, 98.8}
F. (Yes, Yes, Yes, Yes, Maybe, Maybe, No, No, No}
G. {A, A, A, B, B, B, C, C, C}
Math
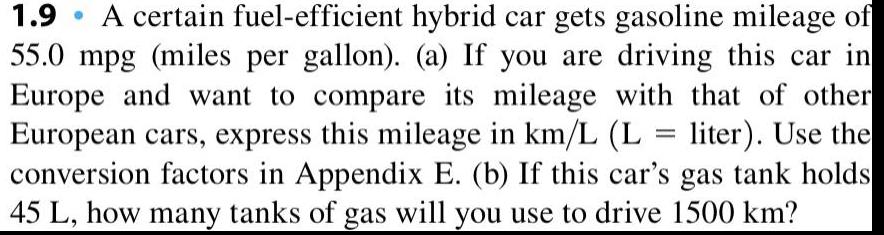
StatisticsA certain fuel-efficient hybrid car gets gasoline mileage of
55.0 mpg (miles per gallon). (a) If you are driving this car in
Europe and want to compare its mileage with that of other
European cars, express this mileage in km/L (L = liter). Use the
conversion factors in Appendix E. (b) If this car's gas tank holds
45 L, how many tanks of gas will you use to drive 1500 km?
Math
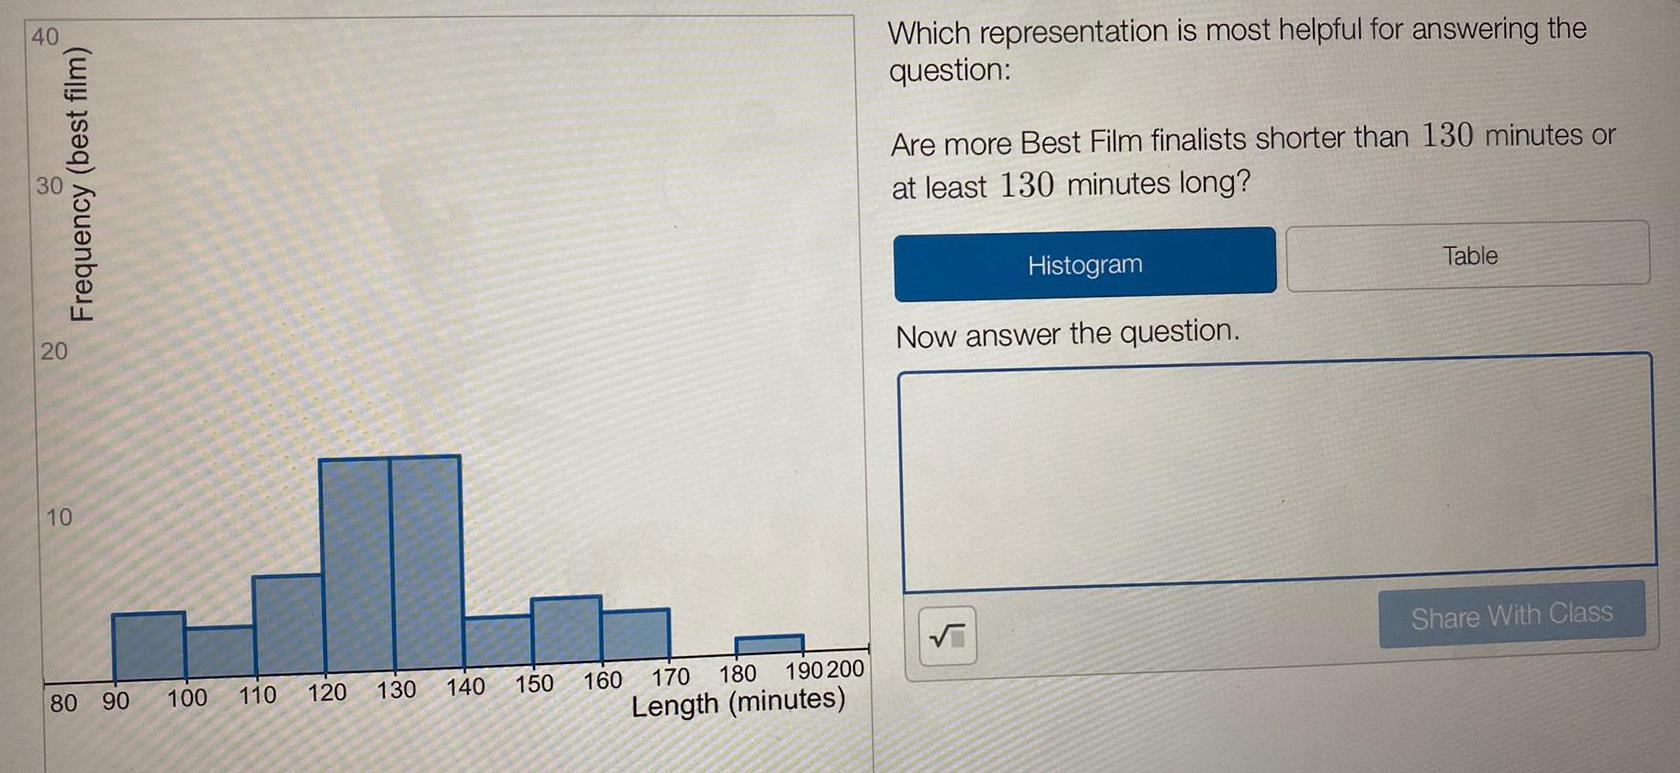
StatisticsWhich representation is most helpful for answering the
question:
Are more Best Film finalists shorter than 130 minutes or
at least 130 minutes long?
Math
StatisticsTeachers' Salaries The average annual salary for all U.S. teachers is $47,750. Assume that the distribution is normal and the standard deviation is $5680. Find these probabilities of the earnings of a teacher selected randomly. Round the final answers to at least four decimal places and intermediate value calculations to two decimal places.
Math
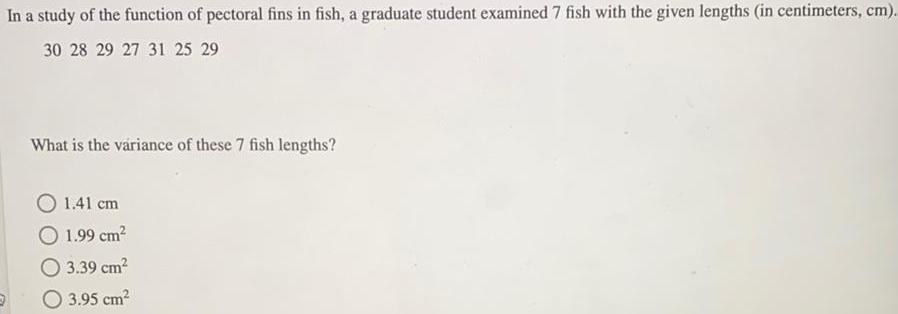
StatisticsIn a study of the function of pectoral fins in fish, a graduate student examined 7 fish with the given lengths (in centimeters, cm).
30 28 29 27 31 25 29
What is the variance of these 7 fish lengths?
1.41 cm
1.99 cm²
3.39 cm²
3.95 cm²
Math
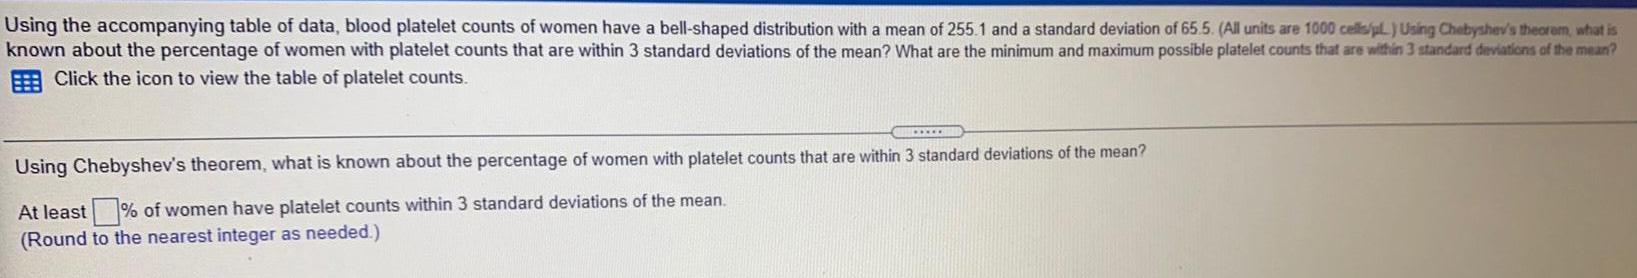
StatisticsUsing the accompanying table of data, blood platelet counts of women have a bell-shaped distribution with a mean of 255.1 and a standard deviation of 65.5. (All units are 1000 cells/pl.) Using Chebyshev's theorem, what is
known about the percentage of women with platelet counts that are within 3 standard deviations of the mean? What are the minimum and maximum possible platelet counts that are within 3 standard deviations of the mean?
Click the icon to view the table of platelet counts.
Using Chebyshev's theorem, what is known about the percentage of women with platelet counts that are within 3 standard deviations of the mean?
At least% of women have platelet counts within 3 standard deviations of the mean.
(Round to the nearest integer as needed.)
Math
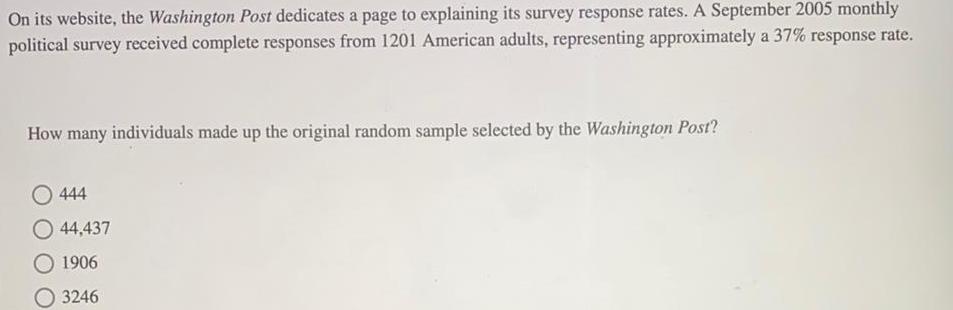
StatisticsOn its website, the Washington Post dedicates a page to explaining its survey response rates. A September 2005 monthly political survey received complete responses from 1201 American adults, representing approximately a 37% response rate.
How many individuals made up the original random sample selected by the Washington Post?
444
44,437
1906
3246
Math
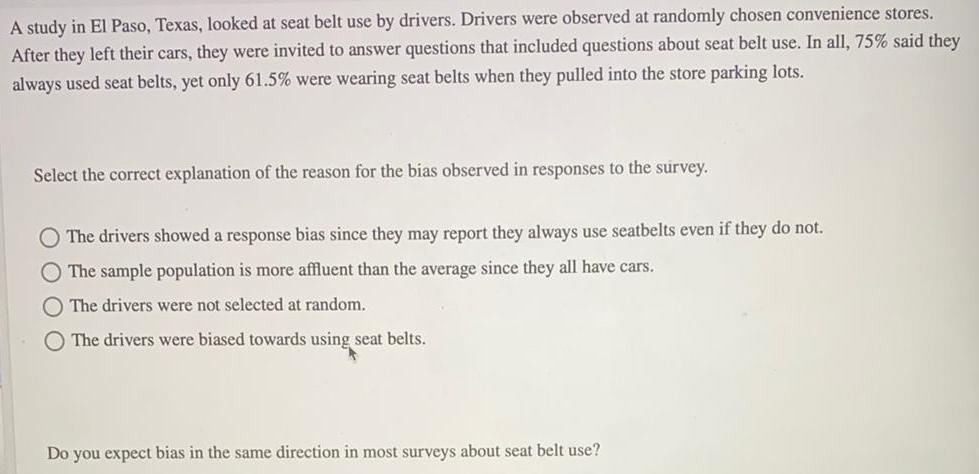
StatisticsA study in El Paso, Texas, looked at seat belt use by drivers. Drivers were observed at randomly chosen convenience stores.
After they left their cars, they were invited to answer questions that included questions about seat belt use. In all, 75% said they
always used seat belts, yet only 61.5% were wearing seat belts when they pulled into the store parking lots.
Select the correct explanation of the reason for the bias observed in responses to the survey.
The drivers showed a response bias since they may report they always use seatbelts even if they do not.
The sample population is more affluent than the average since they all have cars.
The drivers were not selected at random.
The drivers were biased towards using seat belts.
Do you expect bias in the same direction in most surveys about seat belt use?
Math
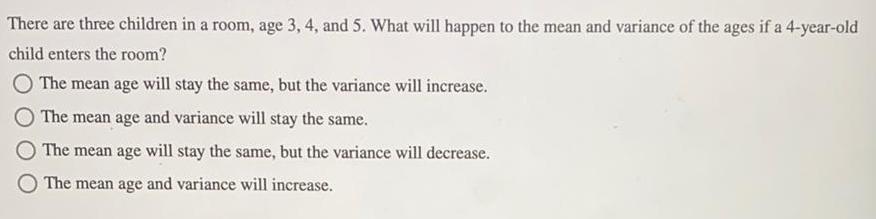
StatisticsThere are three children in a room, age 3, 4, and 5. What will happen to the mean and variance of the ages if a 4-year-old
child enters the room?
The mean age will stay the same, but the variance will increase.
The mean age and variance will stay the same.
The mean age will stay the same, but the variance will decrease.
The mean age and variance will increase.
Math
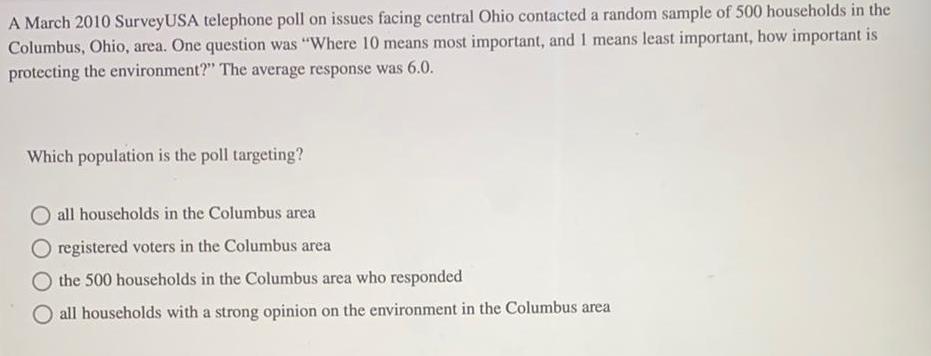
StatisticsA March 2010 Survey USA telephone poll on issues facing central Ohio contacted a random sample of 500 households in the Columbus, Ohio, area. One question was "Where 10 means most important, and I means least important, how important is protecting the environment?" The average response was 6.0.
Which population is the poll targeting?
all households in the Columbus area
registered voters in the Columbus area.
the 500 households in the Columbus area who responded
all households with a strong opinion on the environment in the Columbus area.
Math
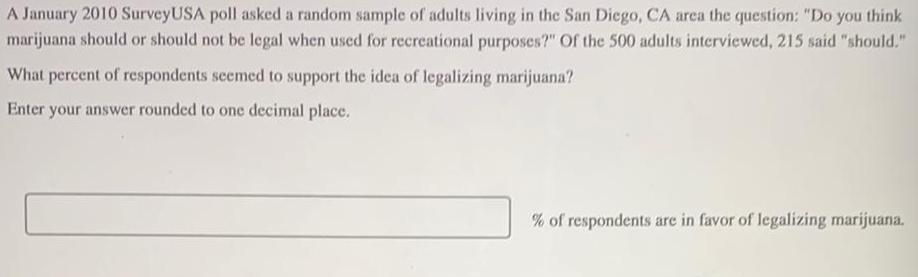
StatisticsA January 2010 SurveyUSA poll asked a random sample of adults living in the San Diego, CA area the question: "Do you think
marijuana should or should not be legal when used for recreational purposes?" Of the 500 adults interviewed, 215 said "should."
What percent of respondents seemed to support the idea of legalizing marijuana?
Enter your answer rounded to one decimal place.
% of respondents are in favor of legalizing marijuana.
Math
StatisticsWhen Savannah commutes to work, the amount of time it takes her to arrive is normally distributed with a mean of 28 minutes and a standard deviation of 3.5 minutes. Out of the 213 days that Savannah commutes to work per year, how many times would her commute be shorter than 22 minutes, to the nearest whole number?
a 104
b 321
c 9
d 56

Math
StatisticsPart I:
Calculate the Sample Mean, Variance and Standard Deviation of the following data set, using Formulas.
Data: 56; 56; 56; 58; 59; 60; 62; 64; 64; 65; 67.
First, use the text box provided on Question 1 to show your work. Write directly there or upload a file.
Next, enter each answer in their corresponding space, provided in Questions 2,3, and 4.
This will allow you to check if any answers are incorrect, and give you the opportunity to
correct those answers on an additional attempt.
Question 1
Describe the work needed to obtain the answers to Part I, according to formulas. Round
values to two decimal Places.
Two options:
1. Write directly on the textbox. You may use the Canvas Equation editor if needed (Click
on the 3 dots above the textbox, and look for the following icon:
√x
2. Use your own paper, scan it, and upload your file. To access the file upload tool, click on
the 3 dots above the textbox and look for the "Document/paper" icon. You may use
CamScanner to take a picture of your work and upload it as a PDF file. Please, make sure
you submit a PDF file. Pictures and images are usually not clear. Also, use a clear
handwriting and be organized.

Math
StatisticsThe following data show the lengths of boats in a marina.
16; 17; 19; 20; 20; 21; 23; 24; 25; 25; 25; 26; 26; 27; 27; 27; 28; 29; 30; 32;
33; 33; 34; 35; 37; 39; 40
A) Provide the 5-Number-Summary of the Data in the textbox given below.
B) Construct a Boxplot on your own paper. Then, upload a picture of your boxplot on the
textbox given below. A picture or a PDF will be Ok for this graph, as long as it is visible.
To upload a Picture, use the Image Icon. To upload a PDF, use the Document Icon. You
can find these icons by clicking on the 3 dots above the textbox.
Make sure you draw the boxplot over a number line, like the one shown below.
15 16 17 18 19 20 21 22 23 24 25 26 27 28 29 30 31 32 33 34 35 36 37 38 39 40