Statistics Questions and Answers

Math
StatisticsPart I:
Calculate the Sample Mean, Variance and Standard Deviation of the following data set, using Formulas.
Data: 56; 56; 56; 58; 59; 60; 62; 64; 64; 65; 67.
First, use the text box provided on Question 1 to show your work. Write directly there or upload a file.
Next, enter each answer in their corresponding space, provided in Questions 2,3, and 4.
This will allow you to check if any answers are incorrect, and give you the opportunity to
correct those answers on an additional attempt.
Question 1
Describe the work needed to obtain the answers to Part I, according to formulas. Round
values to two decimal Places.
Two options:
1. Write directly on the textbox. You may use the Canvas Equation editor if needed (Click
on the 3 dots above the textbox, and look for the following icon:
√x
2. Use your own paper, scan it, and upload your file. To access the file upload tool, click on
the 3 dots above the textbox and look for the "Document/paper" icon. You may use
CamScanner to take a picture of your work and upload it as a PDF file. Please, make sure
you submit a PDF file. Pictures and images are usually not clear. Also, use a clear
handwriting and be organized.

Math
StatisticsThe following data show the lengths of boats in a marina.
16; 17; 19; 20; 20; 21; 23; 24; 25; 25; 25; 26; 26; 27; 27; 27; 28; 29; 30; 32;
33; 33; 34; 35; 37; 39; 40
A) Provide the 5-Number-Summary of the Data in the textbox given below.
B) Construct a Boxplot on your own paper. Then, upload a picture of your boxplot on the
textbox given below. A picture or a PDF will be Ok for this graph, as long as it is visible.
To upload a Picture, use the Image Icon. To upload a PDF, use the Document Icon. You
can find these icons by clicking on the 3 dots above the textbox.
Make sure you draw the boxplot over a number line, like the one shown below.
15 16 17 18 19 20 21 22 23 24 25 26 27 28 29 30 31 32 33 34 35 36 37 38 39 40

Math
StatisticsThe typical amount of sleep per night for a new mother is 4.3 hours and a standard deviation equal to 1.4 hours. The amount of sleep per night new mothers get is bell-shaped. Use the Empirical Rule to complete each sentence.
(a) About what percentage of new mothers get between 1.5 and 7.1 hours of sleep per night? If your answer is say 82% enter 82 WITHOUT the % into the answer box.
(b) About what percentage of new mothers get between 0.100000000000001 and 8.5 hours of sleep per night? If your answer is say 82% enter 82 WITHOUT the % into the
answer box.
(c) About what percentage of new mothers get between 2.9 and 5.7 hours of sleep per night? If your answer is say 82% enter 82 WITHOUT the % into the answer box.

Math
StatisticsYou take random sample of 200 people from Salinas and find that their average income is $48, 000 per year with a standard deviation of $9000. Also assume that population incomes are normally distributed.
Approximately how many people make between $39, 000 and $57,000?

Math
StatisticsMarilee wants to earn an "A" in a class and needs an overall average of at least 91. Her test grades are 90, 91, 99, and 94. The average of her quizzes is 87
and counts as one test grade. The final exam counts as 2 test grades. What scores on the final exam would result in Marilee's overall average of 91 or greater?
Marilee must earn a score of (Choose one)
to earn an "A" in the class.
X
S

Math
StatisticsQuestion 11 of 12, Step 1 of 1
Given the sample-3,-9, 11, 12, add one more sample value that will neither change the mean nor the variance. Round to two decimal places as necessary. If this is
not possible, indicate "Cannot create sample".


Math
StatisticsResearchers at Mercy Birthing Hospital are conducting a study to determine what percent of
expectant mothers intend to give birth at home. The researchers asked 75 expectant mothers in
their third trimester, and 22% said that they intended to give birth at home.
1. Is this an experiment or an observational study? Explain your answer.
2. What is the population of this study?
3. What is the population parameter for this study? (What are the researchers trying to
determine?)
4. What is the sample in this study?
5. What is the sample statistic?

Math
StatisticsIt can be shown that the sum of the residuals from a least squares regression line always equals zero.
a)Does it follow from this fact that the mean of the residuals must equal zero?
A.Yes
B.No
b) Does it follow from this fact that the median of the residuals must equal zero-yes or no?
A. Yes
B.No
This question should be very easy for all students, but some struggle. The question b
sum of values equals zero, does the mean have to equal zero, and does the median have t
answer is yes to the first, because the mean is calculated as the sum divided by the n

Math
Statistics. Consider these two new statistics that we have not yet studied:
mid-range = (minimum + maximum)/2
mid-hinge = (lower quartile + upper quartile)/2
a) Is the mid-range a measure of center or a measure of variability?
A. Center
B. Variability
b) Is the mid-hinge a measure of center or a measure of variability?
A. Center
B. Variability
c) Is the mid-range resistant to outliers?
A. Yes
B. No
d) Is the mid-hinge resistant to outliers?
A. Yes
B. No
●

Math
Statistics1. Determine the mean, median, mode and range of each data set and then circle which measu
best represents the data.
3, 5, 1, 5, 1, 1, 2, 3, 15 6. 12, 9, 17, 15, 10
MEAN =
13, 30, 16, 19, 20, 22, 25, 31
MEAN =
MEDIAN =
MEAN =
MEDIAN =
14, 15, 3, 15, 14, 14, 18, 15, 8, 16
MEDIAN =
MODE=
MODE=
MODE=

Math
StatisticsOn a standardized exam, the scores are normally distributed with a mean of 48 and a
standard deviation of 5. Find the z-score of a person who scored 38 on the exam.

Math
StatisticsScores in the Rose Bowl The data show the scores of the winning teams in the Rose Bowl. Construct a frequency distribution for the data using a class width
of 8.
26
22
19
43
32 35 32 15 36
19 18 39 36
18 43 19 24
44
36 47 30 39 36
18 20 43 18
36 32
15
20
22 26
21
15 15
25 12
21
16
Send data to Excel
Part: 0/3
Part 1 of 3
Find the class limits. The first lower class limit is 12.

Math
StatisticsSalaries of Governors Here are the salaries (in dollars) of the governors of 23 randomly selected states. Construct a grouped frequency distributic classes.
112,895 117,312 140,533 110,000
115,331 95,000 177,500 120,303
139,590 150,000 173,987 130,000
133,821 144,269 142,542 150,000
145,885 105,000 93,600 166,891
130,273 70,000
113,834
What is the class width for a frequency distribution with 7 classes?
The class width is

Math
StatisticsThe population of a city started at 378, 000. Every year thereafter it decreased by 23,000 individuals.
Enter a number in each box to make a numeric sequence to represent the pattern.

Math
StatisticsThe Acme Company manufactures widgets. The distribution of widget weights is bell-shaped. The widget weights have a mean of 38 ounces and a standard deviation of 5 ounces.
Use the Empirical Rule to answer the following:
a) 95% of the widget weights lie between
b) What percentage of the widget weights lie between 38 and 43 ounces?
c) What percentage of the widget weights lie between 23 and 53 ounces?
and

Math
StatisticsThe best basketball player on a college team kept track of the number of baskets she made in her last eight games.
11 15 19 12 11 16 11 17
Calculate the mean, median, range, and midrange of the number of baskets she made in her last eight games.
Mean, 15; Median, 14; Range, 13.5; Midrange, 8
Mean, 13.5; Median, 8; Range, 15; Midrange, 14
Mean, 8: Median, 15; Range, 14; Midrange, 13.5
Mean, 14; Median, 13.5; Range, 8; Midrange, 15

Math
StatisticsA test score of 48.4 on a test having a mean of 66 and a standard deviation of 11. Find the z-score corresponding to the given value and use the z-score to determine whether the value is significant. Consider a score to be significant if its z-score
is less than -2.00 or greater than 2.00. Round the z-score to the nearest tenth if necessary.
A. -1.6; not significant
B. 1.6; not significant
C. -1.6; significant
D. -17.6; significant

Math
StatisticsFind the critical value Zα/2 that corresponds to the given confidence level.
89%
Za/2 = (Round to two decimal places as needed.)

Math
StatisticsOn a nationwide test taken by high school students, the mean score was 48 and the standard deviation was 11, The scores were normally distributed. Complete the following statements.
(a) Approximately 95% of the students scored between and.
(b) Approximately 2 ✓of the students scored between 37 and 59.

Math
StatisticsSuppose that the mean cranial capacity for men is 1130 cc (cubic centimeters) and that the standard deviation is 200 cc. Assuming that men's cranial capacities are normally distributed, complete the following statements.
(a) Approximately ___ of men have cranial capacities between 530 cc and 1730 cc.
(b) Approximately 68% of men have cranial capacities between __ cc and __ cc.

Math
StatisticsClaim: Fewer than 98% of adults have a cell phone. In a reputable poll of 1043 adults, 90% said that they have a cell phone. Find the value of the test statistic.
The value of the test statistic is.
(Round to two decimal places as needed.)

Math
StatisticsWhich of the following is associated with a parameter?
Choose the correct answer below.
A. Anumerical measurement describing some characteristic of a sample.
B. Data that were obtained from an entire population.
C. Data that were obtained from a voluntary poll at the end of a service call.
D. Data that were obtained from a sample.

Math
Statistics26. Veronica went to the mall and bought several small gifts for her sister's birthday. The prices of the items were the following:
$8, $10, $6, $7, $10, $2, $5, $3, $4
What is the mode price of the items?
$4.5
$5
$2
$6

Math
StatisticsThe following data refer to the weight gain (in pounds) of ten women during pregnancy.
85 41 29 39 37 41 43 30 36 35
Find the median:
Find the mean:
Compare the median and the mean.

Math
StatisticsSuppose that we wished to construct a frequency table for weights of Regular
Coke (in cans). The first several data values are:
0.8163,
0.8192,
0.8150,
0.8211,
0.8181,
(All measurements are in lbs; the full set of data is too large to list here.)
"Set up" the classes for a frequency table for this data. Use eight classes, a class
width of 0.0050 lb, and start the first class with 0.7900 lb.
You do not need to count up the frequencies (because, of course, you don't have
the full data set).

Math
StatisticsTwo statistics students at UCLA conducted an energy efficiency survey of graduate student apartments.
There were seven university apartment buildings, and the students randomly selected three to be included
in the study. In each building, they randomly chose 25 apartments. What is the largest group of students
that the study results represent?
X
O All UCLA graduate student apartments.
O All UCLA graduate student apartments in this group of seven buildings.
O All UCLA graduate student apartments in the three sampled buildings.
All UCLA graduate student apartments that were sampled in the three buildings.

Math
Statistics1. Determine the given info below. Round to the nearest tenth if necessary.
Make a box-and-whisker plot for the data given.
79, 98, 87, 82, 99
mode:
mean:
five-number summary for box and whisker plot:
minimum:
1st quartile:
IQR:
Diagram a box and whisker plot
standard deviation:
median:
maximum:
3rd quartile:

Math
StatisticsAn electric bill is an essential expense for young people who get their first
The following is a list of Jordan's monthly electric bills for the past
apartment.
10 months.
$115, $150, $144, $126, $90, $90, $95, $110,$120, $88
Round your answers to the nearest cent.
a. What is the mean monthly electric bill?
b. What is the range?
c. What is the variance?
d. What is the standard deviation?

Math
StatisticsSeven students are randomly selected from the students at a 24,000 student college. Thirty percent of the students in the school have a pet dog. The remaining seventy percent of the students do not have a pet dog.
Determine the mean and standard deviation for the distribution of the number of dog owners out of the seven randomly selected students.
Determine the probability exactly three of the seven students will have a pet dog.
Determine the probability at least one of the seven students will have a pet dog.

Math
Statistics3.2, 3.1, 4.5, 5.0, 4.1, 2.9, 1.8, 0.8, 2.2, 2.3, 3.1, 3.0
mode:
mean:
five-number summary for box and whisker plot:
minimum:
1st quartile:
IQR:
standard deviation:
median:
maximum:
3rd quartile:
Math
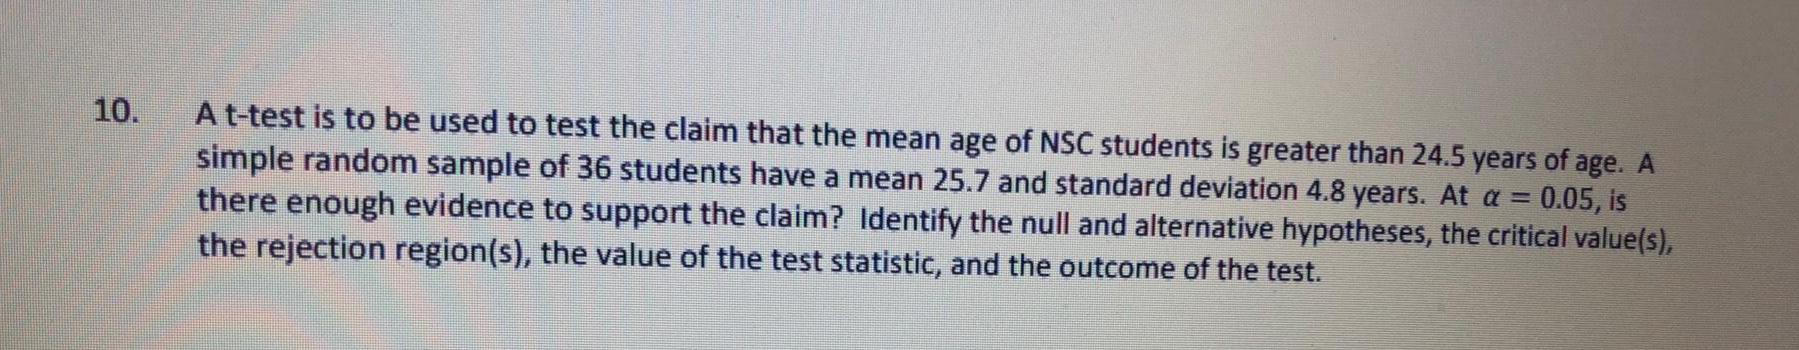
StatisticsA t-test is to be used to test the claim that the mean age of NSC students is greater than 24.5 years of age. A simple random sample of 36 students have a mean 25.7 and standard deviation 4.8 years. At a = there enough evidence to support the claim? Identify the null and alternative hypotheses, the critical value(s), 0.05, is the rejection region(s), the value of the test statistic, and the outcome of the test.

Math
StatisticsThe ages of students in a gymnastics class are 12, 15, 17, 9, 7, 8, 15, 10, 13,
6, 5, 7, 13, 10, 7, 9, 5, 6, 7, 7, and 4.
Determine the mean, median, mode and standard deviation for the
gymnastics class. Round to the nearest hundredth. Make a box-and-
whisker plot for the data given.
mean:
standard deviation:
Box and Whisker plot:
median:
mode:

Math
StatisticsIn a random sample of eight people, the mean driving distance to work was 23.1 miles and the standard deviation was 6.3 miles. Assume the population is normally
distributed and use the t-distribution to find the margin of error and construct a 95% confidence interval for the population mean μ. Interpret the results.
Identify the margin of error.
(Round to one decimal place as needed.)
Construct a 95% confidence interval for the population mean.
(Round to one decimal place as needed.)
Interpret the results. Select the correct choice below and fill in the answer box to complete your choice.
(Type an integer or a decimal. Do not round.)
A. It can be said that % of the population has a driving distance to work (in miles) that is between the interval's endpoints.
B. With confidence, it can be said that most driving distances to work (in miles) in the population are between the interval's endpoints.
C. With % confidence, it can be said that the population mean driving distance to work (in miles) is between the interval's endpoints.
D.% of all random samples of eight people from the population will have a mean driving distance to work (in miles) that is between the interval's endpoints.

Math
StatisticsWhat is the difference between independent and dependent events?
Choose the correct answer below.
Two events are independent if only one of the two events can occur. Two events are dependent if they can occur at the same time.
Two events are independent when the occurrence of one event does not affect the probability of the occurrence of the other event. Two events are dependent when the occurrence of one event affects the probability of the
occurrence of the other event.
Two events are independent if they can occur at the same time. Two events are dependent if only one of the two events can occur.
Two events are independent when the occurrence of one event affects the probability of the occurrence of the other event. Two events are dependent when the occurrence of one event does not affect the probability of the occurrence of the other event.

Math
StatisticsA sample survey was taken of 100 customers to determine which brand of snack crackers they prefer. Brand A was selected by about 17% of the customers, brand B was selected by about 50% of the customers, and brand C was selected by the remaining customers.
Which statistical model could be used to make predictions about the snack cracker brand a random customer may prefer?
A brand A: die roll is 3
brand B: die roll is less than 3
brand C: die roll is greater than 3
B. brand A: die roll is 1
brand B: die roll is even
brand C: die roll is odd
C. brand A: die roll is 4
brand B: die roll is greater than 4
brand C: die roll less than 4
D. brand A: die roll is 3
brand B: die roll is even
brand C: die roll is 1 or 5

Math
StatisticsA company's board of directors took a random sample of 10% of the company's employees and surveyed them about their happiness at work.
What would most likely happen if they decided to randomly sample 15% of the company's employees instead?
A. The sample mean would more closely model the population mean.
B. The sample mean would less closely model the population mean.
C. The sample mean would not be affected.
D. There is not enough information to determine how the sample mean would be affected.

Math
StatisticsHal earns a B on 75% of his tests. He divides a spinner into 12 equal spaces to model the grades he earns on his tests, with nine of the spaces representing a B. Which statement about his model is true?
A. His model can be improved the most by using eight of the spaces to represent a B.
B. His model can be improved the most by using every third space on the spinner to represent a B.
C. His model can be improved the most by dividing the spinner into 15 equal spaces.
D. His model cannot be improved.

Math
StatisticsMariah needs to randomly select one of three groups of students to make their presentation first. Which simulation tools could she use in this situation?
a six-sided number cube
two coins
a bag containing 12 chips in three different colors, with four of each color
a full standard deck of cards
a spinner divided evenly into four sections, with each section a different color

Math
StatisticsIn a survey of 2738 adults, 1475 say they have started paying bills online in the last year. Construct a 99% confidence interval for the population proportion. Interpret the results. A 99% confidence interval for the population proportion is (Round to three decimal places as needed.) Interpret your results. Choose the correct answer below.
A. With 99% confidence, it can be said that the sample proportion of adults who say they have started paying bills online in the last year is between the endpoints of the given confidence interval. B. The endpoints of the given confidence interval show that adults pay bills online 99% of the time. C. With 99% confidence, it can be said that the population proportion of adults who say they have started paying bills online in the last year is between the endpoints of the given confidence interval.

Math
Statisticsa) A snowman weighed 120 pounds when it started to melt. It melted at a constant rate of 8 pounds per hour. Write an equation for the described linear relation. Let x = # of hours the snowman had been melting and y = weight of the snowman.
b) What does correlation coefficient r = -0.55 indicate?

Math
StatisticsGabriella asked 5 of her coworkers how much storage space they were currently
using on their computer. Here are their responses (in gigabytes):
4, 8, 8, 9, 11
a. Find the mean
b. Find the standard deviation
c. Gabriella is currently using 6 gigabytes of storage on her computer. What
percentile is Gabriella's storage usage in relation to her coworkers'?

Math
StatisticsThe following data points represent the number of attendees at each of the dance
events hosted by Success Academy
44, 51, 47, 39, 32, 35, 34, 35, 40, 62
a. Find the interquartile range of the data set
b. A local newspaper wants to include photos of all of the dances that are at
or above the 80th percentile for attendance. What is the minimum number
of attendees a dance needs in order to get its photo in the newspaper?

Math
StatisticsIdentify the sampling techniques used, and discuss potential sources of bias (if any). Explain.
After a wildfire, a disaster area is divided into 250 equal grids. Thirty of the grids are selected, and every occupied household in the grid is interviewed to help focus relief efforts on what residents require the most.
What type of sampling is used?
OA. Stratified sampling is used, since the disaster area is divided into grids, and some of those grids are selected and everyone in those grids is interviewed.
OB. Cluster sampling is used, since the disaster area is divded into grids, and a random sample is taken from each grid.
OC. Stratified sampling is used, since the disaster area is divded into grids, and a random sample is taken from each grid.
O D. Cluster sampling is used, since the disaster area is divided into grids, and some of those grids are selected and everyone in those grids is interviewed.
What potential sources of bias are present, if any? Select all that apply.
A. Certain grids may have been much more severely damaged than others. The grids that are selected may not be representative in terms of damage.
B. Certain grids may have been much more severely damaged than others. Severely damaged grids may have fewer occupied households.
C. The sample only consists of grids that are easy to get. These grids may not be representative of the population.
D. There are no potential sources of bias.

Math
StatisticsGiven each data set, determine the mean, median, mode for each set of data. Construct a box and whisker plot for each data set, using the median.
1. 3, 8, 4, 9, 2, 15, 6, 11, 9
Mean:
Mode:
Median:
Math
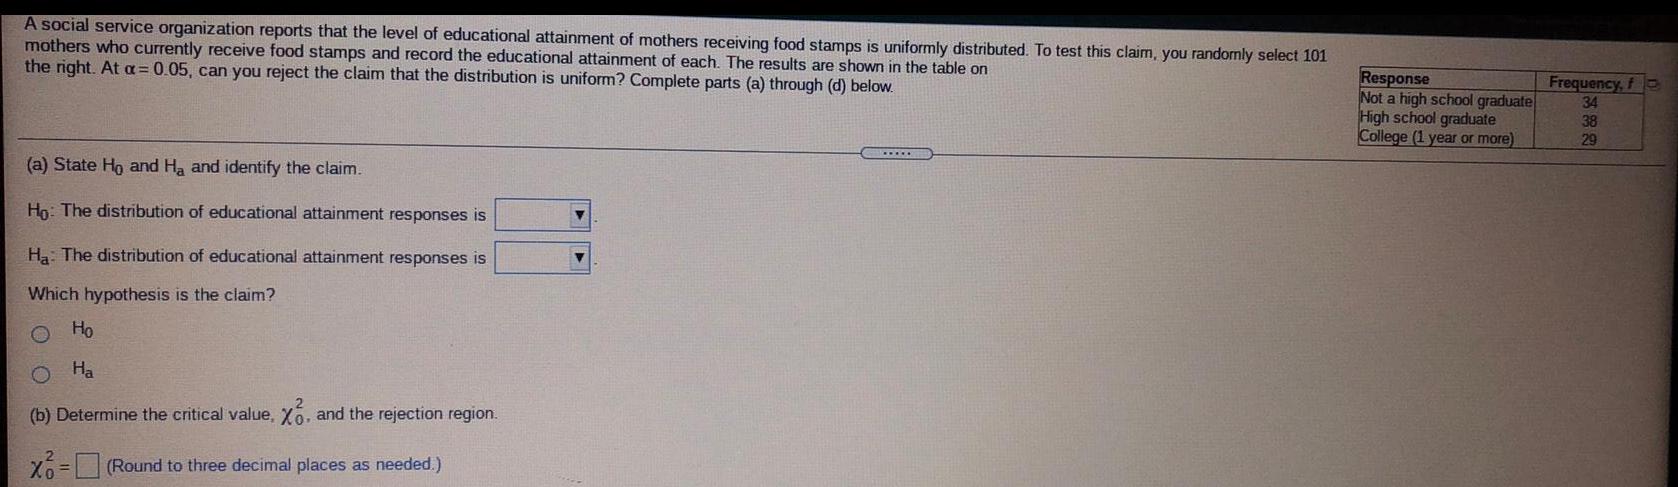
StatisticsA social service organization reports that the level of educational attainment of mothers receiving food stamps is uniformly distributed. To test this claim, you randomly select 101
mothers who currently receive food stamps and record the educational attainment of each. The results are shown in the table on
the right. At a= 0.05, can you reject the claim that the distribution is uniform? Complete parts (a) through (d) below.
(a) State Ho and Ha and identify the claim.
Ho: The distribution of educational attainment responses is
Ha: The distribution of educational attainment responses is
Which hypothesis is the claim?
O
Ho
Ha
(b) Determine the critical value. Xo, and the rejection region.
X = (Round to three decimal places as needed.)
V
.....
Response
Not a high school graduate
High school graduate
College (1 year or more)
Frequency, f
34
38
29

Math
StatisticsThe weights of ice cream cartons are normally distributed with a mean weight of 8 ounces and a standard deviation of 0.6 ounce.
(a) What is the probability that a randomly selected carton has a weight greater than 8.32 ounces?
(b) A sample of 16 cartons is randomly selected. What is the probability that their mean weight is greater than 8.32 ounces?
(a) The probability is
(Round to four decimal places as needed.)
(b) The probability is
(Round to four decimal places as needed.)

Math
StatisticsThe life spans of a species of fruit fly have a bell-shaped distribution, with a mean of 30 days and a standard deviation of 5 days.
(a) The life spans of three randomly selected fruit flies are 33 days, 28 days, and 43 days. Find the z-score that corresponds to each life span. Determine whether any of these life spans are unusual.
(b) The life spans of three randomly selected fruit flies are 25 days, 20 days, and 35 days. Using the Empirical Rule, find the percentile that corresponds to each life span.
(a) The z-score corresponding a life span of 33 days is.
(Type an integer or a decimal rounded to two decimal places as needed.)
The z-score corresponding a life span of 28 days is.
(Type an integer or a decimal rounded to two decimal places as needed.)
The z-score corresponding a life span of 43 days is.
(Type an integer or a decimal rounded to two decimal places as needed.)
Select all of the life spans that are unusual.
A. 33 days
B. 28 days
C. 43 days
D. None of the life spans are unusual.
******

Math
StatisticsWhat is a discrete probability distribution? What are the two conditions that determine a probability distribution?
What is a discrete probability distribution? Choose the correct answer below.
OA. A discrete probability distribution lists each possible value a random variable can assume.
B. A discrete probability distribution exclusively lists probabilities.
OC. A discrete probability distribution lists each possible value a random variable can assume, together with its probability.
OD. None of the above
What are the two conditions that determine a probability distribution? Choose the correct answer below.
OA.
B.
The probability of each value of the discrete random variable is greater than 0 and less than 1, and the sum of all the probabilities is 1.
The probability of each value of the discrete random variable is between 0 and 1, inclusive, and the sum of all the probabilities can be any amount.
The probability of each value of the discrete random variable is between 0 and 1, inclusive, and the sum of all the probabilities is 1.
O D. The probability of each value of the discrete random variable is greater than 0 and less than 1, and the sum of all the probabilities can be any amount.
▪▪▪▪▪
O O
OC.
Math
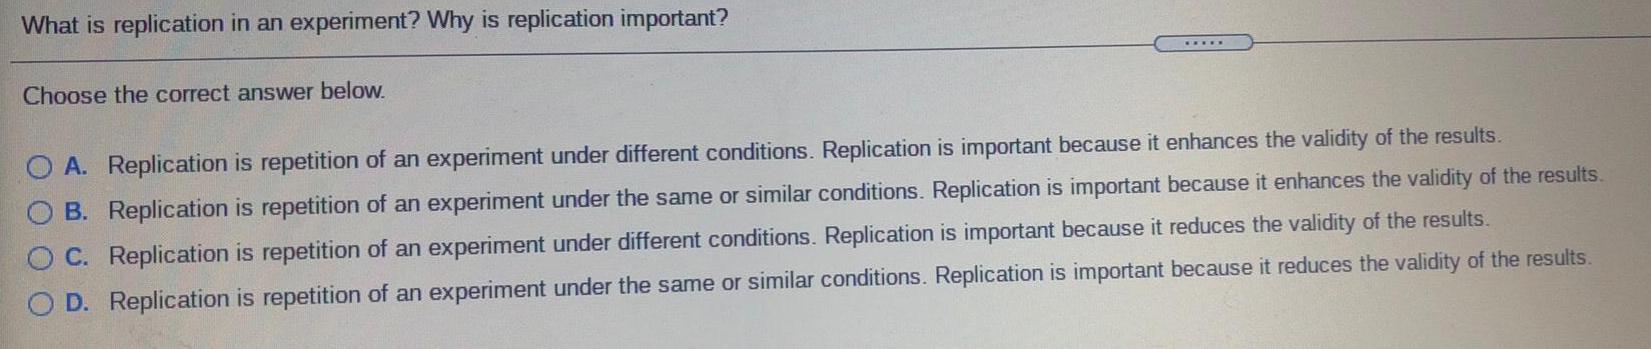
StatisticsWhat is replication in an experiment? Why is replication important?
Choose the correct answer below.
*****
O A. Replication is repetition of an experiment under different conditions. Replication is important because it enhances the validity of the results.
B. Replication is repetition of an experiment under the same or similar conditions. Replication is important because it enhances the validity of the results.
C. Replication is repetition of an experiment under different conditions. Replication is important because it reduces the validity of the results.
D. Replication is repetition of an experiment under the same or similar conditions. Replication is important because it reduces the validity of the results.