Statistics Questions and Answers
Math
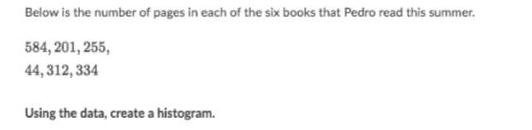
StatisticsBelow is the number of pages in each of the six books that Pedro read this summer.
584, 201, 255,
44,312,334
Using the data, create a histogram.
Math
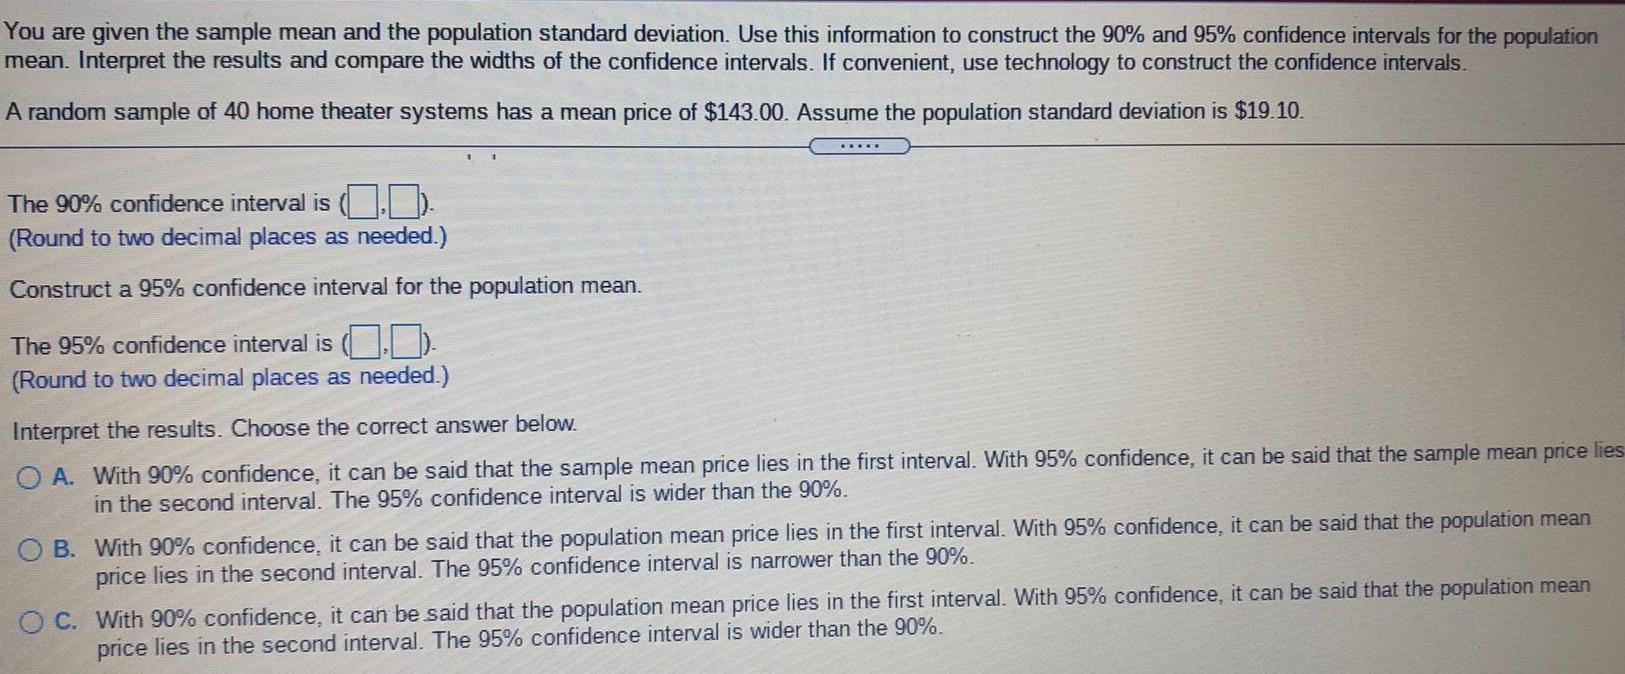
StatisticsYou are given the sample mean and the population standard deviation. Use this information to construct the 90% and 95% confidence intervals for the population
mean. Interpret the results and compare the widths of the confidence intervals. If convenient, use technology to construct the confidence intervals.
A random sample of 40 home theater systems has a mean price of $143.00. Assume the population standard deviation is $19.10.
The 90% confidence interval is (..
(Round to two decimal places as needed.)
Construct a 95% confidence interval for the population mean.
The 95% confidence interval is (..
(Round to two decimal places as needed.)
Interpret the results. Choose the correct answer below.
A. With 90% confidence, it can be said that the sample mean price lies in the first interval. With 95% confidence, it can be said that the sample mean price lies
in the second interval. The 95% confidence interval is wider than the 90%.
B. With 90% confidence, it can be said that the population mean price lies in the first interval. With 95% confidence, it can be said that the population mean
price lies in the second interval. The 95% confidence interval is narrower than the 90%.
C. With 90% confidence, it can be said that the population mean price lies in the first interval. With 95% confidence, it can be said that the population mean
price lies in the second interval. The 95% confidence interval is wider than the 90%.
Math
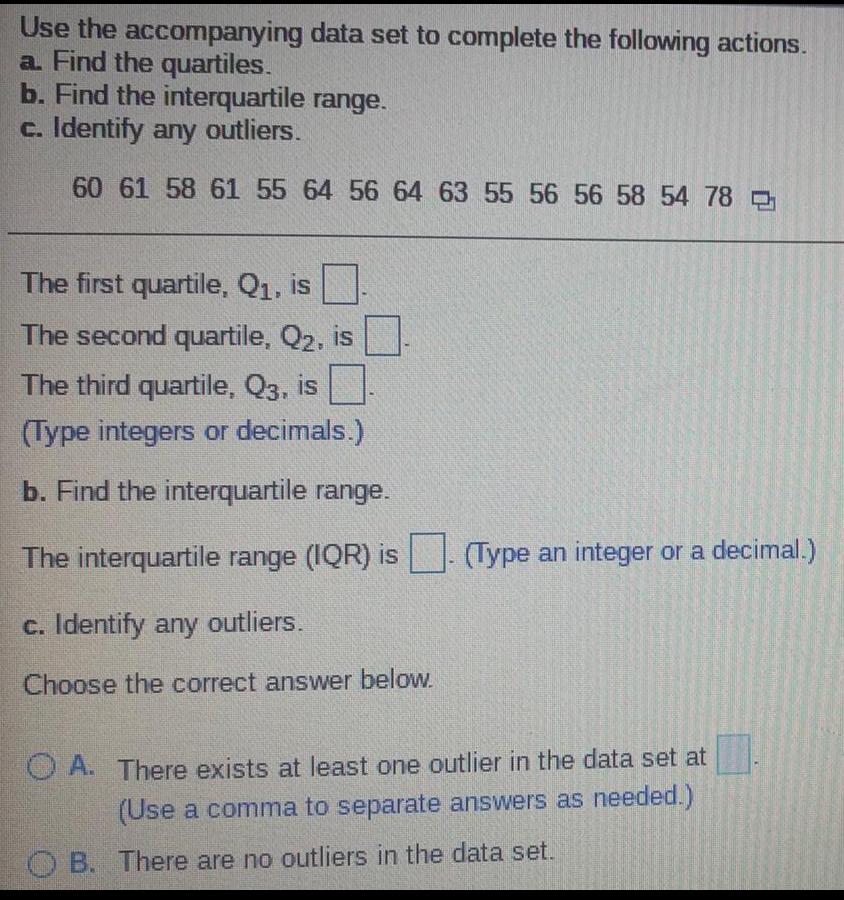
StatisticsUse the accompanying
a. Find the quartiles.
b. Find the interquartile range.
c. Identify any outliers.
60 61 58 61 55 64 56 64 63 55 56 56 58 54 78
data set to complete the following actions.
The first quartile, Q₁, is
The second quartile, Q₂, is
The third quartile, Q3, is
(Type integers or decimals.)
b. Find the interquartile range.
The interquartile range (IQR) is. (Type an integer or a decimal.)
c. Identify any outliers.
Choose the correct answer below.
OA. There exists at least one outlier in the data set at
(Use a comma to separate answers as needed.)
B. There are no outliers in the data set.
Math
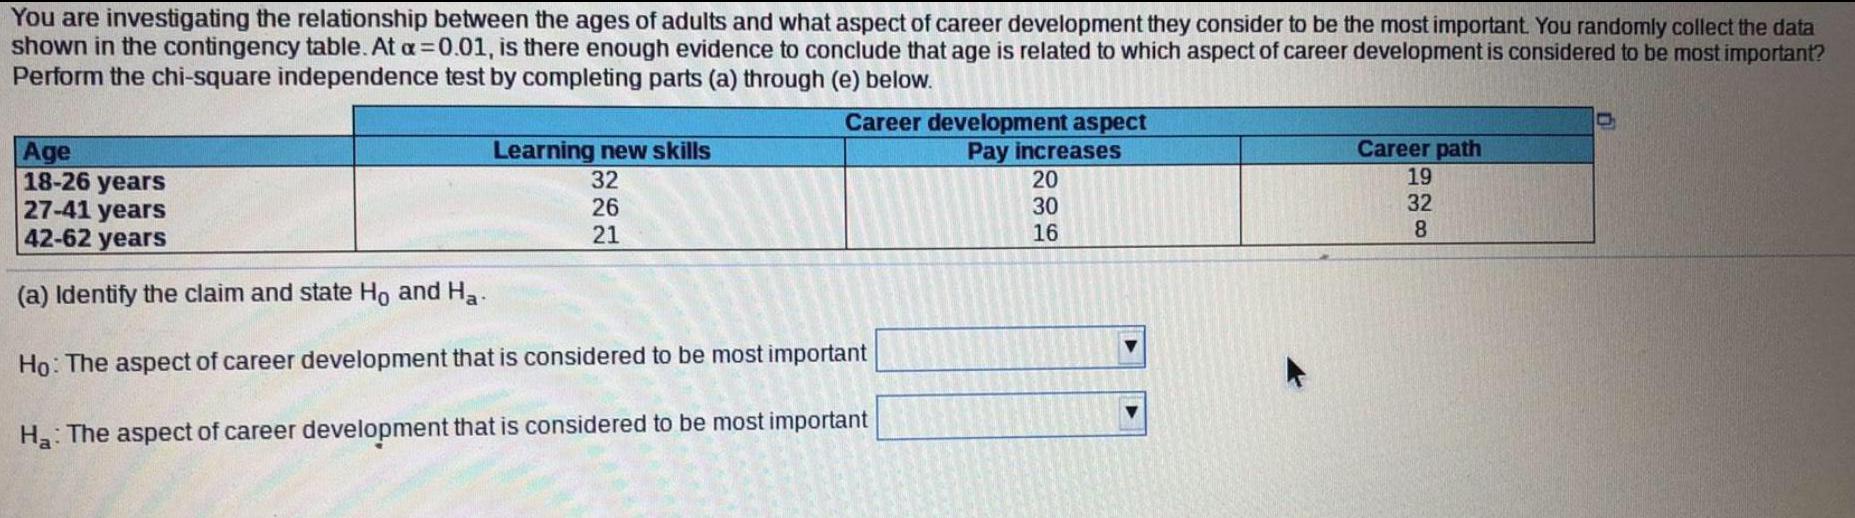
StatisticsYou are investigating the relationship between the ages of adults and what aspect of career development they consider to be the most important. You randomly collect the data
shown in the contingency table. At a = 0.01, is there enough evidence to conclude that age is related to which aspect of career development is considered to be most important?
Perform the chi-square independence test by completing parts (a) through (e) below.
Learning new skills
32
26
21
Career development aspect
Pay increases
20
30
16
Age
18-26 years
27-41 years
42-62 years
(a) Identify the claim and state Ho and Ha
Ho: The aspect of career development that is considered to be most important
Ha: The aspect of career development that is considered to be most important
Career path
19
32
8
Math
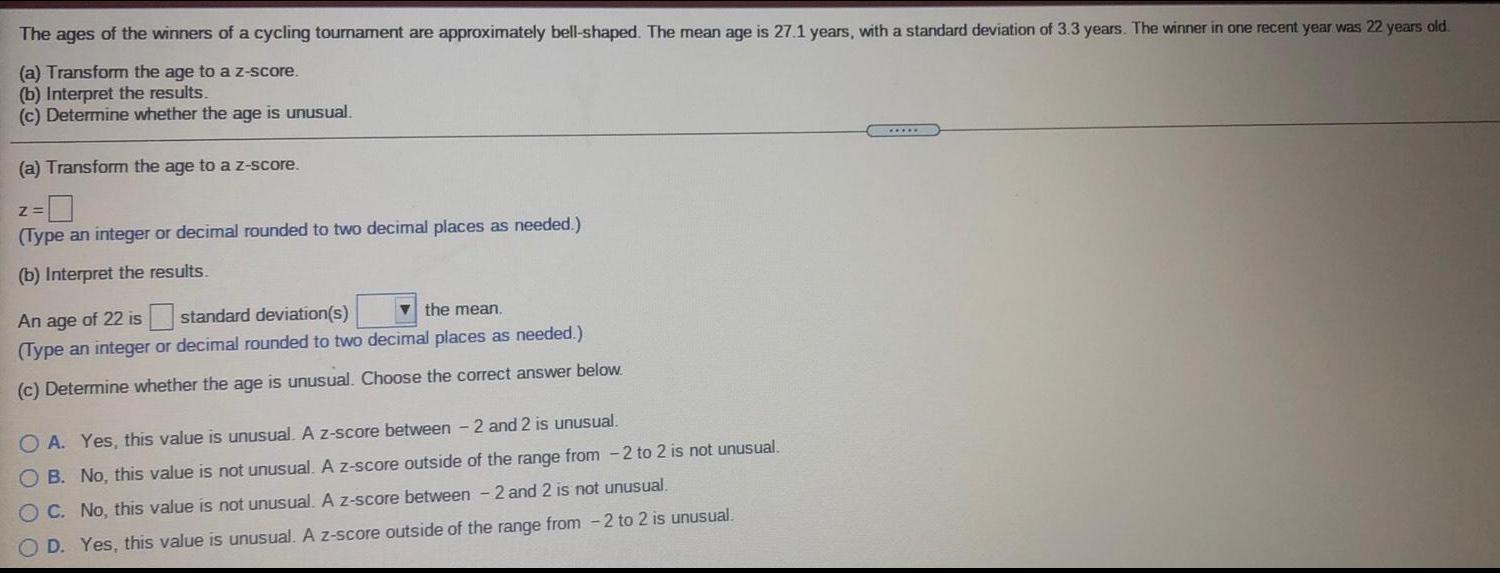
StatisticsThe ages of the winners of a cycling tournament are approximately bell-shaped. The mean age is 27.1 years, with a standard deviation of 3.3 years. The winner in one recent year was 22 years old.
(a) Transform the age to a z-score.
(b) Interpret the results.
(c) Determine whether the age is unusual.
(a) Transform the age to a z-score.
Z=
(Type an integer or decimal rounded to two decimal places as needed.)
(b) Interpret the results.
An age of 22 is
standard deviation(s)
the mean.
(Type an integer or decimal rounded to two decimal places as needed.)
(c) Determine whether the age is unusual. Choose the correct answer below.
OA. Yes, this value is unusual. A z-score between 2 and 2 is unusual.
OB. No, this value is not unusual. A z-score outside of the range from -2 to 2 is not unusual.
OC. No, this value is not unusual. A z-score between 2 and 2 is not unusual.
D. Yes, this value is unusual. A z-score outside of the range from -2 to 2 is unusual.
Math
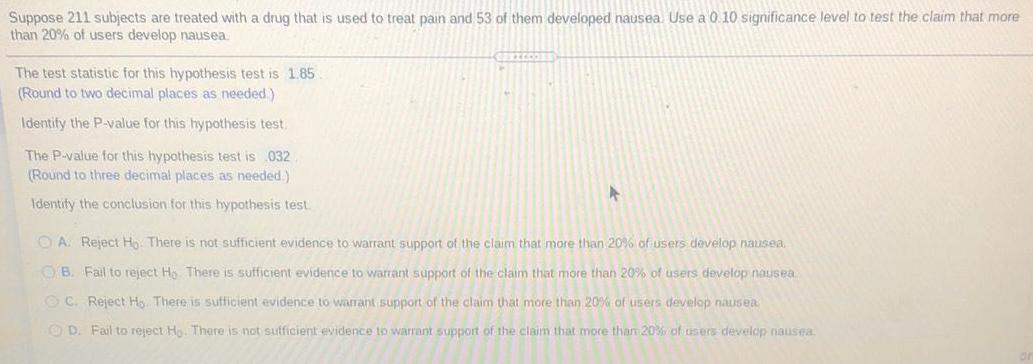
StatisticsSuppose 211 subjects are treated with a drug that is used to treat pain and 53 of them developed nausea. Use a 0.10 significance level to test the claim that more
than 20% of users develop nausea.
The test statistic for this hypothesis test is 1.85
(Round to two decimal places as needed)
Identify the P-value for this hypothesis test.
The P-value for this hypothesis test is .032
(Round to three decimal places as needed.)
Identify the conclusion for this hypothesis test.
A
A. Reject Ho. There is not sufficient evidence to warrant support of the claim that more than 20% of users develop nausea.
OB. Fail to reject Ho. There is sufficient evidence to warrant support of the claim that more than 20% of users develop nausea
OC. Reject H. There is sufficient evidence to warrant support of the claim that more than 20% of users develop nausea.
D. Fail to reject Ho. There is not sufficient evidence to warrant support of the claim that more than 20% of users develop nausea.
Math
StatisticsUse the Empirical Rule. The mean speed of a sample of vehicles along a stretch of highway is 69 miles per hour, with a standard deviation of 5 miles per hour. Estimate the percent of vehicles whose speeds are between 54 miles
per hour and 84 miles per hour. (Assume the data set has a bell-shaped distribution.)
Approximately % of vehicles travel between 54 miles per hour and 84 miles per hour.
*****
Math
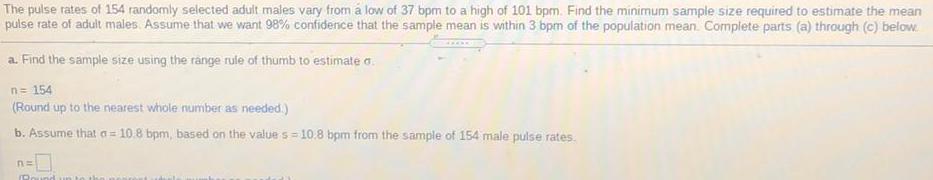
StatisticsThe pulse rates of 154 randomly selected adult males vary from a low of 37 bpm to a high of 101 bpm. Find the minimum sample size required to estimate the mean
pulse rate of adult males. Assume that we want 98% confidence that the sample mean is within 3 bpm of the population mean. Complete parts (a) through (c) below.
a. Find the sample size using the range rule of thumb to estimate o
n = 154
(Round up to the nearest whole number as needed.)
b. Assume that a= 10.8 bpm, based on the value s = 10.8 bpm from the sample of 154 male pulse rates.
n=
Round up to the
Math
StatisticsYou are the operations manager for an airline and you are considering a higher fare level for passengers in aisle seats. How many randomly selected air passengers
must you survey? Assume that you want to be 99% confident that the sample percentage is within 3.5 percentage points of the true population percentage. Complete
parts (a) and (b) below.
a. Assume that nothing is known about the percentage of passengers who prefer aisle seats.
n=
(Round up to the nearest integer.)
Math
StatisticsSuppose that an airline uses a seat width of 16.7 in. Assume men have hip breadths that are normally distributed with a mean of 14.1 in. and a standard deviation of
1.1 in. Complete parts (a) through (c) below.
(a) Find the probability that if an individual man is randomly selected, his hip breadth will be greater than 16.7 in.
The probability is
(Round to four decimal places as needed.)
Math
StatisticsAn engineer is going to redesign an ejection seat for an airplane. The seat was designed for pilots weighing between 140 lb and 201 lb. The new population of pilots
has normally distributed weights with a mean of 149 lb and a standard deviation of 29.6 lb.
Click here to view page 1 of the standard normal distribution.
Click here to view page 2 of the standard normal distribution.
XXX
a. If a pilot is randomly selected, find the probability that his weight is between 140 lb and 201 lb.
The probability is approximately 58. (Round to four decimal places as needed.)
b. If 36 different pilots are randomly selected, find the probability that their mean weight is between 140 lb and 201 lb.
The probability is approximately
(Round to four decimal places as needed.)
Math
StatisticsThe brand manager for a brand of toothpaste must plan a campaign designed to increase brand recognition. He wants to first determine the percentage of adults who
have heard of the brand. How many adults must he survey in order to be 80% confident that his estimate is within six percentage points of the true population
percentage? Complete parts (a) through (c) below.
a) Assume that nothing is known about the percentage of adults who have heard of the brand.
Round up to the nearest integer.)
Math
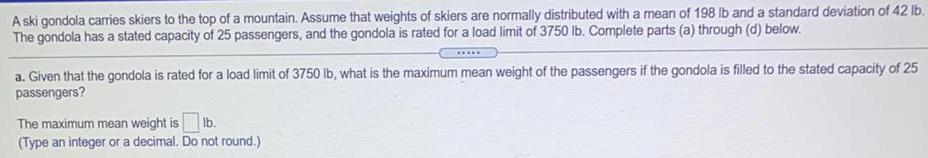
StatisticsA ski gondola carries skiers to the top of a mountain. Assume that weights of skiers are normally distributed with a mean of 198 lb and a standard deviation of 42 lb.
The gondola has a stated capacity of 25 passengers, and the gondola is rated for a load limit of 3750 lb. Complete parts (a) through (d) below.
a. Given that the gondola is rated for a load limit of 3750 lb, what is the maximum mean weight of the passengers if the gondola is filled to the stated capacity of 25
passengers?
The maximum mean weight is lb.
(Type an integer or a decimal. Do not round.)
Math
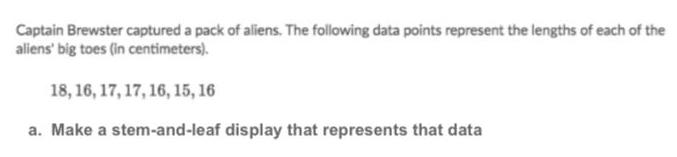
StatisticsCaptain Brewster captured a pack of aliens. The following data points represent the lengths of each of the
aliens' big toes (in centimeters).
18, 16, 17, 17, 16, 15, 16
a. Make a stem-and-leaf display that represents that data
Math
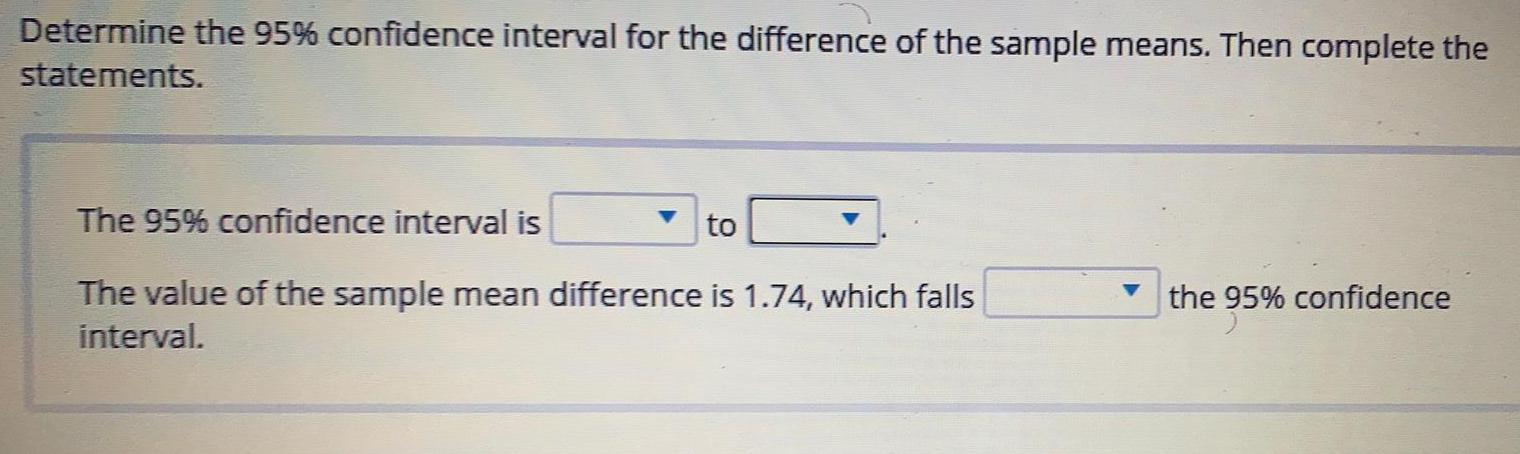
StatisticsDetermine the 95% confidence interval for the difference of the sample means. Then complete the
statements.
The 95% confidence interval is
The value of the sample mean difference is 1.74, which falls
interval.
Math
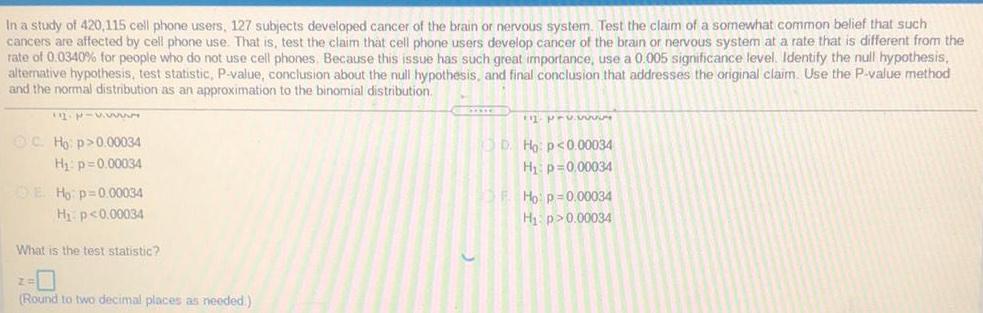
StatisticsIn a study of 420,115 cell phone users, 127 subjects developed cancer of the brain or nervous system. Test the claim of a somewhat common belief that such
cancers are affected by cell phone use. That is, test the claim that cell phone users develop cancer of the brain or nervous system at a rate that is different from the
rate of 0.0340% for people who do not use cell phones. Because this issue has such great importance, use a 0.005 significance level. Identify the null hypothesis,
alternative hypothesis, test statistic, P-value, conclusion about the null hypothesis, and final conclusion that addresses the original claim. Use the P-value method
and the normal distribution as an approximation to the binomial distribution.
Math
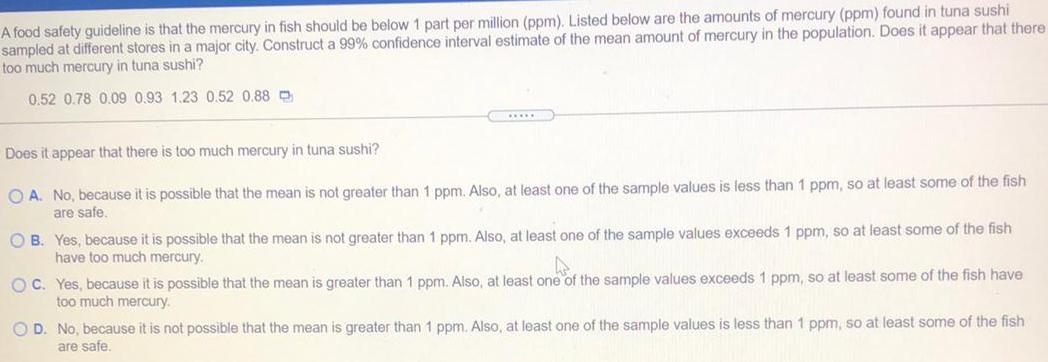
StatisticsA food safety guideline is that the mercury in fish should be below 1 part per million (ppm). Listed below are the amounts of mercury (ppm) found in tuna sushi sampled at different stores in a major city. Construct a 99% confidence interval estimate of the mean amount of mercury in the population. Does it appear that there too much mercury in tuna sushi?
0.52 0.78 0.09 0.93 1.23 0.52 0.88
Does it appear that there is too much mercury in tuna sushi?
A. No, because it is possible that the mean is not greater than 1 ppm. Also, at least one of the sample values is less than 1 ppm, so at least some of the fish
are safe.
B. Yes, because it is possible that the mean is not greater than 1 ppm. Also, at least one of the sample values exceeds 1 ppm, so at least some of the fish
have too much mercury.
C. Yes, because it is possible that the mean is greater than 1 ppm. Also, at least one of the sample values exceeds 1 ppm, so at least some of the fish have
too much mercury.
D. No, because it is not possible that the mean is greater than 1 ppm. Also, at least one of the sample values is less than 1 ppm, so at least some of the fish
are safe.
Math
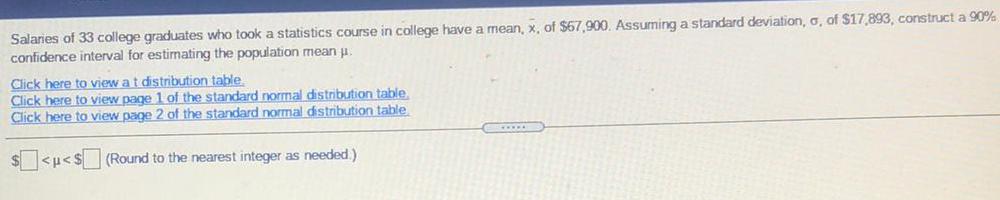
StatisticsSalaries of 33 college graduates who took a statistics course in college have a mean, x, of $67,900. Assuming a standard deviation, a, of $17,893, construct a 90% confidence interval for estimating the population mean .
Click here to view at distribution table
Click here to view page 1 of the standard normal distribution table
Click here to view page 2 of the standard normal distribution table
Math
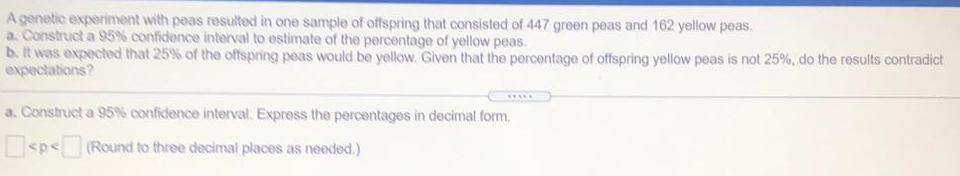
StatisticsA genetic experiment with peas resulted in one sample of offspring that consisted of 447 green peas and 162 yellow peas.
a. Construct a 95% confidence interval to estimate of the percentage of yellow peas.
b. It was expected that 25% of the offspring peas would be yellow. Given that the percentage of offspring yellow peas is not 25%, do the results contradict
expectations?
a. Construct a 95% confidence interval. Express the percentages in decimal form.
<p<(Round to three decimal places as needed.)
Math
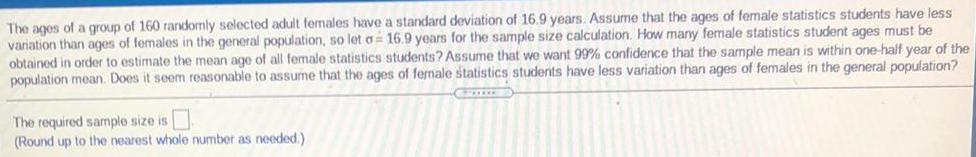
StatisticsThe ages of a group of 160 randomly selected adult females have a standard deviation of 16.9 years. Assume that the ages of female statistics students have less
variation than ages of females in the general population, so let a 16.9 years for the sample size calculation. How many female statistics student ages must be
obtained in order to estimate the mean age of all female statistics students? Assume that we want 99% confidence that the sample mean is within one-half year of the
population mean. Does it seem reasonable to assume that the ages of female statistics students have less variation than ages of females in the general population?
The required sample size is
(Round up to the nearest whole number as needed.)
Math
StatisticsIn a survey of 3194 adults aged 57 through 85 years, it was found that 88.3% of them used at least one prescription medication. Complete parts (a) through (c) below.
a. How many of the 3194 subjects used at least one prescription medication?
(Round to the nearest integer as needed.).
Math
StatisticsBefore every flight, the pilot must verify that the total weight of the load is less than the maximum allowable load for the aircraft. The aircraft can carry 38 passengers,
and a flight has fuel and baggage that allows for a total passenger load of 6,384 lb. The pilot sees that the plane is full and all passengers are men. The aircraft will be
168 lb. What is the probability that the aircraft is overloaded? Should the pilot take any
overloaded if the mean weight of the passengers is greater than 6,384 lb/38 = 168 lb.
action to correct for an overloaded aircraft? Assume that weights of men are normally distributed with a mean of 180.8 lb and a standard deviation of 35.7.
The probability is approximately.
(Round to four decimal places as needed.)
Math
StatisticsA survey found that women's heights are normally distributed with mean 63.6 in and standard deviation 2.2 in. A branch of the military requires women's heights to be between 58 in and 80 in.
a. Find the percentage of women meeting the height requirement. Are many women being denied the opportunity to join this branch of the military because they are
too short or too tall?
b. If this branch of the military changes the height requirements so that all women are eligible except the shortest 1% and the tallest 2%, what are the new height
requirements?
Click to view page 1 of the table. Click to view page 2 of the table.
a. The percentage of women who meet the height requirement is
(Round to two decimal places as needed.)
Math
StatisticsFind the P-value for a left-tailed hypothesis test with a test statistic of z = -1.57. Decide whether to reject Ho if the level of significance is a = 0.05.
P-value = (Round to four decimal places as needed.)
State your conclusion. Choose the correct answer below.
Since P> α, reject Ho-
Since P ≤a, fail to reject Ho.
Since P≤a, reject Ho.
Since P> a, fail to reject Ho.
Math
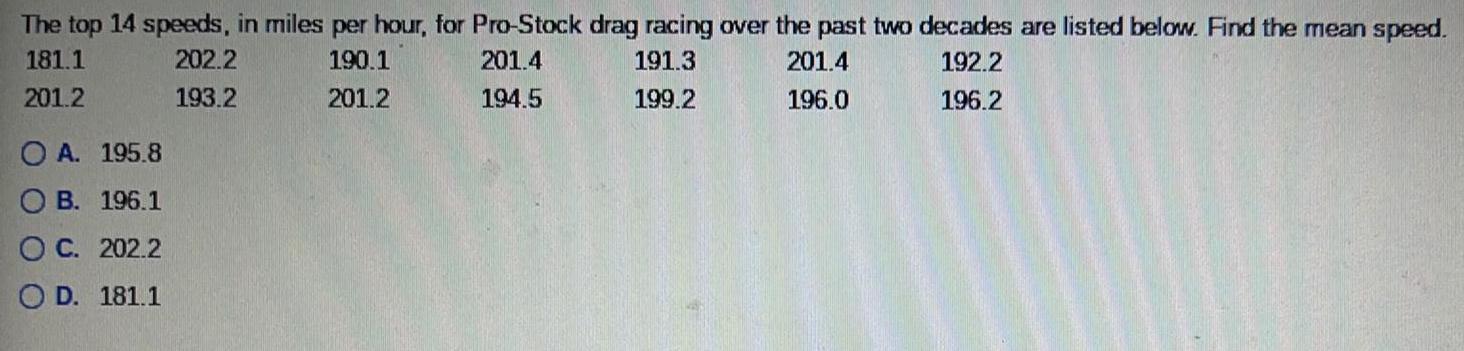
StatisticsThe top 14 speeds, in miles per hour, for Pro-Stock drag racing over the past two decades are listed below. Find the mean speed. 181.1 202.2 190.1 201.4 191.3 201.4 192.2 201.2 193.2 201.2 194.5 199.2 196.0 196.2
A. 195.8
B. 196.1
C. 202.2
D. 181.1
Math
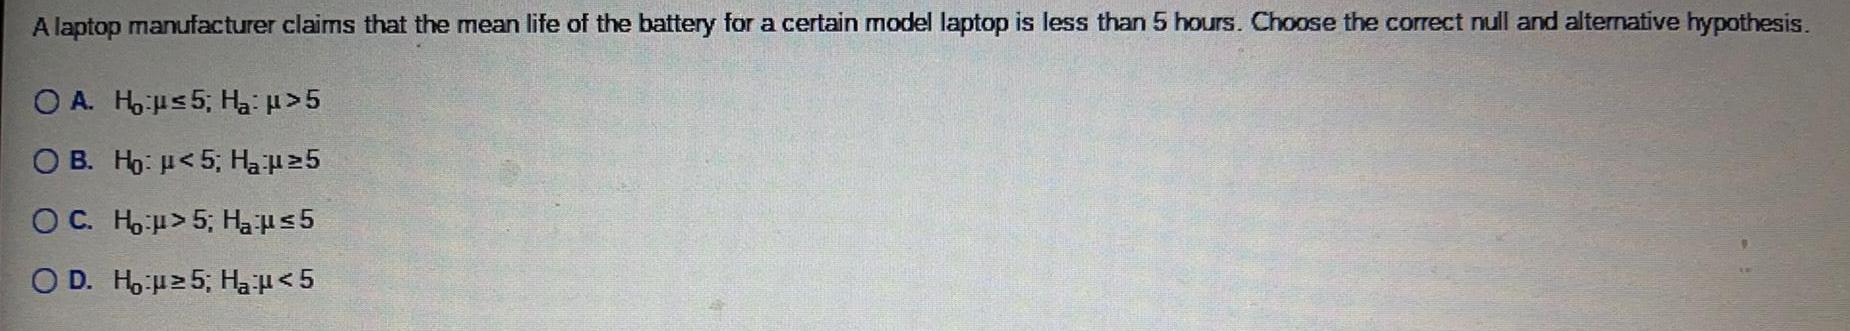
StatisticsA laptop manufacturer claims that the mean life of the battery for a certain model laptop is less than 5 hours. Choose the correct null and alternative hypothesis.
A. μ0: u ≤ 5; Ha: μ>5
B. μ0: μ< 5; Ha:µ ≥5
C. H0 : μ> 5; HA μ ≤ 5
D. H0-μ ≥ 5; Ha μ< 5
Math
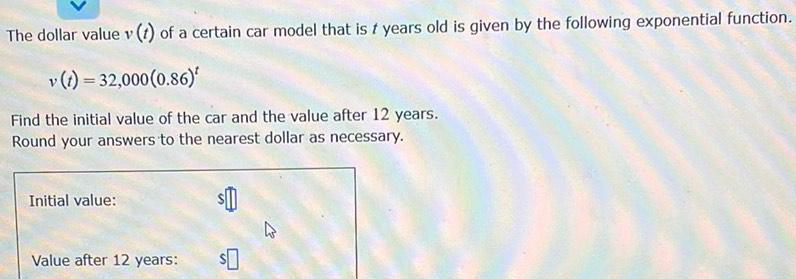
StatisticsThe dollar value v(t) of a certain car model that is f years old is given by the following exponential function.
v (t)=32,000 (0.86)'
Find the initial value of the car and the value after 12 years.
Round your answers to the nearest dollar as necessary.
Initial value:
Value after 12 years:
Math
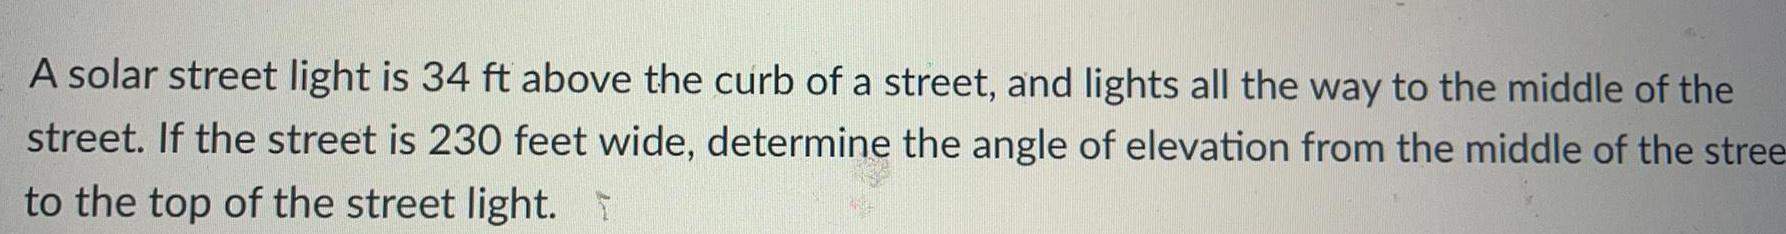
StatisticsA solar street light is 34 ft above the curb of a street, and lights all the way to the middle of the street. If the street is 230 feet wide, determine the angle of elevation from the middle of the street to the top of the street light.

Math
StatisticsGiven all information from question 4,5,6. If Sony has 220 cards leftover in inventory at the end of a review period, how much should it order from its supplier to have a 95% service level?
Math
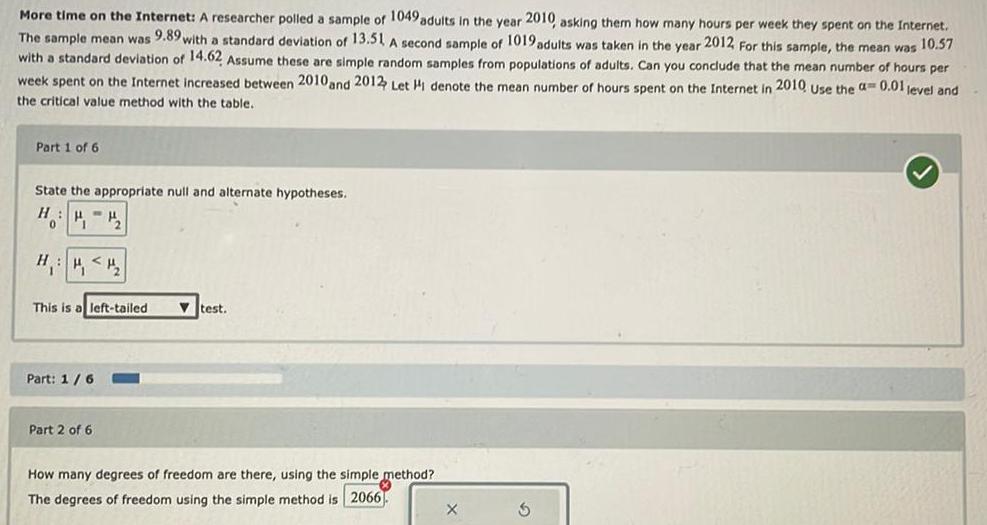
StatisticsMore time on the Internet: A researcher polled sample of 1049 adults in the year 2010, asking them how many hours per week they spent on the Internet.
The sample mean was 9.89 with a standard deviation of 13.51 A second sample of 1019 adults was taken in the year 2012 For this sample, the mean was 10.57
with a standard deviation of 14.62 Assume these are simple random samples from populations of adults. Can you conclude that the mean number of hours per
week spent on the Internet increased between 2010 and 2012 Let H1 denote the mean number of hours spent on the Internet in 2010 Use the a= 0.01 level and
the critical value method with the table.
Part 1 of 6
State the appropriate null and alternate hypotheses.
H
HH₂2₂
0
H
H₁ <H₂
This is a left-tailed
Part: 1/6
Part 2 of 6
test.
How many degrees of freedom are there, using the simple method?
The degrees of freedom using the simple method is 2066
X
Math
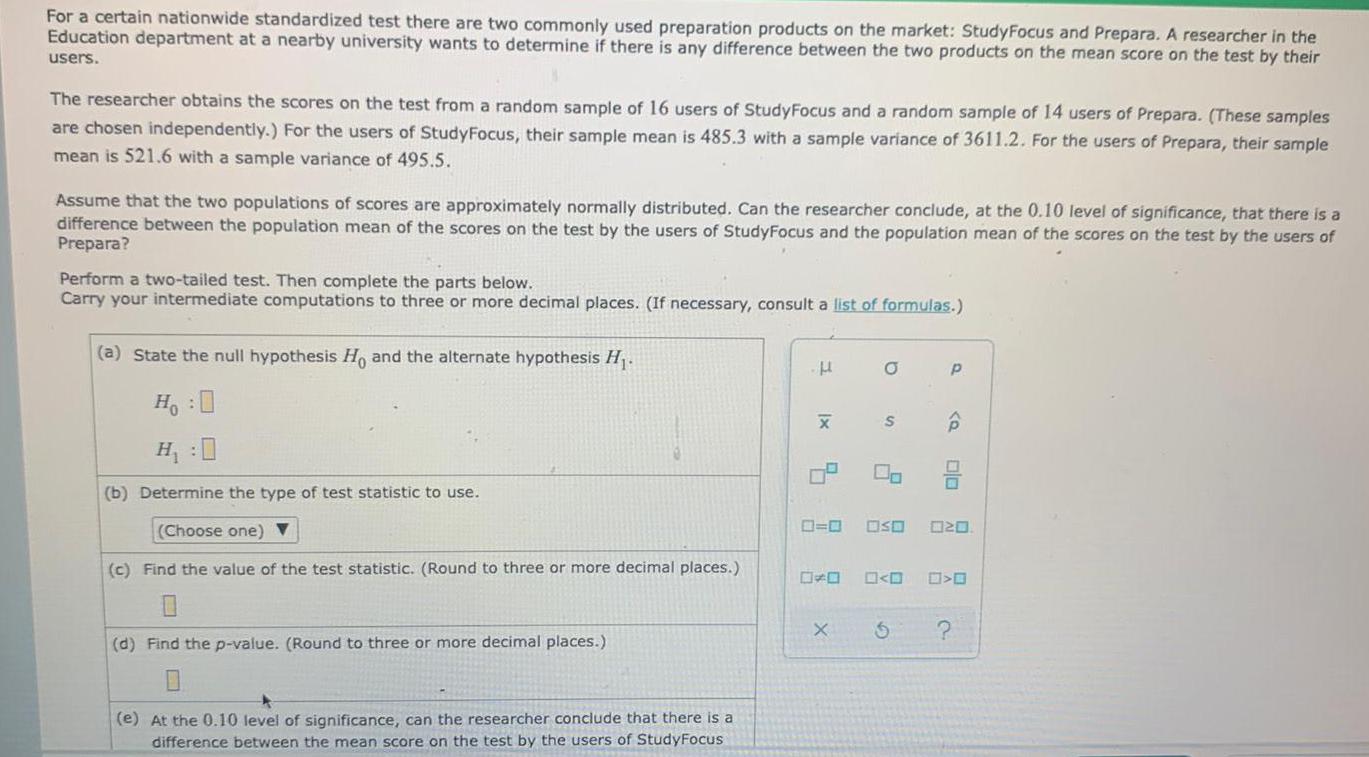
StatisticsFor a certain nationwide standardized test there are two commonly used preparation products on the market: StudyFocus and Prepara. A researcher in the
Education department at a nearby university wants to determine if there is any difference between the two products on the mean score on the test by their
users.
The researcher obtains the scores on the test from a random sample of 16 users of StudyFocus and a random sample of 14 users of Prepara. (These samples
are chosen independently.) For the users of StudyFocus, their sample mean is 485.3 with a sample variance of 3611.2. For the users of Prepara, their sample
mean is 521.6 with a sample variance of 495.5.
Assume that the two populations of scores are approximately normally distributed. Can the researcher conclude, at the 0.10 level of significance, that there is a
difference between the population mean of the scores on the test by the users of StudyFocus and the population mean of the scores on the test by the users of
Prepara?
Perform a two-tailed test. Then complete the parts below.
Carry your intermediate computations to three or more decimal places. (If necessary, consult a list of formulas.)
(a) State the null hypothesis Ho and the alternate hypothesis H₁.
H:0
H:0
(b) Determine the type of test statistic to use.
(Choose one) ▼
(c) Find the value of the test statistic. (Round to three or more decimal places.)
(d) Find the p-value. (Round to three or more decimal places.)
(e) At the 0.10 level of significance, can the researcher conclude that there is a
difference between the mean score on the test by the users of StudyFocus
H
|x
X
5
=O
X
O
S
2
0<0
P
6
ê
OSO 020
Ola
>O
?
Math
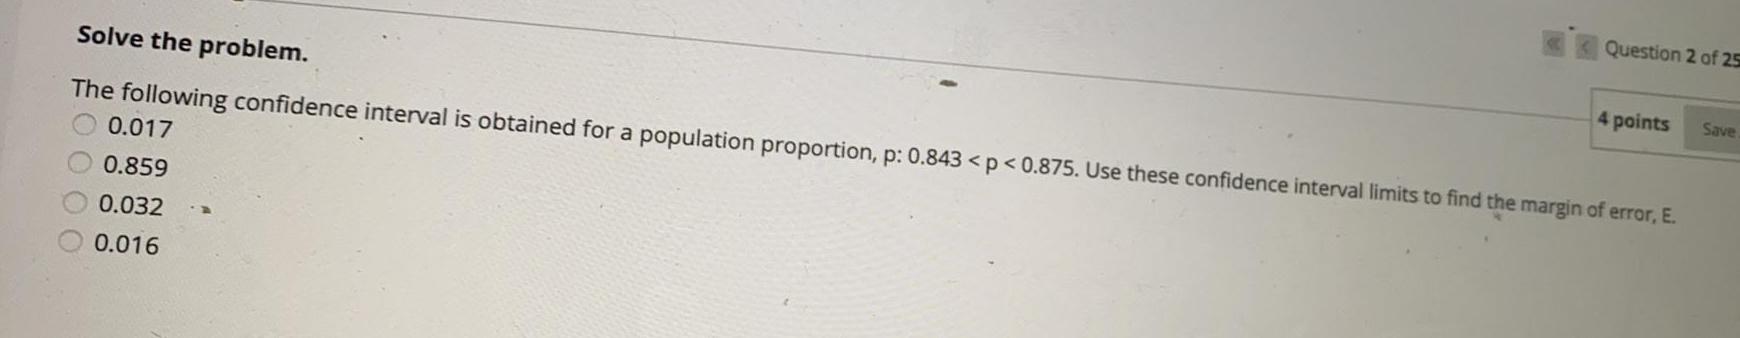
StatisticsThe following confidence interval is obtained for a population proportion, p: 0.843 < p < 0.875. Use these confidence interval limits to find the margin of error, E.
0.017
0.859
0.032
0.016
Math
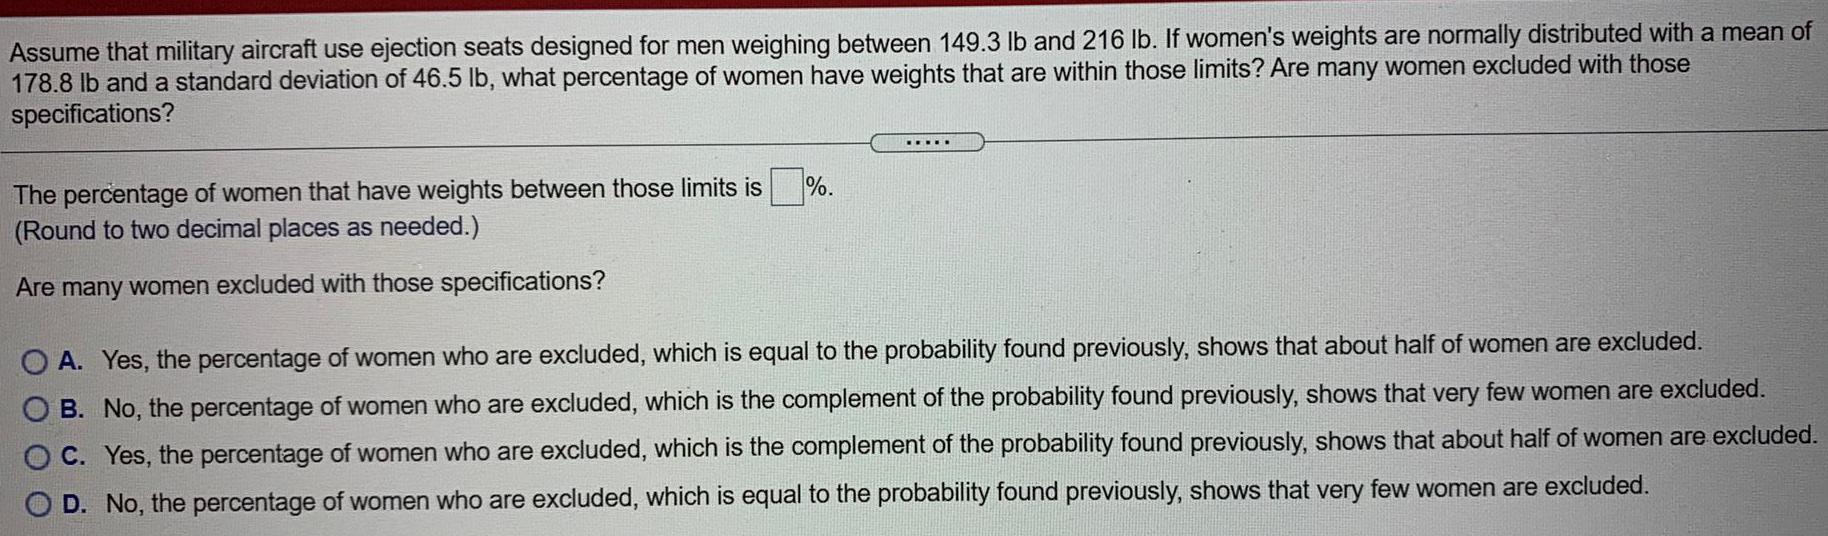
StatisticsAssume that military aircraft use ejection seats designed for men weighing between 149.3 lb and 216 lb. If women's weights are normally distributed with a mean of
178.8 lb and a standard deviation of 46.5 lb, what percentage of women have weights that are within those limits? Are many women excluded with those
specifications?
The percentage of women that have weights between those limits is
(Round to two decimal places as needed.)
Are many women excluded with those specifications?
%.
OA. Yes, the percentage of women who are excluded, which is equal to the probability found previously, shows that about half of women are excluded.
OB. No, the percentage of women who are excluded, which is the complement of the probability found previously, shows that very few women are excluded.
OC. Yes, the percentage of women who are excluded, which is the complement of the probability found previously, shows that about half of women are excluded.
OD. No, the percentage of women who are excluded, which is equal to the probability found previously, shows that very few women are excluded.
Math
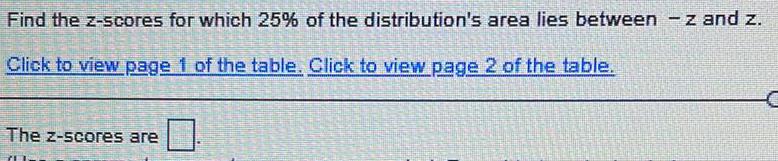
StatisticsFind the z-scores for which 25% of the distribution's area lies between - z and z.
Click to view page 1 of the table. Click to view page 2 of the table.
The z-scores are
Math
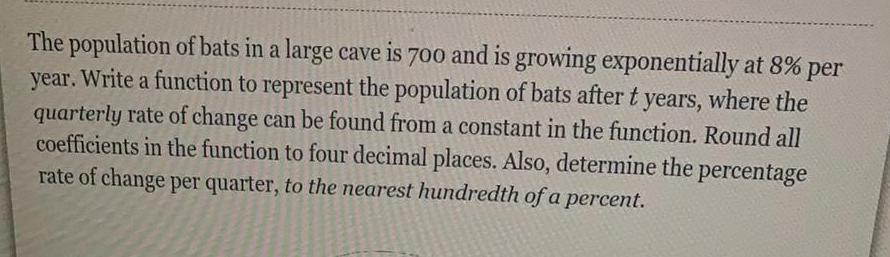
StatisticsThe population of bats in a large cave is 700 and is growing exponentially at 8% per
year. Write a function to represent the population of bats after t years, where the
quarterly rate of change can be found from a constant in the function. Round all
coefficients in the function to four decimal places. Also, determine the percentage
rate of change per quarter, to the nearest hundredth of a percent.
Math
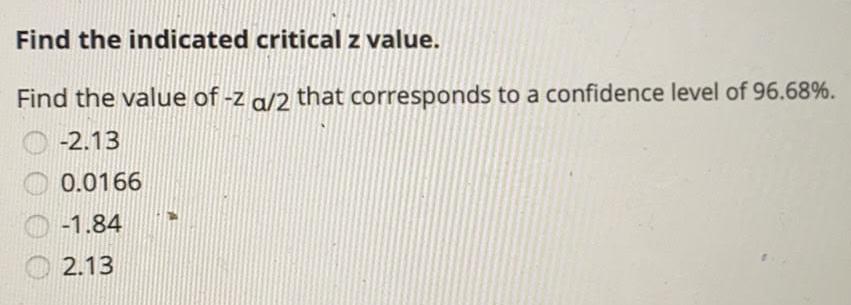
StatisticsFind the indicated critical z value.
Find the value of -z α/2 that corresponds to a confidence level of 96.68%.
-2.13
0.0166
-1.84
2.13
Math
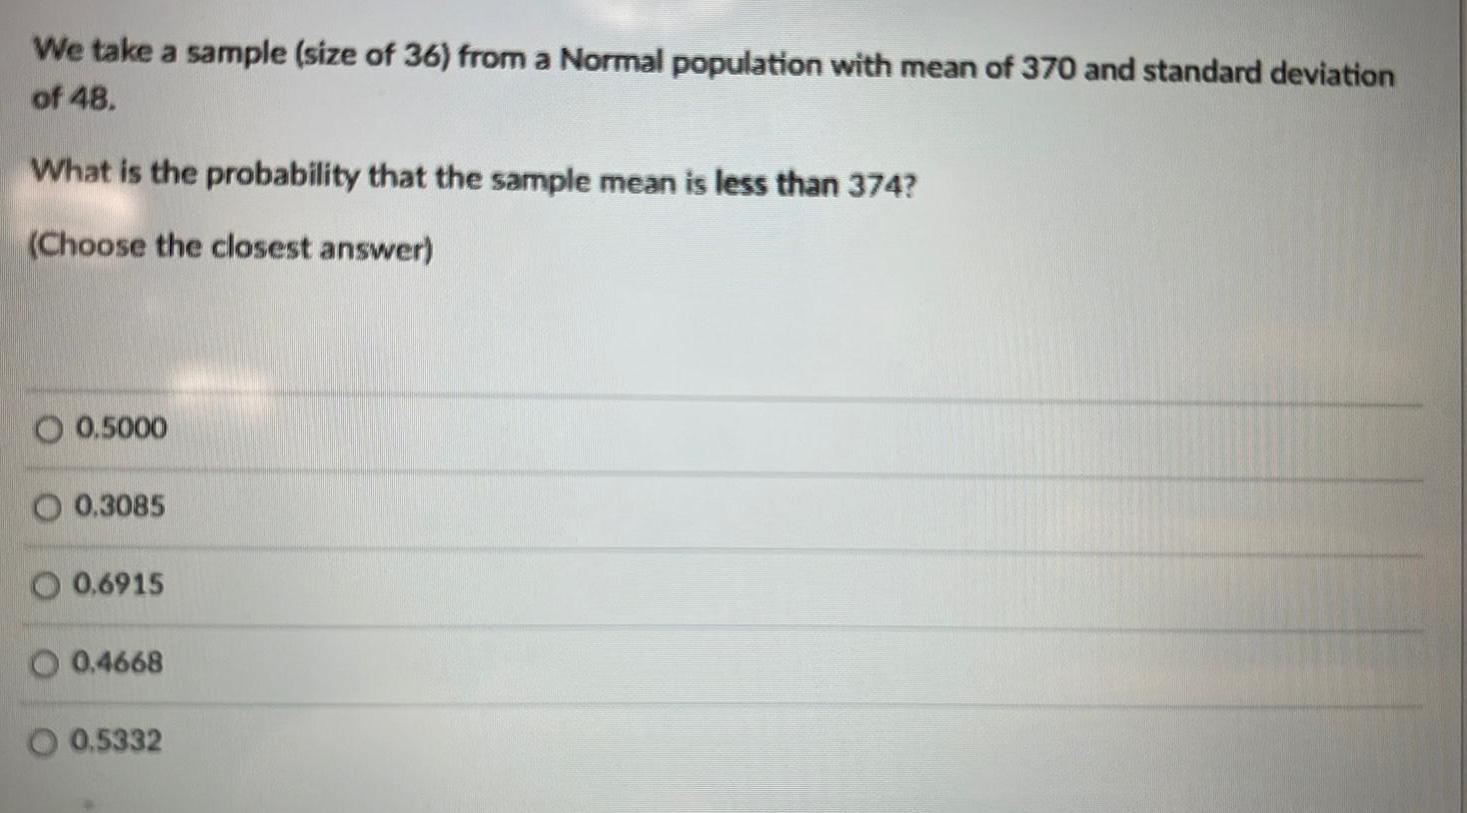
StatisticsWe take a sample (size of 36) from a Normal population with mean of 370 and standard deviation of 48. What is the probability that the sample mean is less than 374?
(Choose the closest answer)
0.5000
0.3085
0.6915
0.4668
0.5332
Math
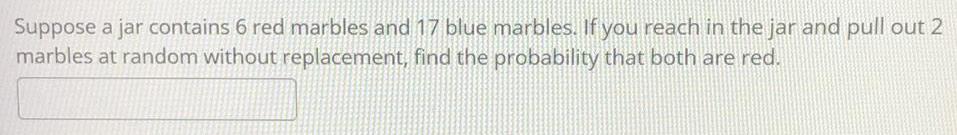
StatisticsSuppose a jar contains 6 red marbles and 17 blue marbles. If you reach in the jar and pull out 2
marbles at random without replacement, find the probability that both are red.
Math
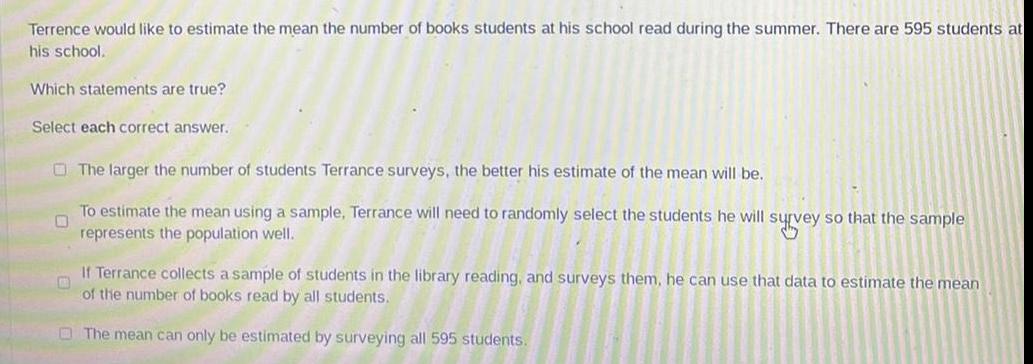
StatisticsTerrence would like to estimate the mean the number of books students at his school read during the summer. There are 595 students at
his school.
Which statements are true?
Select each correct answer.
The larger the number of students Terrance surveys, the better his estimate of the mean will be.
To estimate the mean using a sample, Terrance will need to randomly select the students he will survey so that the sample
represents the population well.
If Terrance collects a sample of students in the library reading, and surveys them, he can use that data to estimate the mean
of the number of books read by all students.
The mean can only be estimated by surveying all 595 students.
Math
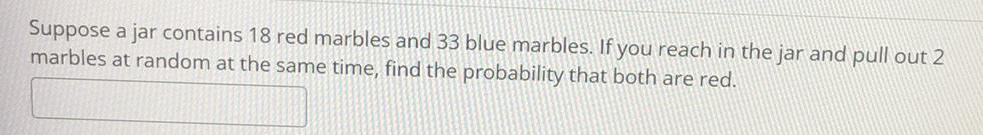
StatisticsSuppose a jar contains 18 red marbles and 33 blue marbles. If you reach in the jar and pull out 2 marbles at random at the same time, find the probability that both are red.
Math
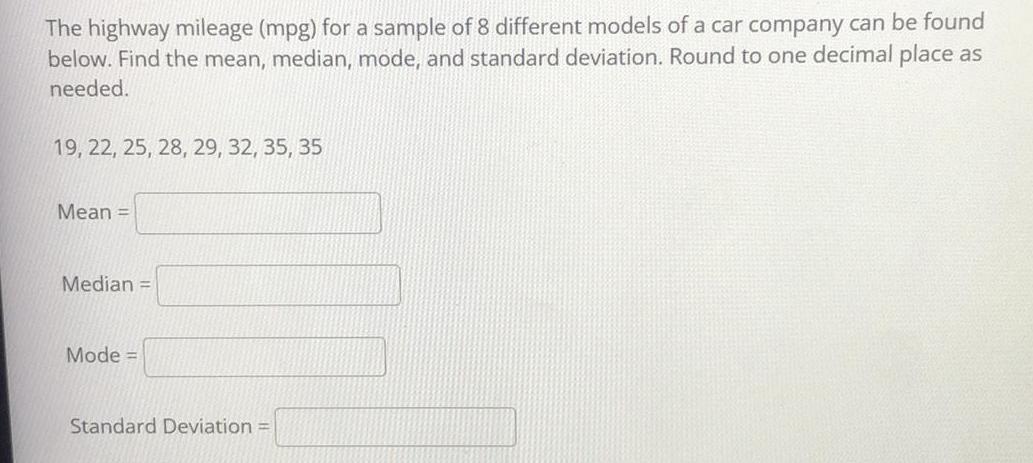
StatisticsThe highway mileage (mpg) for a sample 8 different models of a car company can be found below. Find the mean, median, mode, and standard deviation. Round to one decimal place as needed.
19, 22, 25, 28, 29, 32, 35, 35
Mean =
Median =
Mode =
Standard Deviation =
Math
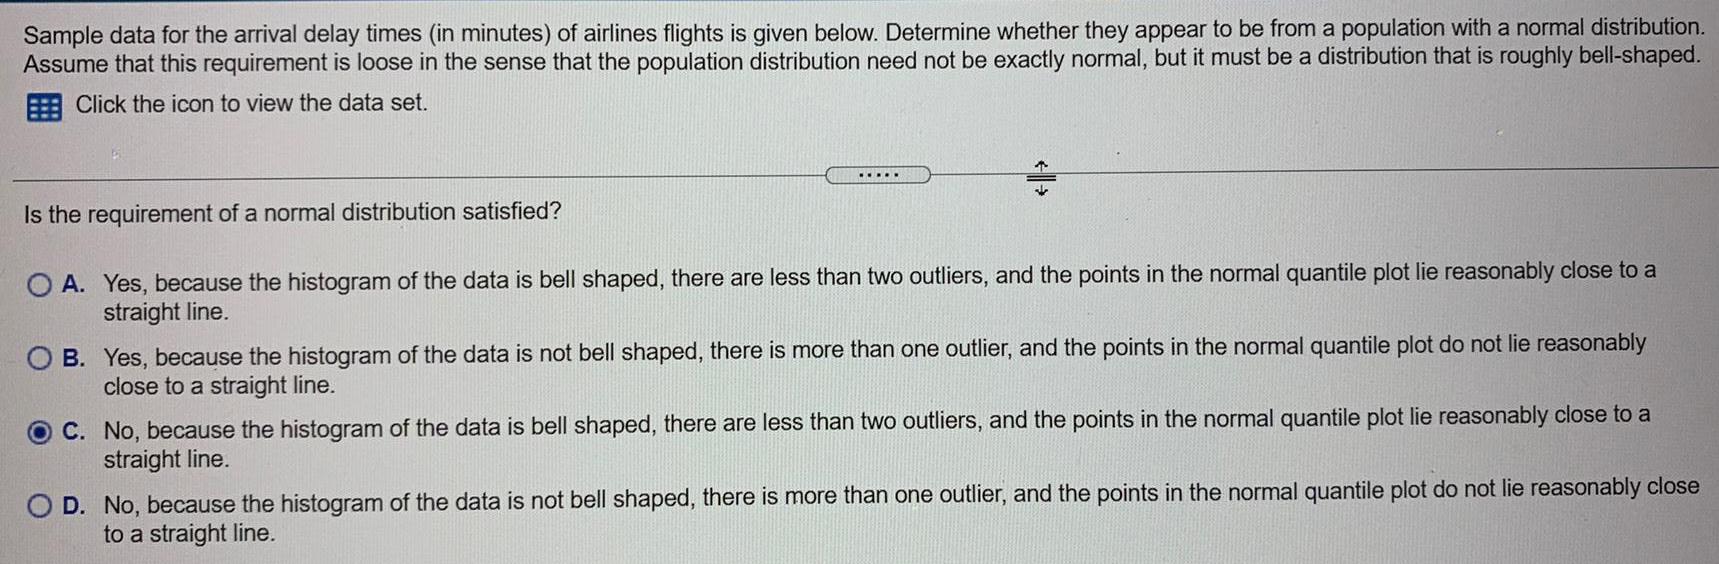
StatisticsSample data for the arrival delay times (in minutes) of airlines flights is given below. Determine whether they appear to be from a population with a normal distribution.
Assume that this requirement is loose in the sense that the population distribution need not be exactly normal, but it must be a distribution that is roughly bell-shaped.
Is the requirement of a normal distribution satisfied?
A. Yes, because the histogram of the data is bell shaped, there are less than two outliers, and the points in the normal quantile plot lie reasonably close to a
straight line.
B. Yes, because the histogram of the data is not bell shaped, there is more than one outlier, and the points in the normal quantile plot do not lie reasonably
close to a straight line.
C. No, because the histogram of the data is bell shaped, there are less than two outliers, and the points in the normal quantile plot lie reasonably close to a
straight line.
D.No, because the histogram of the data is not bell shaped, there is more than one outlier, and the points in the normal quantile plot do not lie reasonably close
to a straight line.
Math
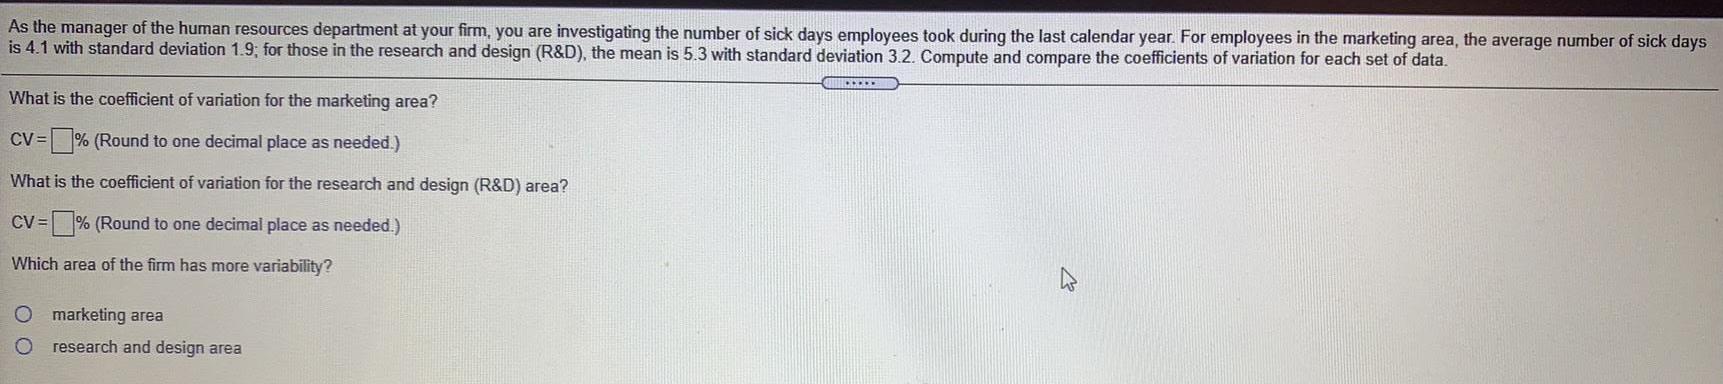
StatisticsAs the manager of the human resources department at your firm, you are investigating the number of sick days employees took during the last calendar year. For employees in the marketing area, the average number of sick days
is 4.1 with standard deviation 1.9; for those in the research and design (R&D), the mean is 5.3 with standard deviation 3.2. Compute and compare the coefficients of variation for each set of data.
What is the coefficient of variation for the marketing area?
CV=% (Round to one decimal place as needed.)
What is the coefficient of variation for the research and design (R&D) area?
CV=
=% (Round to one decimal place as needed.)
Which area of the firm has more variability?
O marketing area
O research and design area
Math
StatisticsIf the correlation coefficient for a given scatterplot is r = -0.81, which of the following must be true about the relationship between the explanatory and response variable?
The association is weakened by outliers.
The association must be positive.
The association has a linear form.
The association must be negative.
Math
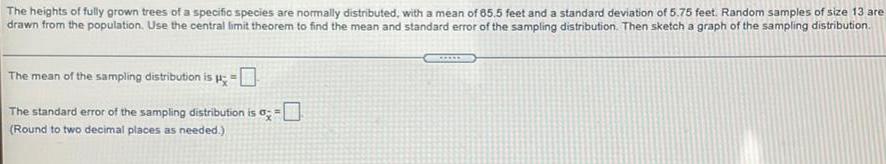
StatisticsThe heights of fully grown trees of a specific species are normally distributed, with a mean of 85.5 feet and a standard deviation of 5.75 feet. Random samples of size 13 are drawn from the population. Use the central limit theorem to find the mean and standard error of the sampling distribution. Then sketch a graph of the sampling distribution.
The mean of the sampling distribution is ;-
The standard error of the sampling distribution is =
(Round to two decimal places as needed.)
Math
StatisticsClarissa Byrne purchased a $399.99 electronic organizer, $78.94 in office supplies, and a $98.95 office chair for work. What is the (a) total selling price and (b) total sales tax if Clarissa lives in New Orleans, Louisiana, where the state tax is 4% and the city tax is 4%?
Math
StatisticsThe mean height of women in a country (ages 20-29) is 63.8 inches. A random sample of 65 women in this age group is selected. What is the probability that the mean height for the sample is greater than 64 inches? Assume σ = 2.55.
Math
StatisticsEach student's score on the final exam in Mr. Shenton's class
58, 72, 74, 92, 84, 40, 74, 81, 76, 83
2) What was the minimum score earned on
Mr. Shenton's final exam?
(a) 92
(b) 40
(c) 30
(d) 72
Math
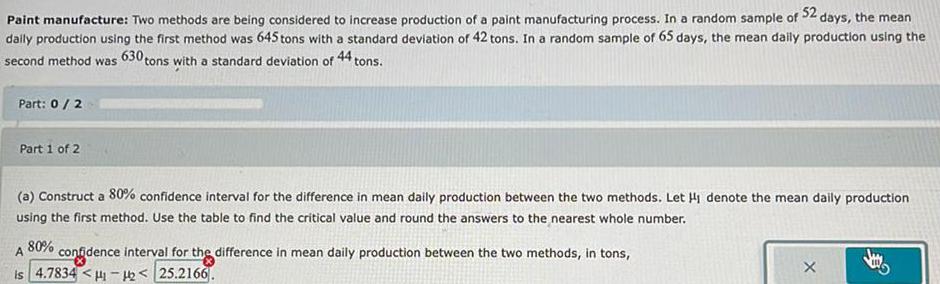
StatisticsTwo methods are being considered to increase production of a paint manufacturing process. In a random sample of 52 days, the mean daily production using the first method was 645 tons with a standard deviation of 42 tons. In a random sample of 65 days, the mean daily production using the second method was 630 tons with a standard deviation of 44 tons.
(a) Construct a 80% confidence interval for the difference in mean daily production between the two methods. Let H₁ denote the mean daily production
using the first method. Use the table to find the critical value and round the answers to the nearest whole number.
A 80% confidence interval for the difference in mean daily production between the two methods, in tons, is
Math
StatisticsA commonly cited standard for one-way length (duration) of school bus rides for elementary school
children is 30 minutes. A local government office in a rural area randomly samples 100 elementary
school children in their district and find an average one-way commute time of 38 minutes with a
standard deviation of 8 minutes.
Which of the following is the correct set of hypotheses for testing if the average commute time of
elementary school students in this district is different than the commonly cited standard of 30
minutes?
HA: μ=30; Ho: x ≠ 30
Ho: x= 38; HA: μ=30
Ho: μ=30; HA: μ> 30
Ho: μ=30; HA: μ ≠ 30
Ho: μ = 30; HA: x = 38