Statistics Questions and Answers
Math
StatisticsLet p be the probability measure on S3 given by p(ɛ) = 1/6, p((12)) = 1/6, p((13)) = 2/9, p((23)) = 1/9, p((123)) = 2/9, p((132)) = 1/9.
Show that p * p = u where u is the uniform probability measure on S3.
Math
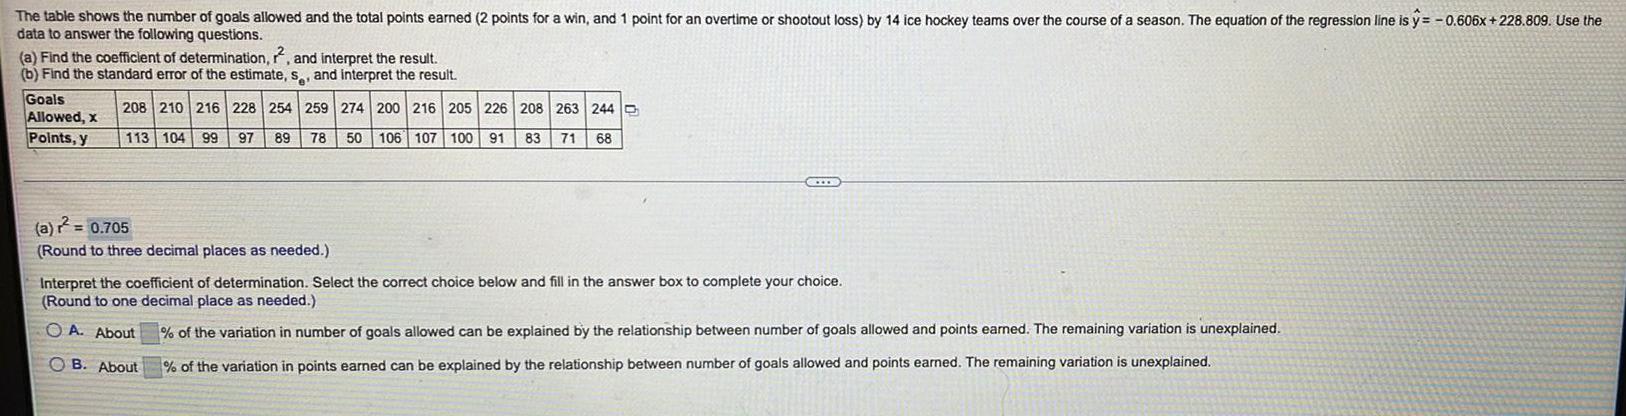
StatisticsThe table shows the number of goals allowed and the total points earned (2 points for a win, and 1 point for an overtime or shootout loss) by 14 ice hockey teams over the course of a season. The equation of the regression line is y=-0.606x +228.809. Use the
data to answer the following questions.
(a) Find the coefficient of determination, 2, and interpret the result.
(b) Find the standard error of the estimate, s, and interpret the result.
Goals Allowed, x 208 210 216 228 254 259 274 200 216 205 226 208 263 244
Points, y 113 104 99 97 89 78 50 106 107 100 91 83 71 68
(a) r² =
(Round to three decimal places as needed.)
Interpret the coefficient of determination. Select the correct choice below and fill in the answer box to complete your choice.
(Round to one decimal place as needed.)
A. About % of the variation in number of goals allowed can be explained by the relationship between number of goals allowed and points earned. The remaining variation is unexplained.
B. About % of the variation in points earned can be explained by the relationship between number of goals allowed and points earned. The remaining variation is unexplained.
Math
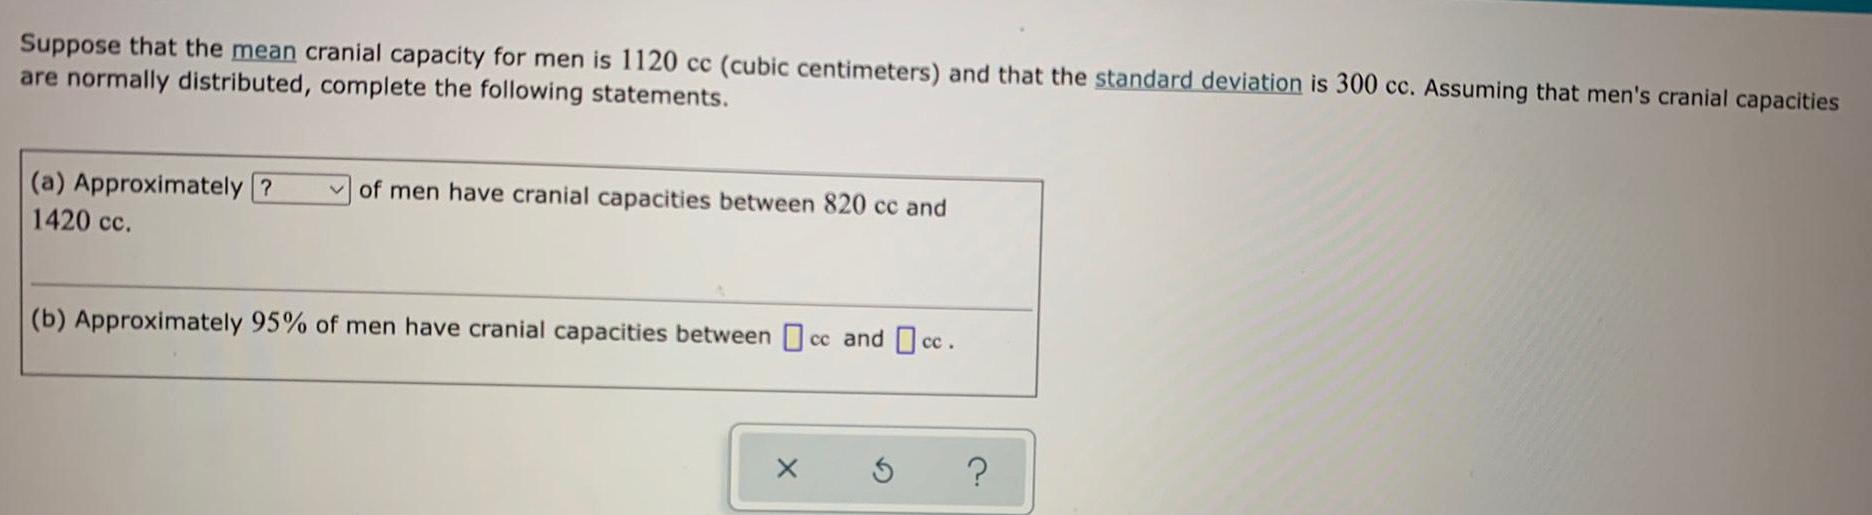
StatisticsSuppose that the mean cranial capacity for men is 1120 cc (cubic centimeters) and that the standard deviation is 300 cc. Assuming that men's cranial capacities are normally distributed, complete the following statements.
(a) Approximately of men have cranial capacities between 820 cc and 1420 cc.
(b) Approximately 95% of men have cranial capacities between cc and cc.
Math
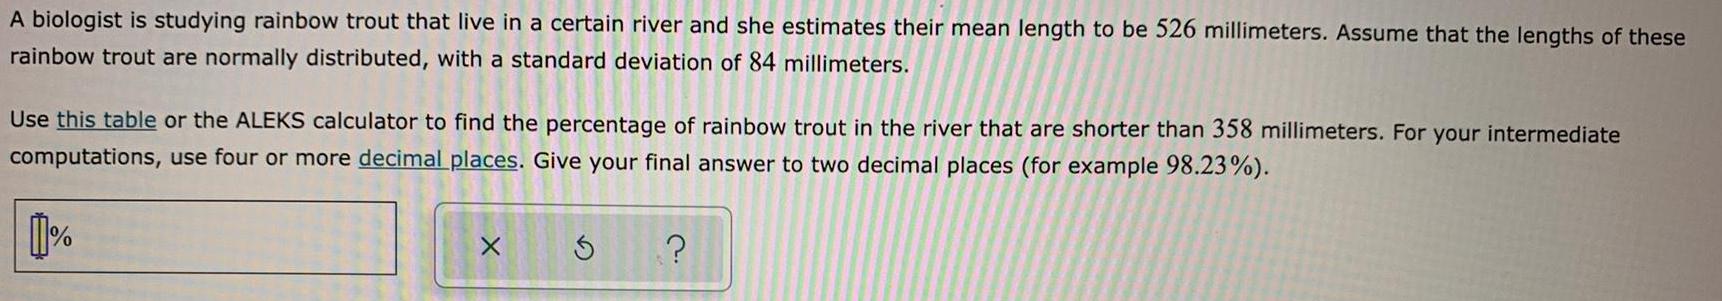
StatisticsA biologist is studying rainbow trout that live in a certain river and she estimates their mean length to be 526 millimeters. Assume that the lengths of these rainbow trout are normally distributed, with a standard deviation of 84 millimeters.
Use this table or the ALEKS calculator to find the percentage of rainbow trout in the river that are shorter than 358 millimeters. For your intermediate computations, use four or more decimal places. Give your final answer to two decimal places
Math
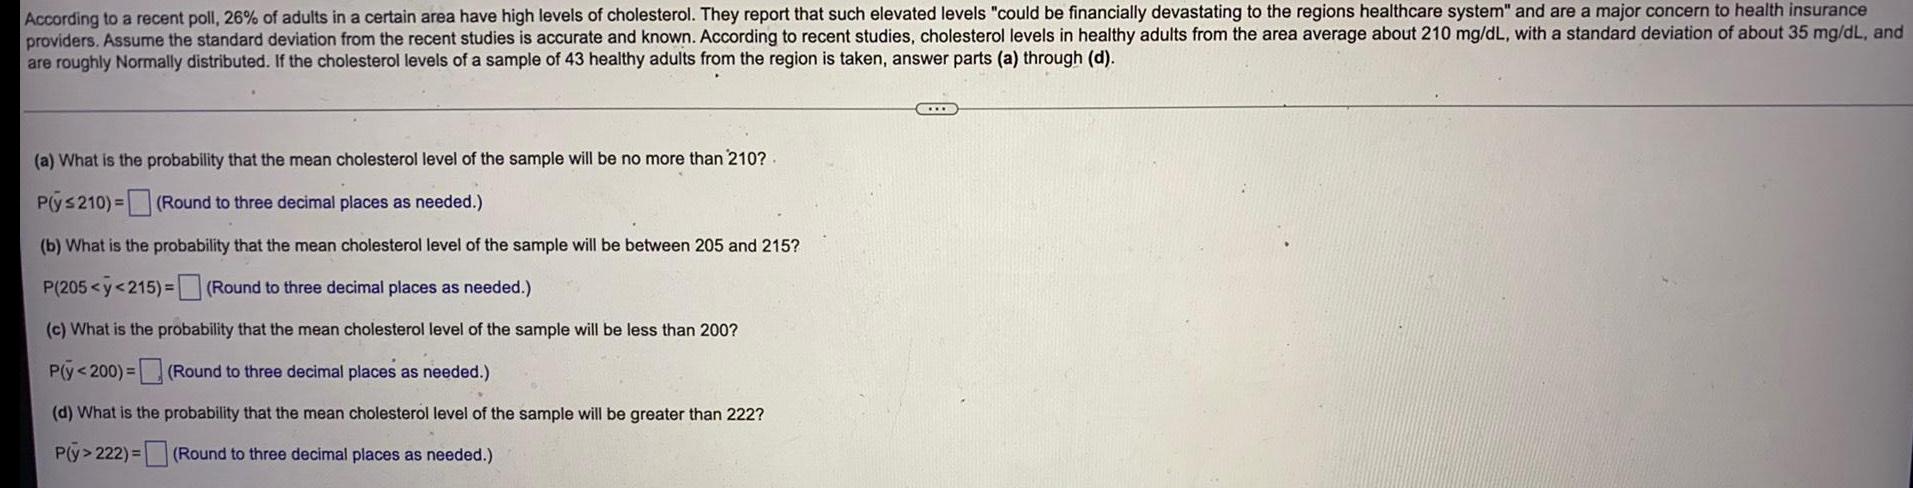
StatisticsAccording to a recent poll, 26% of adults in a certain area have high levels of cholesterol. They report that such elevated levels "could be financially devastating to the regions healthcare system" and are a major concern to health insurance providers. Assume the standard deviation from the recent studies is accurate and known. According to recent studies, cholesterol levels in healthy adults from the area average about 210 mg/dL, with a standard deviation of about 35 mg/dL, and are roughly Normally distributed. If the cholesterol levels of a sample of 43 healthy adults from the region is taken, answer parts (a) through (d).
(a) What is the probability that the mean cholesterol level of the sample will be no more than 210?
(b) What is the probability that the mean cholesterol level of the sample will be between 205 and 215?
(c) What is the probability that the mean cholesterol level of the sample will be less than 200?
(Round to three decimal places as needed.)
(d) What is the probability that the mean cholesterol level of the sample will be greater than 222?
Math
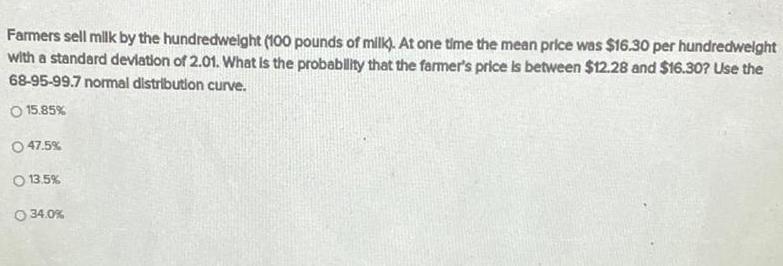
StatisticsFarmers sell milk by the hundredweight (100 pounds of milk). At one time the mean price was $16.30 per hundredweight with a standard deviation of 2.01. What is the probability that the farmer's price is between $12.28 and $16.30? Use the 68-95-99.7 normal distribution curve.
15.85% 47.5% 13.5% 34.0%
Math
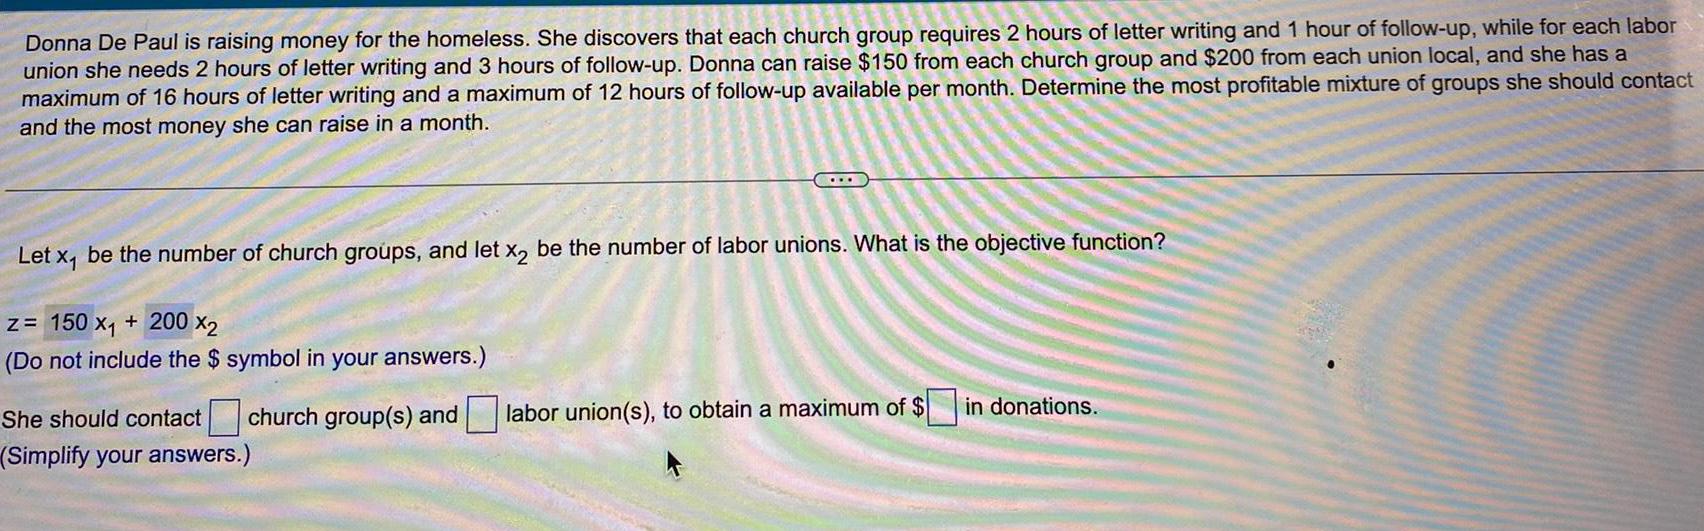
StatisticsDonna De Paul is raising money for the homeless. She discovers that each church group requires 2 hours of letter writing and 1 hour of follow-up, while for each labor union she needs 2 hours of letter writing and 3 hours of follow-up. Donna can raise $150 from each church group and $200 from each union local, and she has a maximum of 16 hours of letter writing and a maximum of 12 hours of follow-up available per month. Determine the most profitable mixture of groups she should contact and the most money she can raise in a month.
Let x₁ be the number of church groups, and let x₂ be the number of labor unions. What is the objective function?
She should contact .. church group(s) and labor union(s), to obtain a maximum of $ in donations.
Math
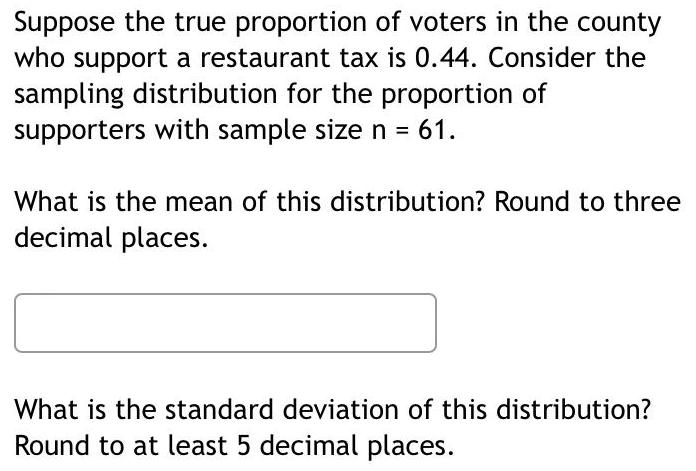
StatisticsSuppose the true proportion of voters in the county who support a restaurant tax is 0.44. Consider the sampling distribution for the proportion of supporters with sample size n = 61.
What is the mean of this distribution? Round to three decimal places.
What is the standard deviation of this distribution? Round to at least 5 decimal places.
Math
StatisticsUse the Corporate Income Tax information above to answer this question. A corporation has a taxable income of $7,857,693. At this income level, the federal income rate is 47%, the state tax rate is 21%, and the local tax rate is 15%. If each tax rate is applied to the total taxable income, the resulting tax liability for the corporation would be (47 + 21 +15) %. Luckily for the corporation, the taxes paid are deducted as described above. What is the tax liability (as a percentage of taxable income) if the customary deductions are taken into consideration? Round to the nearest tenth of a percent (one decimal place).
Math
StatisticsIn a certain animal species, the probability that a healthy adult female will have no offspring in a given year is 0.30, while the probabilities of 1, 2, 3, or 4 offspring are,
respectively, 0.23, 0.18, 0.16, and 0.13. Find the expected number of offspring.
E(X)=
(Round to two decimal places as needed.)
Math
StatisticsAn avocado grower wants to plot the weights of the avocados his farm produced this season. He thought about using a box plot, but he ultimately chose to use a histogram. Which are possible explanations for his choice? Select all that apply.
The histogram can give a more detailed view of the distribution of weights.
Only the histogram shows the highest and lowest weights.
Only the histogram shows the total number of avocados.
The box plot only shows the mean, median, and mode.
Math
StatisticsRobert, a rookie statistician, decides he wants to practice the methods he learned for performing a proportion z-test in order to determine if the average height of children at a local elementary school has increased over time. Last year every child was measured and the mean height of all students was determined to be 42 inches. This year he sampled the first six students he noticed that were wearing light-up shoes. What are the three mistakes Robert has made so far while performing his research? What steps would you take to improve his research? UPLOAD
Math
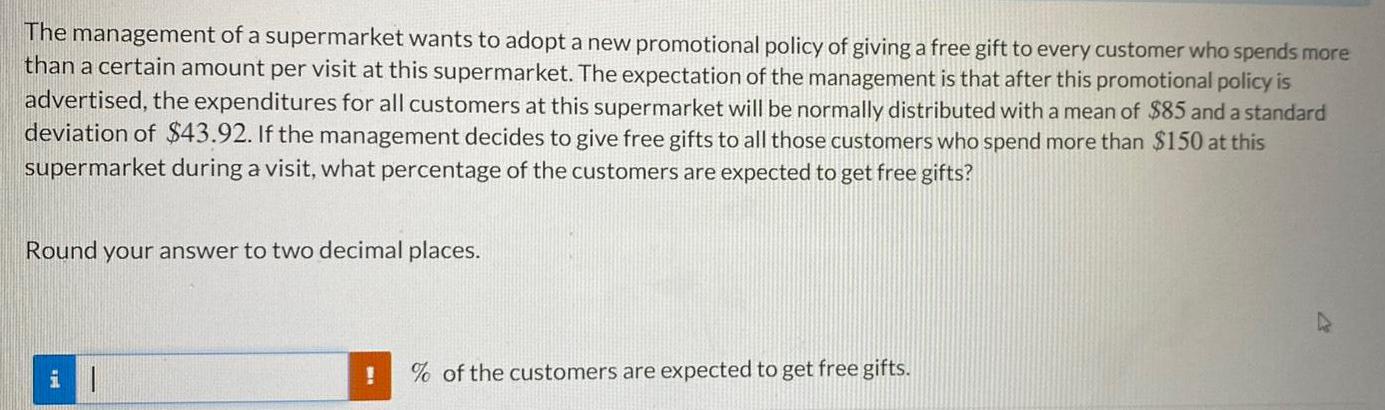
StatisticsThe management of a supermarket wants to adopt a new promotional policy of giving a free gift to every customer who spends more than a certain amount per visit at this supermarket. The expectation of the management is that after this promotional policy is advertised, the expenditures for all customers at this supermarket will be normally distributed with a mean of $85 and a standard deviation of $43.92. If the management decides to give free gifts to all those customers who spend more than $150 at this supermarket during a visit, what percentage of the customers are expected to get free gifts?
Math
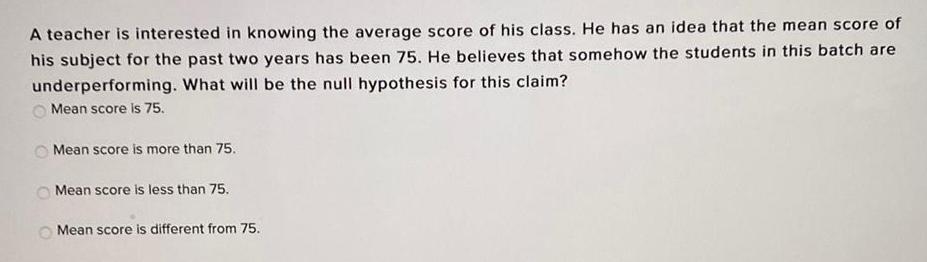
StatisticsA teacher is interested in knowing the average score of his class. He has an idea that the mean score of his subject for the past two years has been 75. He believes that somehow the students in this batch are underperforming. What will be the null hypothesis for this claim?
Mean score is 75.
Mean score is more than 75.
Mean score is less than 75.
Mean score is different from 75.
Math
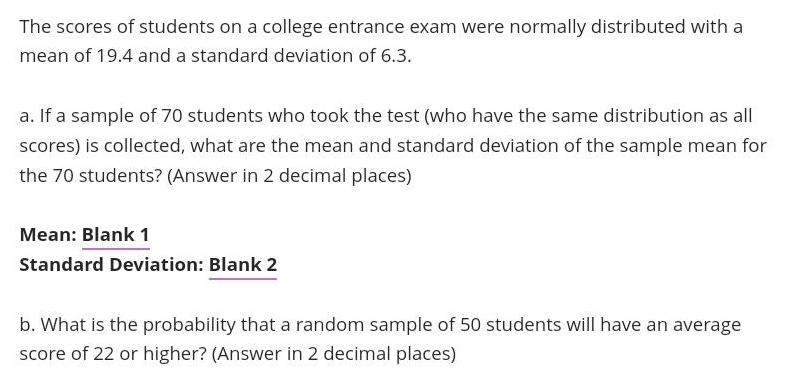
StatisticsThe scores of students on a college entrance exam were normally distributed with a mean of 19.4 and a standard deviation of 6.3.
a. If a sample of 70 students who took the test (who have the same distribution as all scores) is collected, what are the mean and standard deviation of the sample mean for the 70 students? (Answer in 2 decimal places)
b. What is the probability that a random sample of 50 students will have an average score of 22 or higher? (Answer in 2 decimal places)
Math
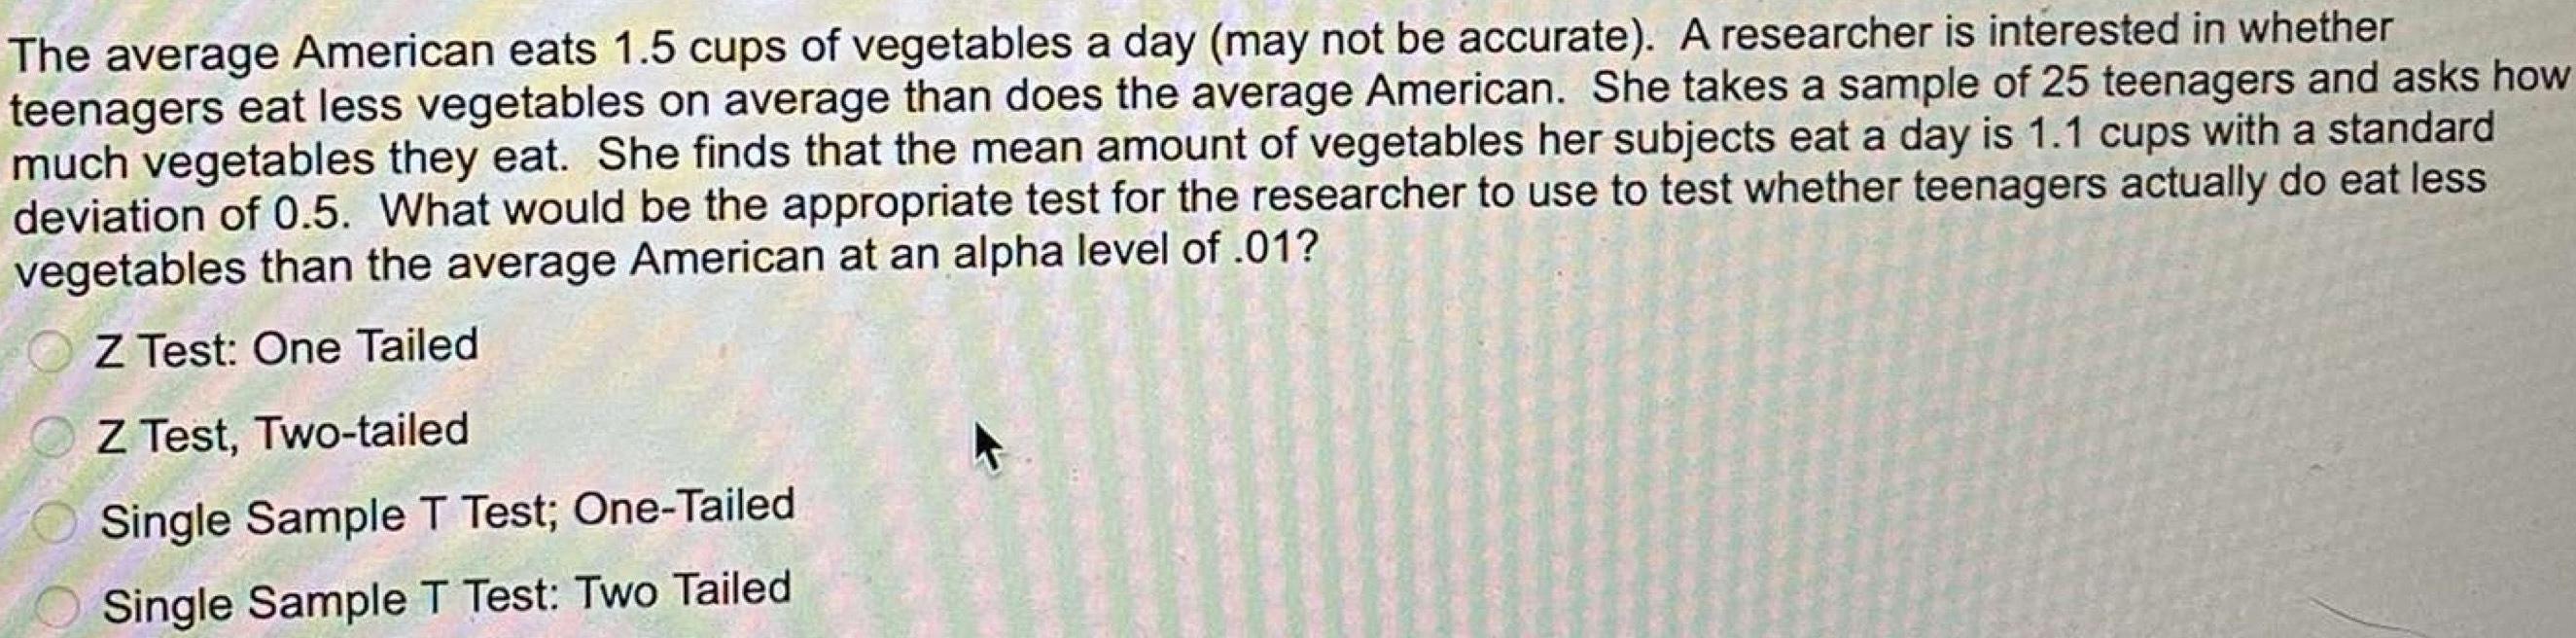
StatisticsThe average American eats 1.5 cups of vegetables a day (may not be accurate). A researcher is interested in whether teenagers eat less vegetables on average than does the average American. She takes a sample of 25 teenagers and asks how much vegetables they eat. She finds that the mean amount of vegetables her subjects eat a day is 1.1 cups with a standard deviation of 0.5. What would be the appropriate test for the researcher to use to test whether teenagers actually do eat less vegetables than the average American at an alpha level of .01?
Z Test: One Tailed
Z Test, Two-tailed
Single Sample T Test; One-Tailed
Single Sample T Test: Two Tailed
Math
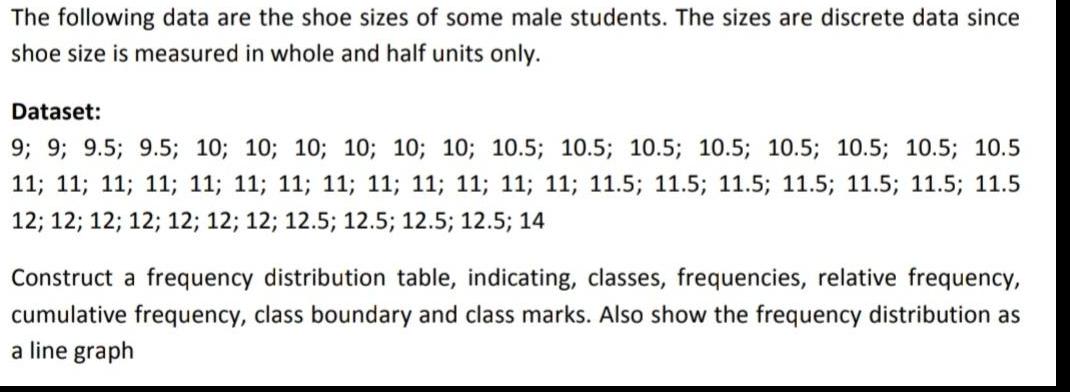
StatisticsThe following data are the shoe sizes of some male students. The sizes are discrete data since shoe size is measured in whole and half units only.
Dataset:
9; 9; 9.5; 9.5; 10; 10; 10; 10; 10; 10; 10.5; 10.5; 10.5; 10.5; 10.5; 10.5; 10.5; 10.5
11; 11; 11; 11; 11; 11; 11; 11; 11; 11; 11; 11; 11; 11.5; 11.5; 11.5; 11.5; 11.5; 11.5; 11.5
12; 12; 12; 12; 12; 12; 12; 12.5; 12.5; 12.5; 12.5; 14
Construct a frequency distribution table, indicating, classes, frequencies, relative frequency, cumulative frequency, class boundary and class marks. Also show the frequency distribution as a line graph
Math
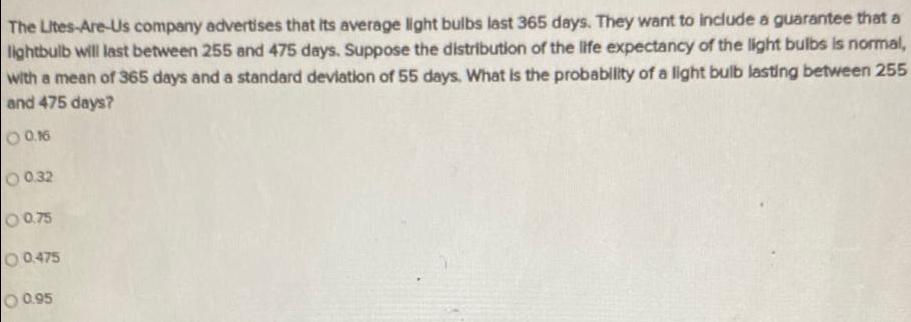
StatisticsThe Lites-Are-Us company advertises that its average light bulbs last 365 days. They want to include a guarantee that a lightbulb will last between 255 and 475 days. Suppose the distribution of the life expectancy of the light bulbs is normal, with a mean of 365 days and a standard deviation of 55 days. What is the probability of a light bulb lasting between 255 and 475 days?
0.16
0.32
0.75
0.475
0.95
Math
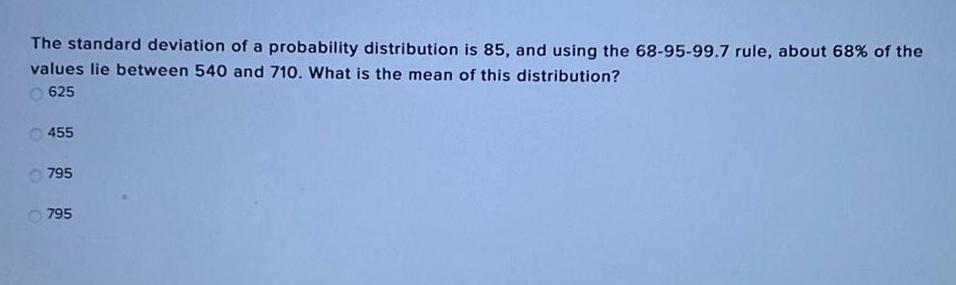
StatisticsThe standard deviation of a probability distribution is 85, and using the 68-95-99.7 rule, about 68% of the
values lie between 540 and 710. What is the mean of this distribution?
625
455
795
795
Math
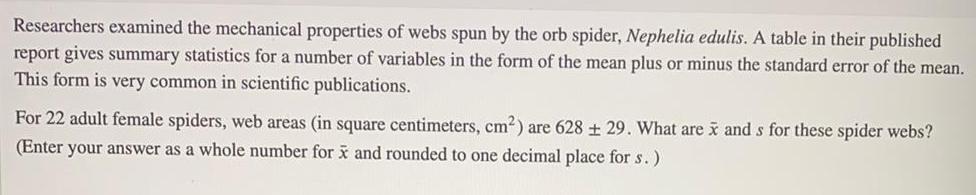
StatisticsResearchers examined the mechanical properties of webs spun by the orb spider, Nephelia edulis. A table in their published report gives summary statistics for a number of variables in the form of the mean plus or minus the standard error of the mean. This form is very common in scientific publications. For 22 adult female spiders, web areas (in square centimeters, cm²) are 628 ± 29. What are x and s for these spider webs? (Enter your answer as a whole number for x and rounded to one decimal place for s. )
Math
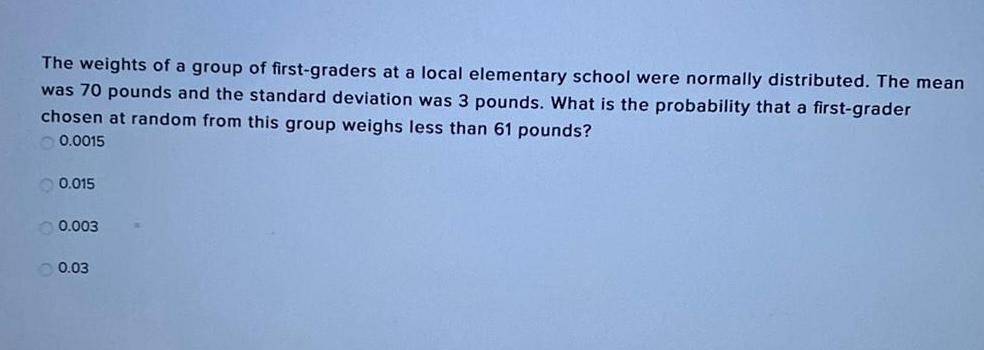
StatisticsThe weights of a group of first-graders at a local elementary school were normally distributed. The mean was 70 pounds and the standard deviation was 3 pounds. What is the probability that a first-grader chosen at random from this group weighs less than 61 pounds?
0.0015
0.015
0.003
0.03
Math
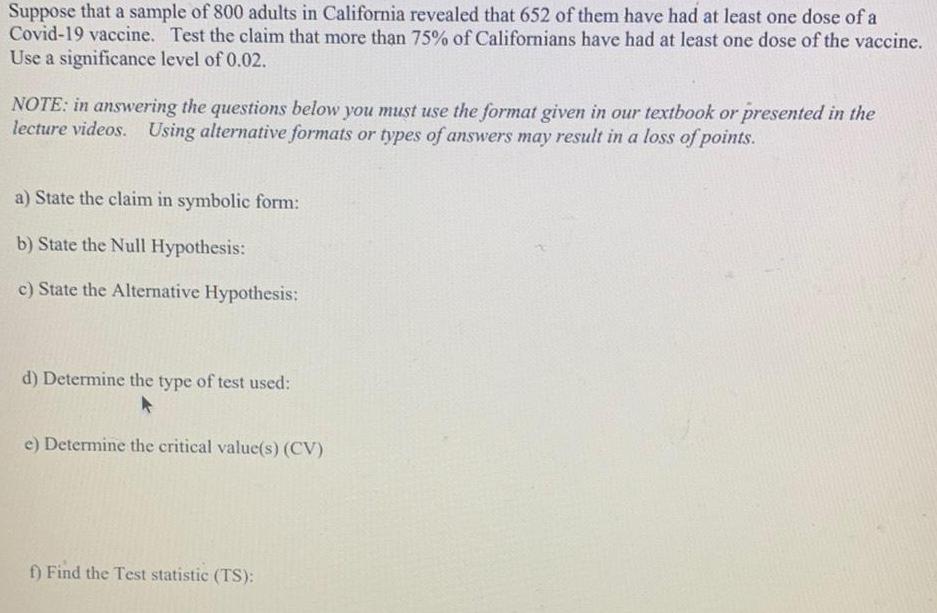
StatisticsSuppose that a sample of 800 adults in California revealed that 652 of them have had at least one dose of a Covid-19 vaccine. Test the claim that more than 75% of Californians have had at least one dose of the vaccine. Use a significance level of 0.02. NOTE: in answering the questions below you must use the format given in our textbook or presented in the lecture videos. Using alternative formats or types of answers may result in a loss of points.
a) State the claim in symbolic form:
b) State the Null Hypothesis:
c) State the Alternative Hypothesis:
d) Determine the type of test used:
e) Determine the critical value(s) (CV)
f) Find the Test statistic (TS):
Math
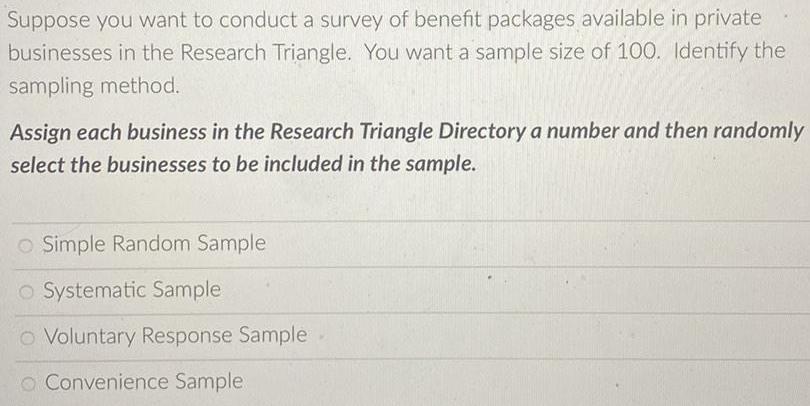
StatisticsSuppose you want to conduct a survey of benefit packages available in private businesses in the Research Triangle. You want a sample size of 100. Identify the sampling method.
Assign each business in the Research Triangle Directory a number and then randomly select the businesses to be included in the sample.
Simple Random Sample
Systematic Sample
Voluntary Response Sample
Convenience Sample
Math
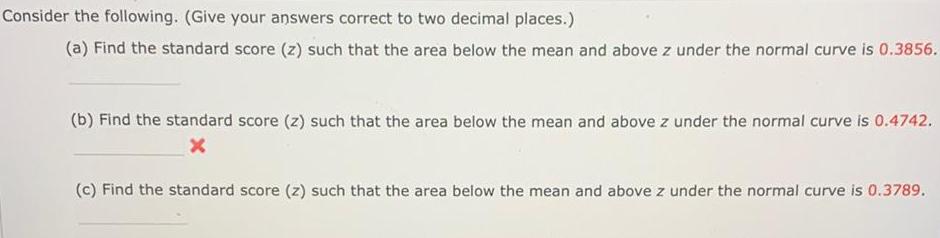
StatisticsConsider the following. (Give your answers correct to two decimal places.)
(a) Find the standard score (z) such that the area below the mean and above z under the normal curve is 0.3856.
(b) Find the standard score (z) such that the area below the mean and above z under the normal curve is 0.4742.
(c) Find the standard score (z) such that the area below the mean and above z under the normal curve is 0.3789.
Math
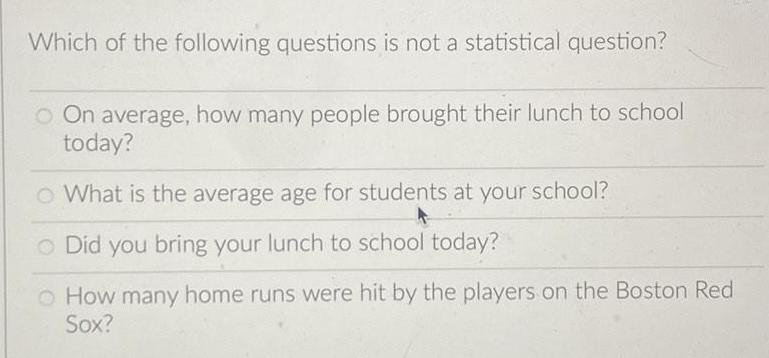
StatisticsWhich of the following questions is not a statistical question?
On average, how many people brought their lunch to school today?
What is the average age for students at your school?
Did you bring your lunch to school today?
How many home runs were hit by the players on the Boston Red Sox?
Math
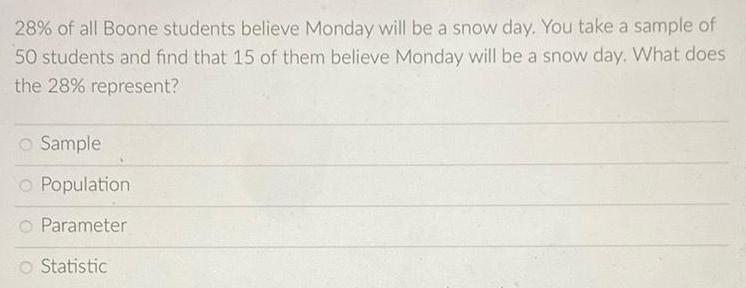
Statistics28% of all Boone students believe Monday will be a snow day. You take a sample of 50 students and find that 15 of them believe Monday will be a snow day. What does the 28% represent?
Sample
Population
Parameter
Statistic
Math
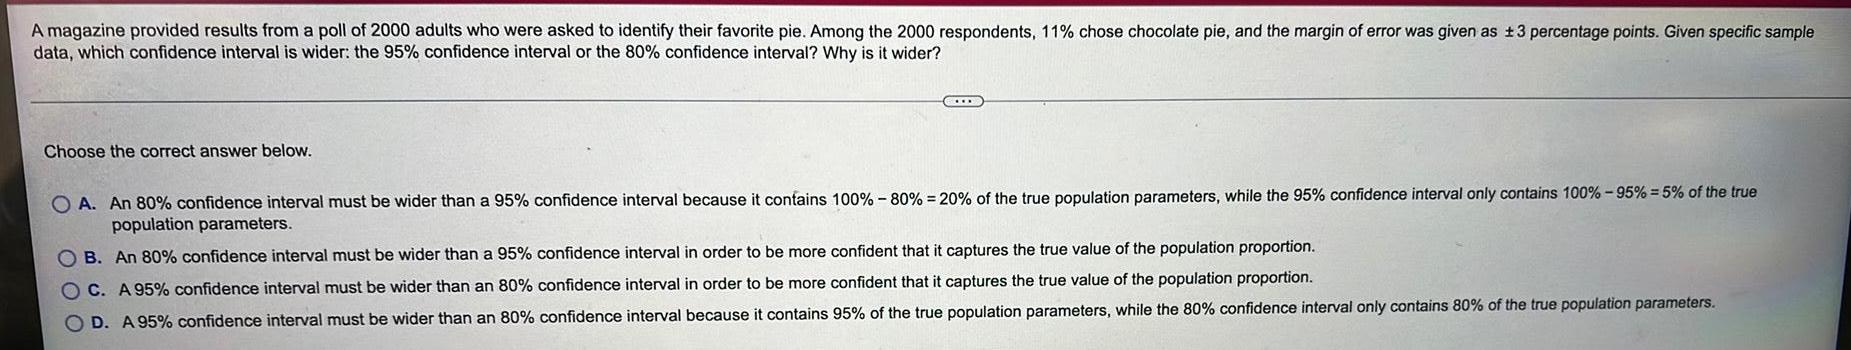
StatisticsA magazine provided results from a poll of 2000 adults who were asked to identify their favorite pie. Among the 2000 respondents, 11% chose chocolate pie, and the margin of error was given as ±3 percentage points. Given specific sample data, which confidence interval is wider: the 95% confidence interval or the 80% confidence interval? Why is it wider?
Choose the correct answer below.
A. An 80% confidence interval must be wider than a 95% confidence interval because it contains 100% -80% = 20% of the true population parameters, while the 95% confidence interval only contains 100%-95% = 5% of the true population parameters.
B. An 80% confidence interval must be wider than a 95% confidence interval in order to be more confident that it captures the true value of the population proportion.
C. A 95% confidence interval must be wider than an 80% confidence interval in order to be more confident that it captures the true value of the population proportion.
D. A 95% confidence interval must be wider than an 80% confidence interval because it contains 95% of the true population parameters, while the 80% confidence interval only contains 80% of the true population parameters.
Math
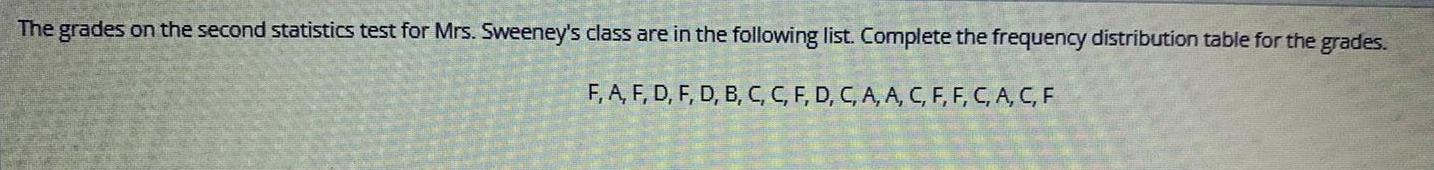
StatisticsThe grades on the second statistics test for Mrs. Sweeney's class are in the following list. Complete the frequency distribution table for the grades.
F, A, F, D, F, D, B, C, C, F, D, C, A, A, C, F, F, C, A, C, F
Math
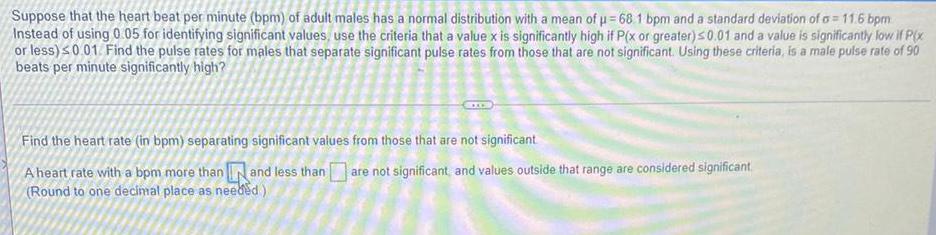
StatisticsSuppose that the heart beat per minute (bpm) of adult males has a normal distribution with a mean of μ=68 1 bpm and a standard deviation of σ = 11.6 bpm Instead of using 0.05 for identifying significant values, use the criteria that a value x is significantly high if P(x or greater) ≤0.01 and a value is significantly low if P(x or less) ≤0.01. Find the pulse rates for males that separate significant pulse rates from those that are not significant. Using these criteria, is a male pulse rate of 90 beats per minute significantly high?
Find the heart rate (in bpm) separating significant values from those that are not significant
Math
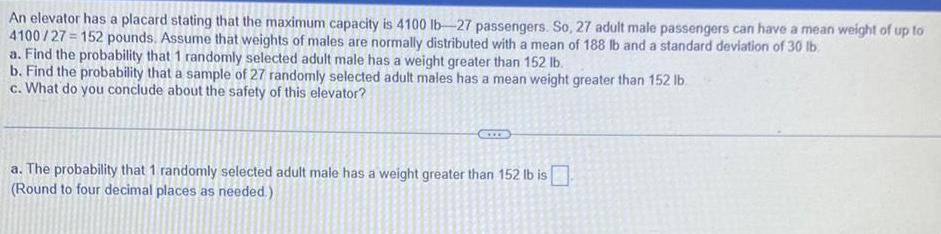
StatisticsAn elevator has a placard stating that the maximum capacity is 4100 lb-27 passengers. So, 27 adult male passengers can have a mean weight of up to 4100/27=152 pounds. Assume that weights of males are normally distributed with a mean of 188 lb and a standard deviation of 30 lb.
a. Find the probability that 1 randomly selected adult male has a weight greater than 152 lb.
b. Find the probability that a sample of 27 randomly selected adult males has a mean weight greater than 152 lb
c. What do you conclude about the safety of this elevator?
Math
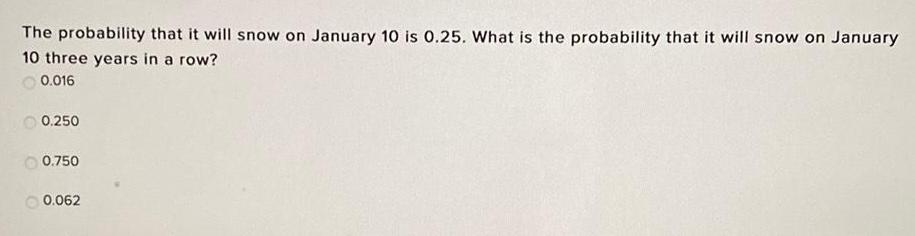
StatisticsThe probability that it will snow on January 10 is 0.25. What is the probability that it will snow on January 10 three years in a row?
0.016
0.250
0.750
0.062
Math
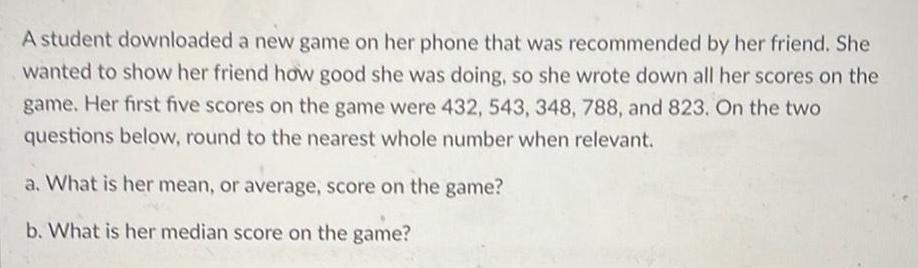
StatisticsA student downloaded a new game on her phone that was recommended by her friend. She wanted to show her friend how good she was doing, so she wrote down all her scores on the game. Her first five scores on the game were 432, 543, 348, 788, and 823. On the two questions below, round to the nearest whole number when relevant.
a. What is her mean, or average, score on the game?
b. What is her median score on the game?
Math
StatisticsIn a random sample of size 100 taken from a population of size 1,000, the mean and s.d. of a sample characteristic are found to be 4.8 and 1.1 respectively. Find the 95% confidence interval for the population mean.
Math
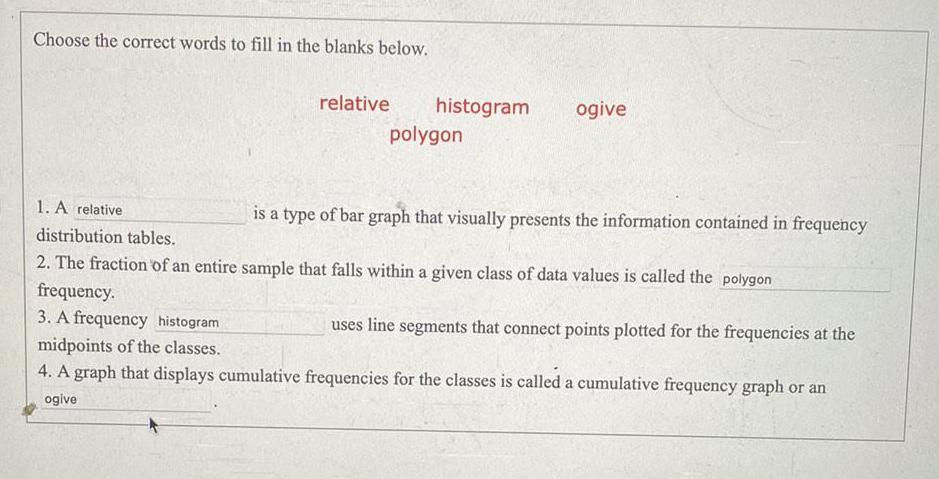
StatisticsChoose the correct words to fill in the blanks below.
relative
histogram
polygon
ogive
1. A ... is a type of bar graph that visually presents the information contained in frequency distribution tables.
2. The fraction of an entire sample that falls within a given class of data values is called the ... frequency.
3. A frequency ... uses line segments that connect points plotted for the frequencies at the midpoints of the classes.
4. A graph that displays cumulative frequencies for the classes is called a cumulative frequency graph or an ...
Math
StatisticsIn a recent survey, 65% of those surveyed were in favor of a local school levy. The margin of error
was 2%. How many people were surveyed?
Hint: Use the Margin of error formula in the previous question. Let ME = 0.02 and p = 0.65.
Solve for n.
Math
StatisticsA company who manufactures hearing aids has a goal of having no more than 10 defective hearing aids per shipment. A company executive sampled 32 shipments and found an average of 8.5 defective hearing aids per shipment with a standard deviation of 4.2. She claims that this ensures the company is hitting their goal. Test her claim using a significance of alpha = 0.05.
Reject the null hypothesis with a p-value of greater than 0.05
Fail to reject the null hypothesis with a p-value of greater than 0.05
Reject the null hypothesis with a p-value of less than 0.05
Fail to reject the null hypothesis with a p-value of less than 0.05
Math
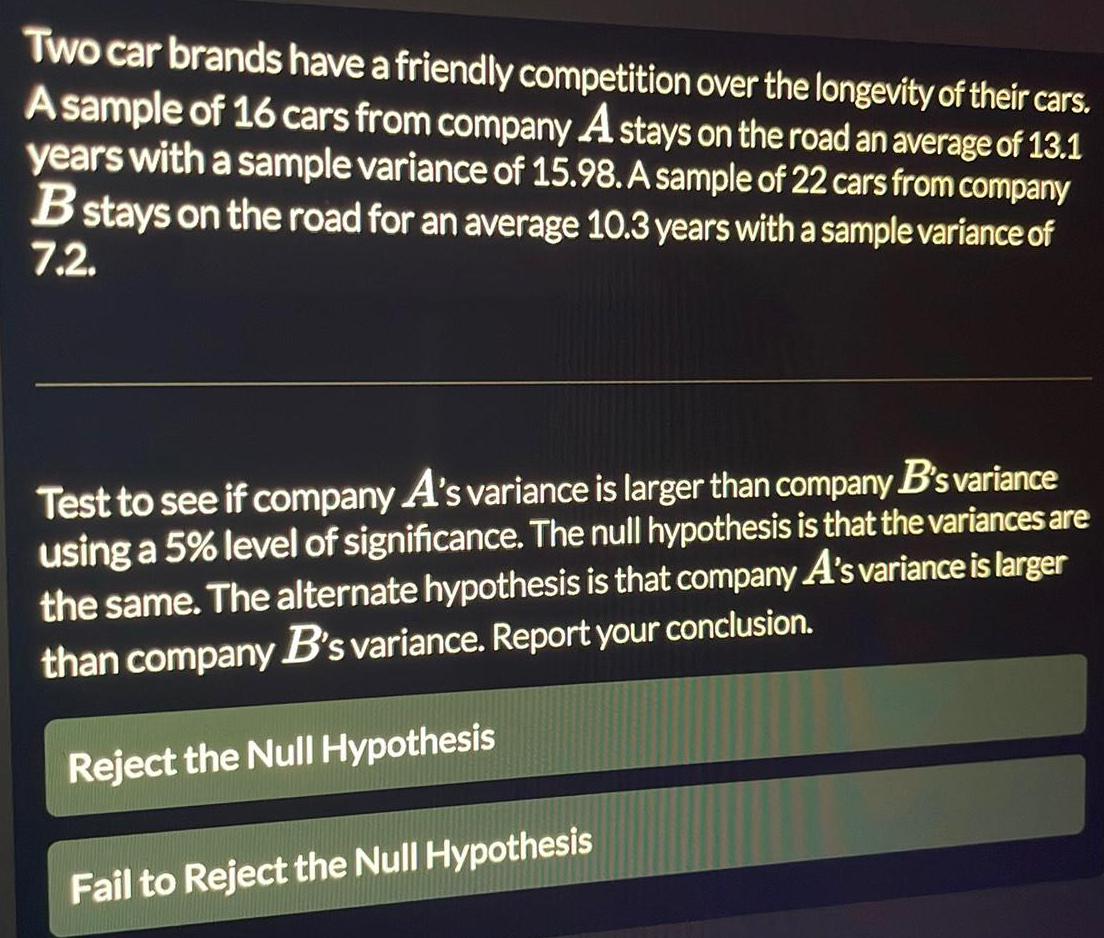
StatisticsTwo car brands have a friendly competition over the longevity of their cars.
A sample of 16 cars from company A stays on the road an average of 13.1
years with a sample variance of 15.98. A sample of 22 cars from company
B stays on the road for an average 10.3 years with a sample variance of
7.2.
Test to see if company A's variance is larger than company B's variance
using a 5% level of significance. The null hypothesis is that the variances are
the same. The alternate hypothesis is that company A's variance is larger
than company B's variance. Report your conclusion.
Reject the Null Hypothesis
Fail to Reject the Null Hypothesis
Math
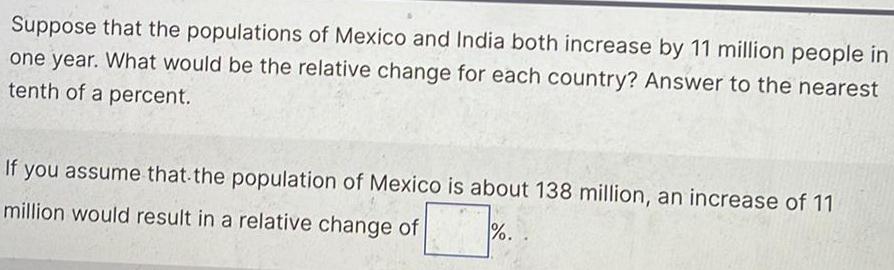
StatisticsSuppose that the populations of Mexico and India both increase by 11 million people in
one year. What would be the relative change for each country? Answer to the nearest
tenth of a percent.
If you assume that the population of Mexico is about 138 million, an increase of 11
million would result in a relative change of %.
Math
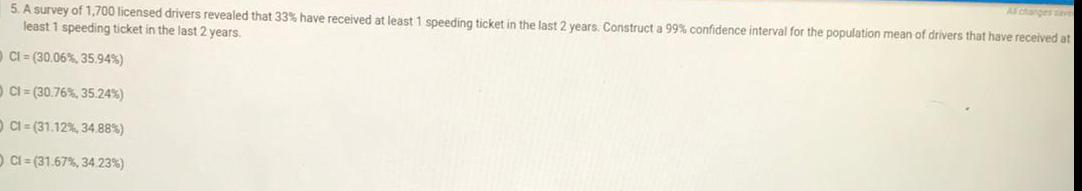
StatisticsA survey of 1,700 licensed drivers revealed that 33% have received at least 1 speeding ticket in the last 2 years. Construct a 99% confidence interval for the population mean of drivers that have received at least 1 speeding ticket in the last 2 years.
CI=(30.06%, 35.94%)
CI=(30.76%, 35.24%)
CI=(31.12%, 34.88%)
CI=(31.67%, 34.23%)
Math
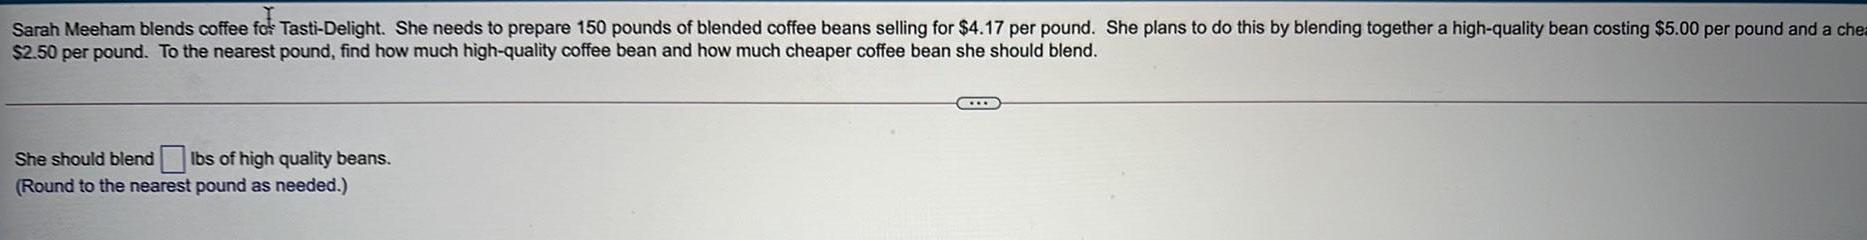
StatisticsSarah Meeham blends coffee for Tasti-Delight. She needs to prepare 150 pounds of blended coffee beans selling for $4.17 per pound. She plans to do this by blending together a high-quality bean costing $5.00 per pound and a chea $2.50 per pound. To the nearest pound, find how much high-quality coffee bean and how much cheaper coffee bean she should blend.
She should blend lbs of high quality beans.
Math
StatisticsIn the US, 44% of households subscribe to a cable service. Assume that 200 homes are randomly surveyed. Let x the number that subscribe to a cable service. Assume that households are independent. What is the probability that fewer than 75 of the households subscribe to a cable service?
Math
StatisticsA student creates a survey to see how many computers households own in a specific neighborhood. Of 500 responses, 54 households own no computers, 129 households own one computer, 97 households own two computers, and 220 households own three computers. In this neighborhood, what is the expected number of computers owned per household?
0
1
2
3
Math
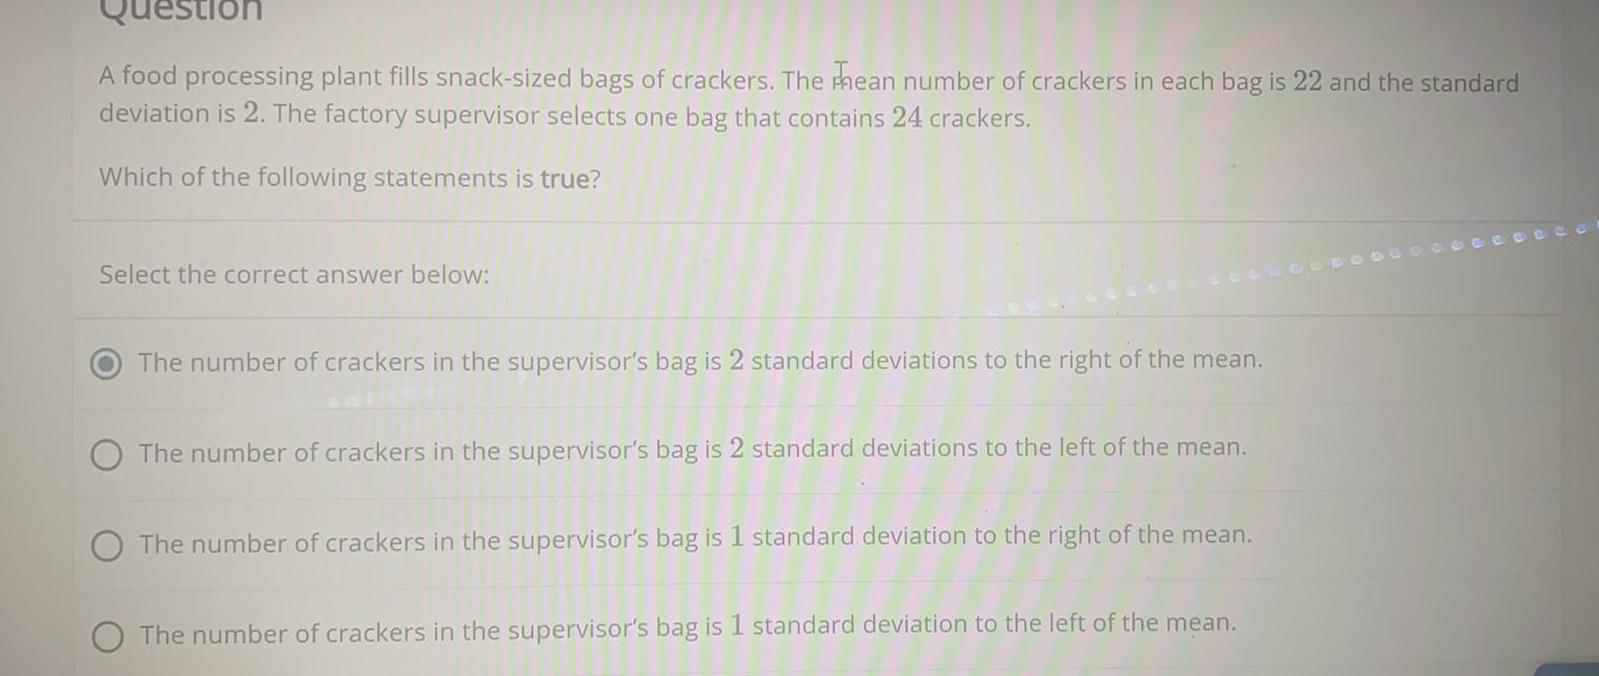
StatisticsA food processing plant fills snack-sized bags of crackers. The hean number of crackers in each bag is 22 and the standard deviation is 2. The factory supervisor selects one bag that contains 24 crackers.
Which of the following statements is true?
Select the correct answer below:
The number of crackers in the supervisor's bag is 2 standard deviations to the right of the mean.
The number of crackers in the supervisor's bag is 2 standard deviations to the left of the mean.
The number of crackers in the supervisor's bag is 1 standard deviation to the right of the mean.
The number of crackers in the supervisor's bag is 1 standard deviation to the left of the mean.
Math
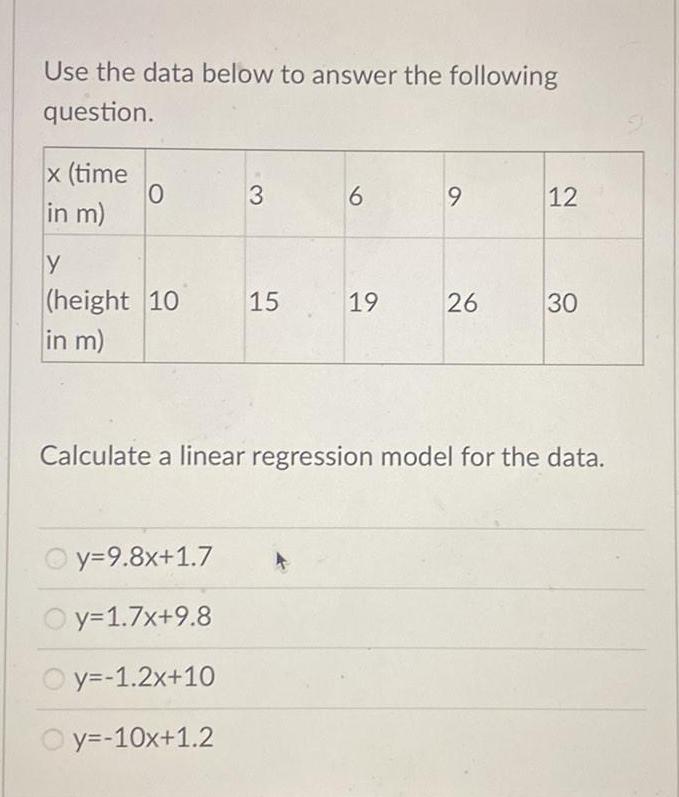
StatisticsUse the data below to answer the following question.
x (time in m) 0 3 6 9 12
y (height 10 in m) 10 15 19 26 30
y=9.8x+1.7
y=1.7x+9.8
y=-1.2x+10
y=-10x+1.2
Calculate a linear regression model for the data.
Math
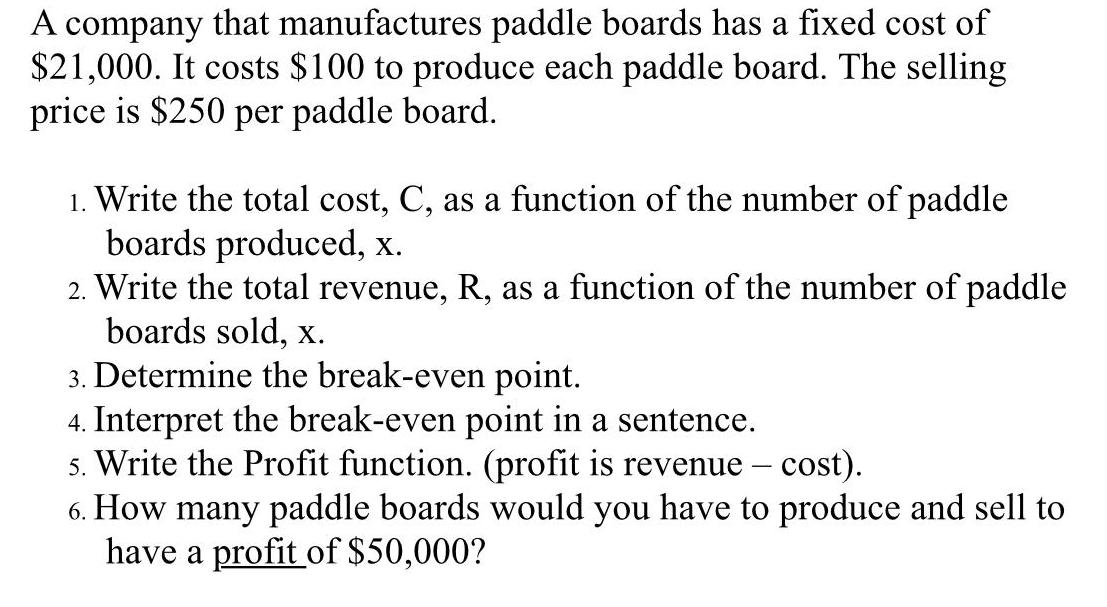
StatisticsA company that manufactures paddle boards has a fixed cost of $21,000. It costs $100 to produce each paddle board. The selling price is $250 per paddle board.
1. Write the total cost, C, as a function of the number of paddle boards produced, x.
2. Write the total revenue, R, as a function of the number of paddle boards sold, x.
3. Determine the break-even point.
4. Interpret the break-even point in a sentence.
5. Write Profit function. (profit is revenue - cost). 6. How many paddle boards would you have to produce and sell to have a profit of $50,000?
Math
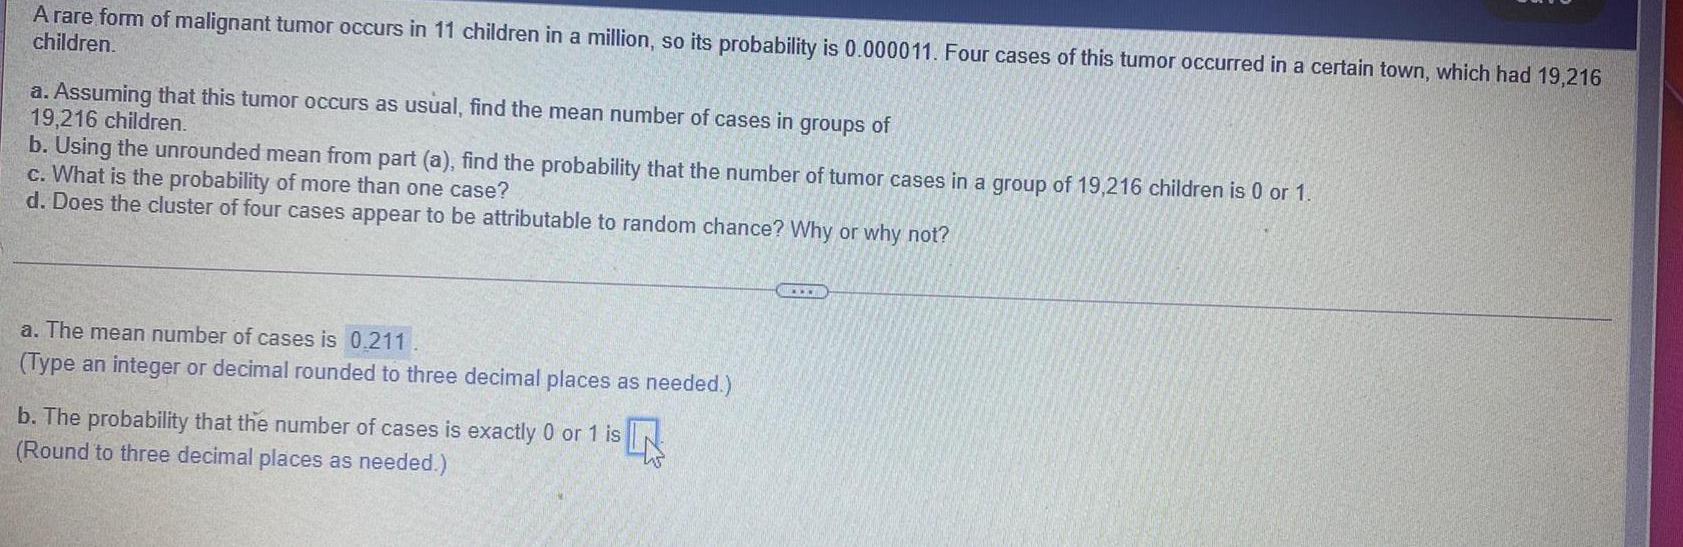
StatisticsA rare form of malignant tumor occurs in 11 children in a million, so its probability is 0.000011. Four cases of this tumor occurred in a certain town, which had 19,216 children.
a. Assuming that this tumor occurs as usual, find the mean number of cases in groups of 19,216 children.
b. Using the unrounded mean from part (a), find the probability that the number of tumor cases in a group of 19,216 children is 0 or 1.
c. What is the probability of more than one case?
d. Does the cluster of four cases appear to be attributable to random chance? Why or why not?
Math
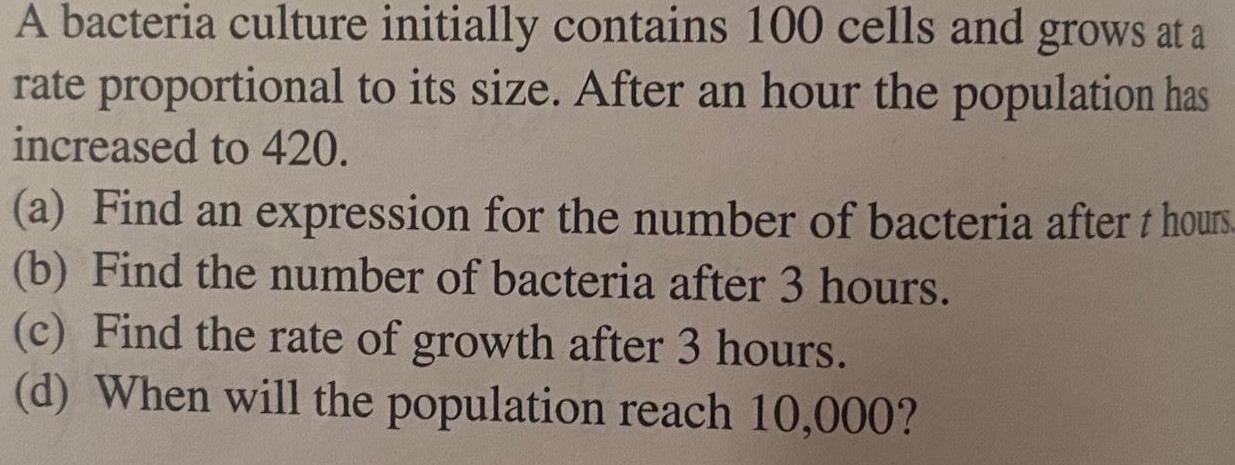
StatisticsA bacteria culture initially contains 100 cells and grows at a rate proportional to its size. After an hour the population has increased to 420.
(a) Find an expression for the number of bacteria after t hours.
(b) Find the number of bacteria after 3 hours.
(c) Find the rate of growth after 3 hours.
(d) When will the population reach 10,000?
Math
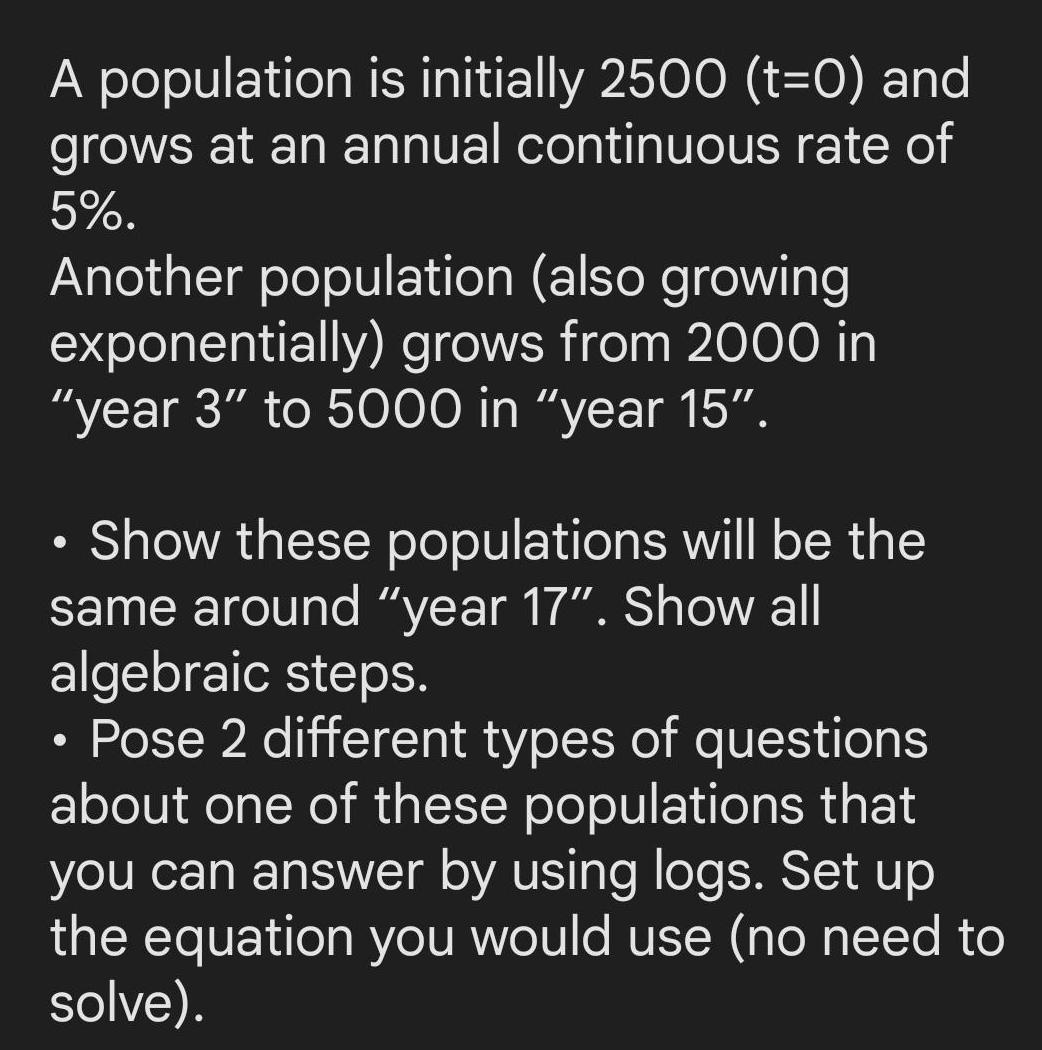
StatisticsA population is initially 2500 (t=0) and
grows at an annual continuous rate of
5%.
Another population (also growing
exponentially) grows from 2000 in
"year 3" to 5000 in "year 15”.
Show these populations will be the
same around "year 17". Show all
algebraic steps.
Pose 2 different types of questions
about one of these populations that
you can answer by using logs. Set up
the equation you would use (no need to
solve).
●
Math
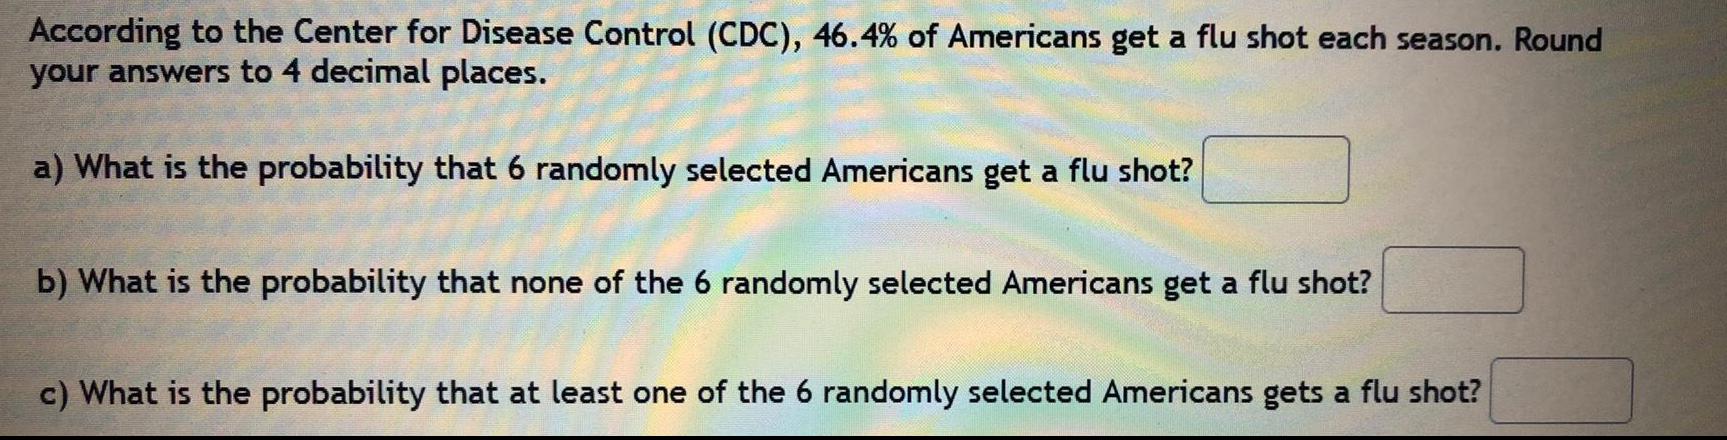
StatisticsAccording to the Center for Disease Control (CDC), 46.4% of Americans get a flu shot each season. Round your answers to 4 decimal places.
a) What is the probability that 6 randomly selected Americans get a flu shot?
b) What is the probability that none of the 6 randomly selected Americans get a flu shot?
c) What is the probability that at least one of the 6 randomly selected Americans gets a flu shot?
Math
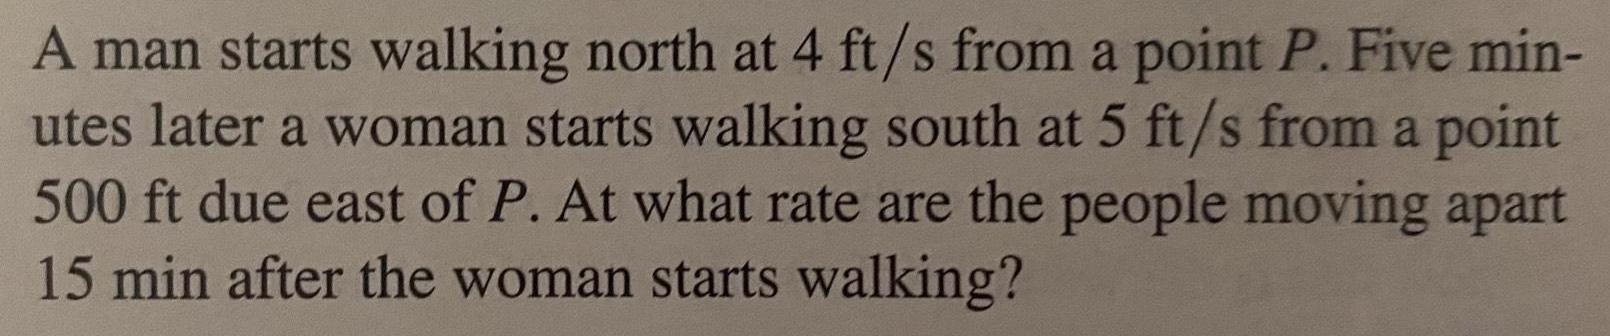
StatisticsA man starts walking north at 4 ft/s from a point P. Five min-
utes later a woman starts walking south at 5 ft/s from a point
500 ft due east of P. At what rate are the people moving apart
15 min after the woman starts walking?