Statistics Questions and Answers
Math
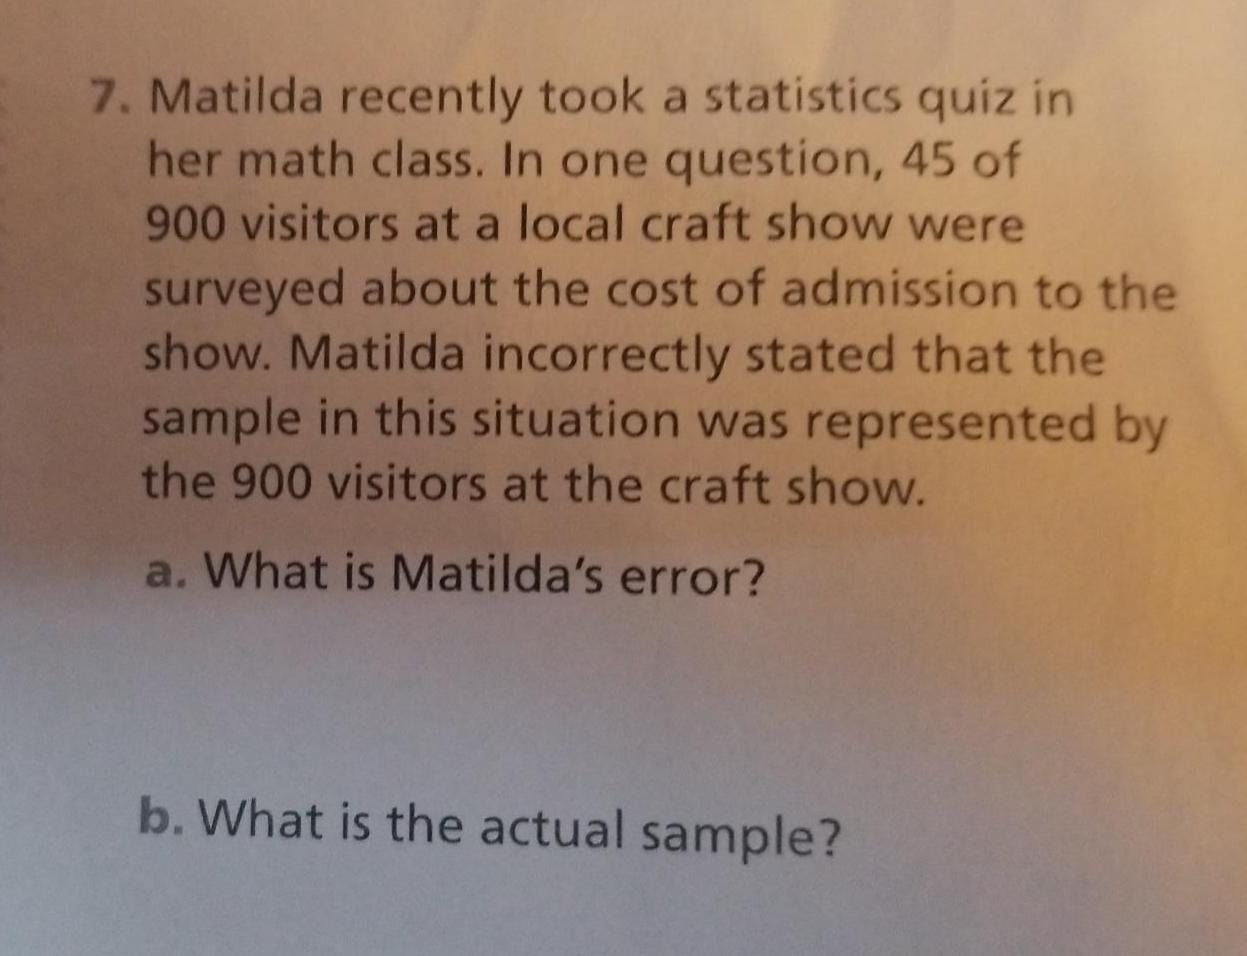
Statistics7. Matilda recently took a statistics quiz in
her math class. In one question, 45 of
900 visitors at a local craft show were
surveyed about the cost of admission to the
show. Matilda incorrectly stated that the
sample in this situation was represented by
the 900 visitors at the craft show.
a. What is Matilda's error?
b. What is the actual sample?
Math
Statistics0512-3
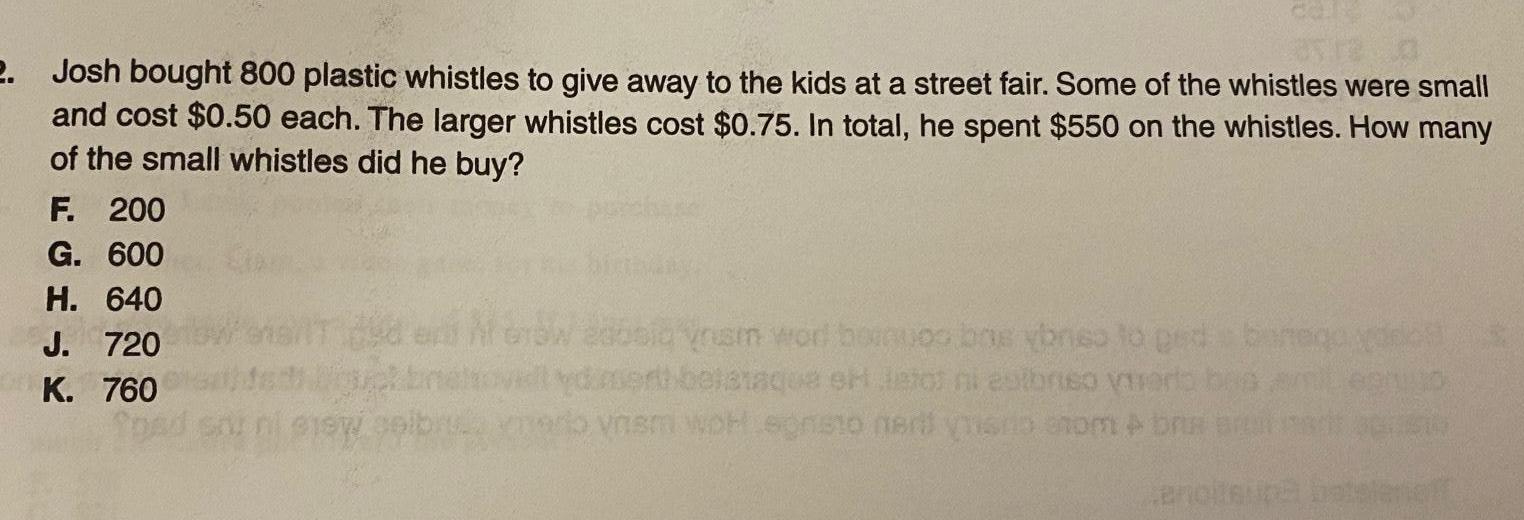
2. Josh bought 800 plastic whistles to give away to the kids at a street fair. Some of the whistles were small
and cost $0.50 each. The larger whistles cost $0.75. In total, he spent $550 on the whistles. How many
of the small whistles did he buy?
F. 200
G. 600
H. 640
J. 720
K. 760
$197
sid'yrusm wod bonuos bos briso to ped bane
atataque eH letos ni eutbriso viraris besar
o vnsm woh sonsto mer meno onom brug
anoitsura botelerof
Math
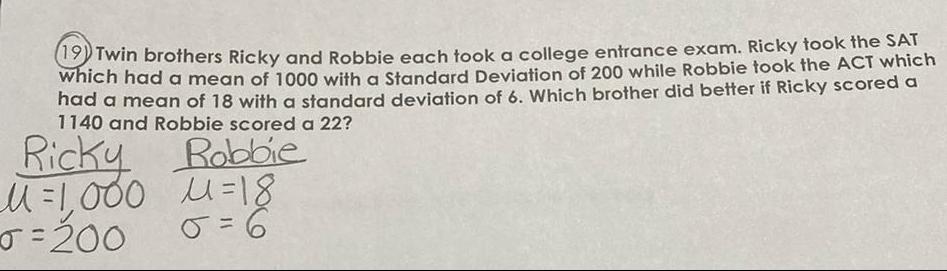
Statistics19 Twin brothers Ricky and Robbie each took a college entrance exam. Ricky took the SAT which had a mean of 1000 with a Standard Deviation of 200 while Robbie took the ACT which had a mean of 18 with a standard deviation of 6. Which brother did better if Ricky scored a 1140 and Robbie scored a 22?
Math
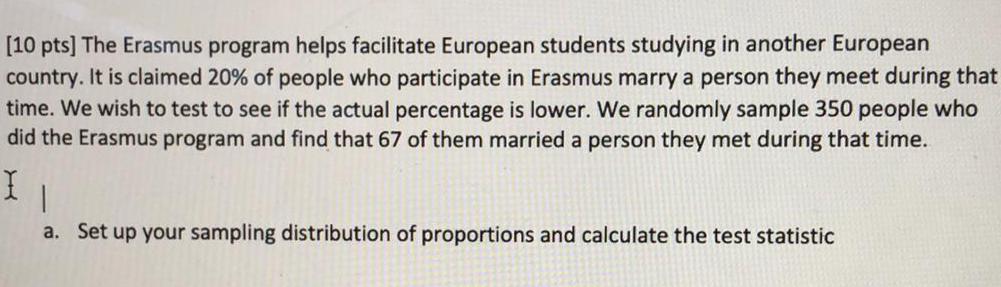
StatisticsThe Erasmus program helps facilitate European students studying in another European country. It is claimed 20% of people who participate in Erasmus marry a person they meet during that time. We wish to test to see if the actual percentage is lower. We randomly sample 350 people who did the Erasmus program and find that 67 of them married a person they met during that time.
a. Set up your sampling distribution of proportions and calculate the test statistic
Math
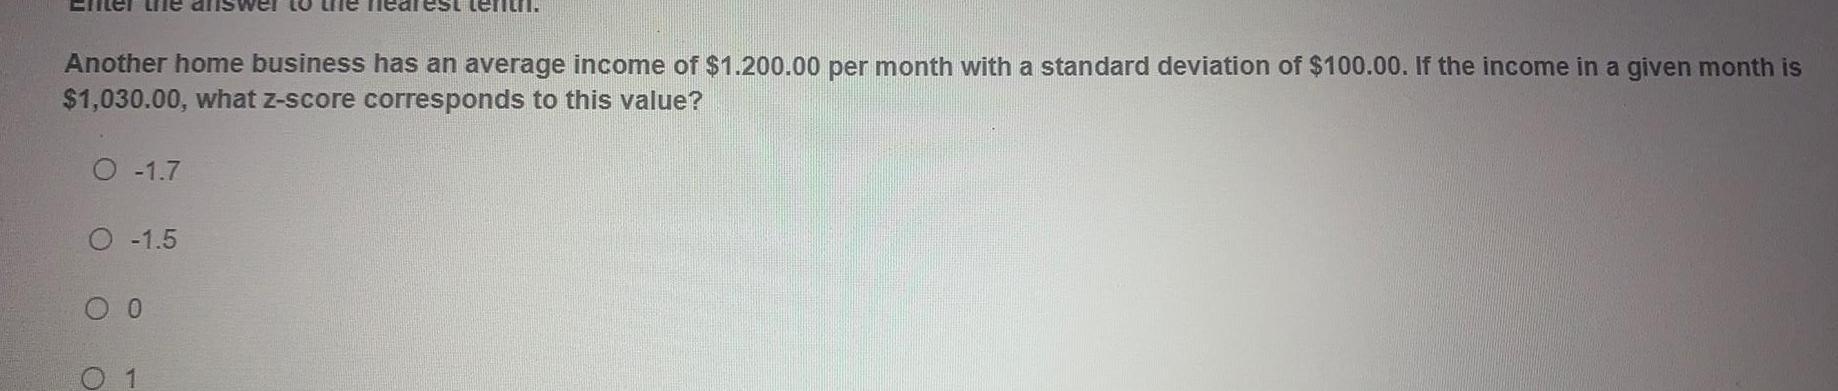
StatisticsAnother home business has an average income of $1.200.00 per month with a standard deviation of $100.00. If the income in a given month is $1,030.00, what z-score corresponds to this value?
-1.7
-1.5
0
1
Math
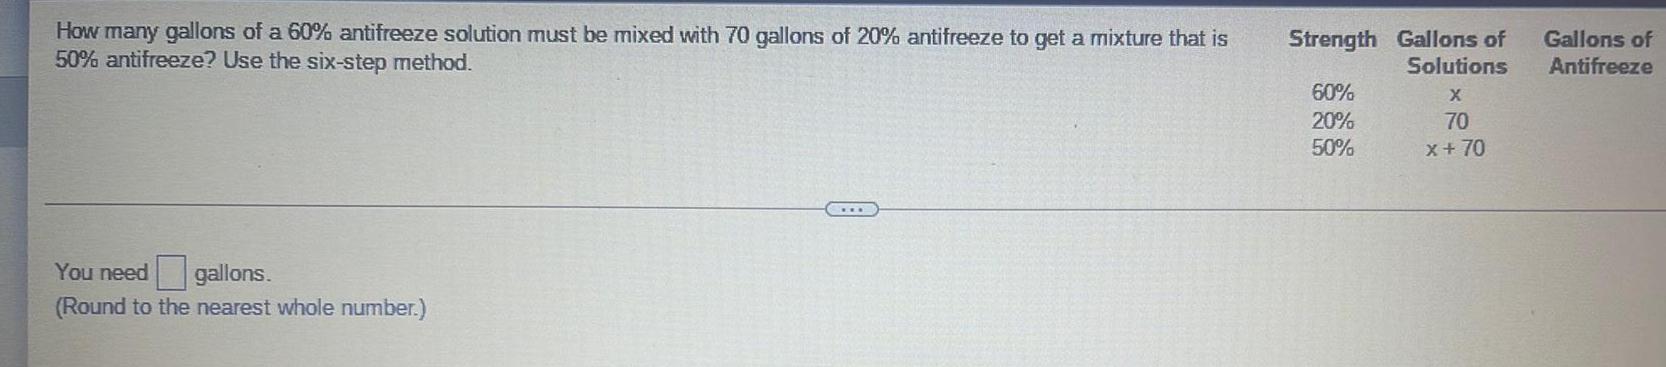
StatisticsHow many gallons of a 60% antifreeze solution must be mixed with 70 gallons of 20% antifreeze to get a mixture that is 50% antifreeze? Use the six-step method.
Math
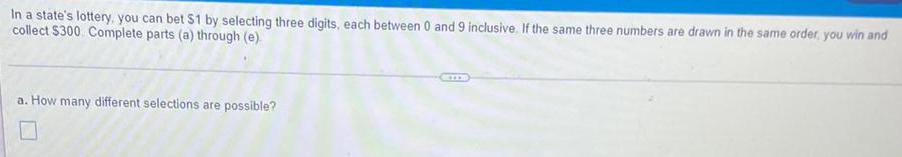
StatisticsIn a state's lottery, you can bet $1 by selecting three digits, each between 0 and 9 inclusive. If the same three numbers are drawn in the same order, you win and collect $300 Complete parts (a) through (e).
a. How many different selections are possible?
![Alexis and Adriana began arguing about who did better on their tests, but they couldn't decide who did better given that they took different tests. Alexis took a test in Art History and earned a 74.7, and Adriana took a test in Math and earned a 69.6. Use the fact that all the students' test grades in the Art History class had a mean of 73 and a standard deviation of 11.5, and all the students' test grades in Math had a mean of 65.1 and a standard deviation of 7.9 to answer the following questions.
a) Calculate the z-score for Alexis's test grade. Z= [Round your answer to two decimal places.]
b) Calculate the z-score for Adriana's test grade. Z= They did equally well. [Round your answer to two decimal places.]
c) Which person did relatively better? O Alexis O Adriana 4](https://media.kunduz.com/media/sug-question/raw/69942431-1657466313.3177555.jpeg?w=256)
Math
StatisticsAlexis and Adriana began arguing about who did better on their tests, but they couldn't decide who did better given that they took different tests. Alexis took a test in Art History and earned a 74.7, and Adriana took a test in Math and earned a 69.6. Use the fact that all the students' test grades in the Art History class had a mean of 73 and a standard deviation of 11.5, and all the students' test grades in Math had a mean of 65.1 and a standard deviation of 7.9 to answer the following questions.
a) Calculate the z-score for Alexis's test grade. Z= [Round your answer to two decimal places.]
b) Calculate the z-score for Adriana's test grade. Z= They did equally well. [Round your answer to two decimal places.]
c) Which person did relatively better? O Alexis O Adriana 4
Math
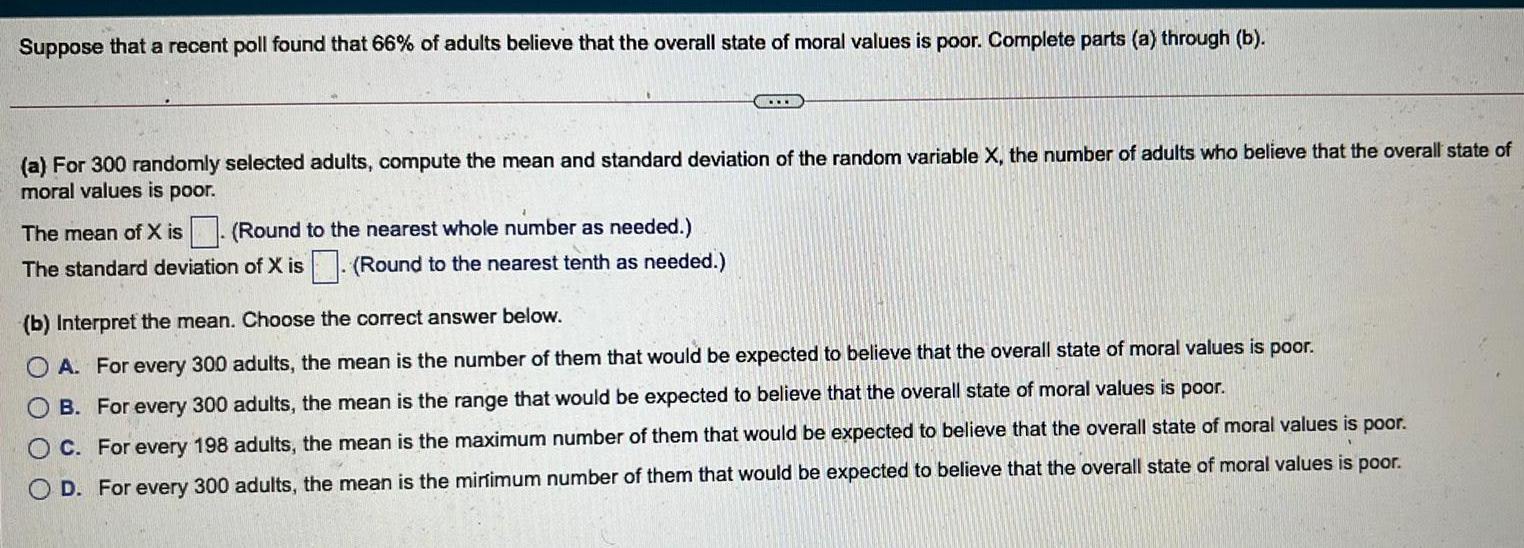
StatisticsSuppose that a recent poll found that 66% of adults believe that the overall state of moral values is poor. Complete parts (a) through (b).
(a) For 300 randomly selected adults, compute the mean and standard deviation of the random variable X, the number of adults who believe that the overall state of moral values is poor.
The mean of X is
The standard deviation of X is. (Round to the nearest tenth as needed.)
(b) Interpret the mean. Choose the correct answer below.
A. For every 300 adults, the mean is the number of them that would be expected to believe that the overall state of moral values is poor.
B. For every 300 adults, the mean is the range that would be expected to believe that the overall state of moral values is poor.
C. For every 198 adults, the mean is the maximum number of them that would be expected to believe that the overall state of moral values is poor.
D. For every 300 adults, the mean is the minimum number of them that would be expected to believe that the overall state of moral values is poor.
Math
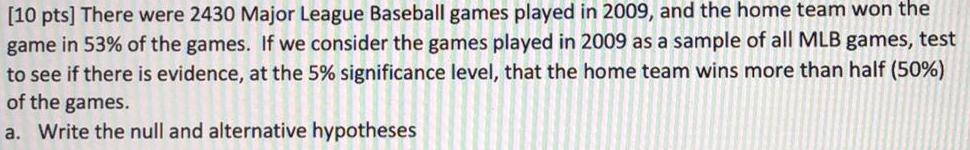
StatisticsThere were 2430 Major League Baseball games played in 2009, and the home team won the game in 53% of the games. If we consider the games played in 2009 as a sample of all MLB games, test to see if there is evidence, at the 5% significance level, that the home team wins more than half (50%) of the games.
a. Write the null and alternative hypotheses
Math
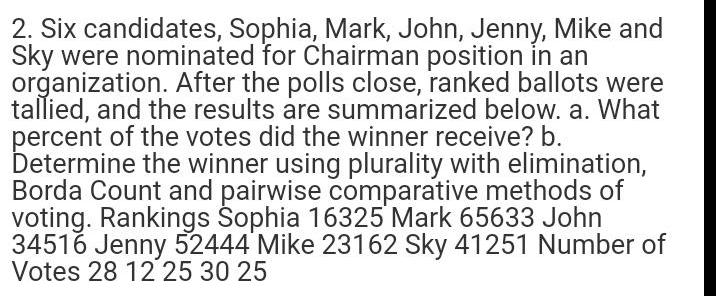
StatisticsSix candidates, Sophia, Mark, John, Jenny, Mike and Sky were nominated for Chairman position in an organization. After the polls close, ranked ballots were tallied, and the results are summarized below. a. What percent of the votes did the winner receive? b. Determine the winner using plurality with elimination, Borda Count and pairwise comparative methods of voting.
Rankings Sophia 16325 Mark 65633 John 34516 Jenny 52444 Mike 23162 Sky 41251 Number of Votes 28 12 25 30 25
Math
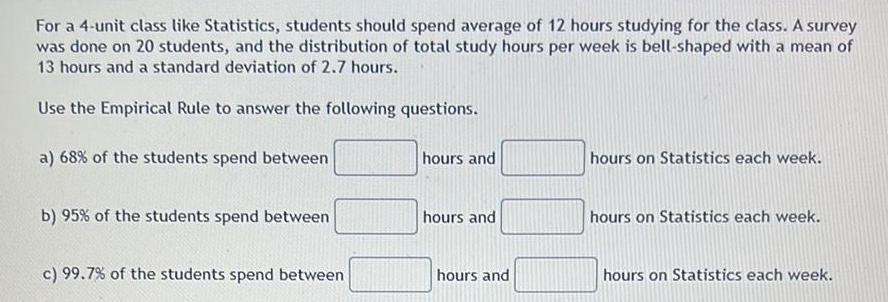
StatisticsFor a 4-unit class like Statistics, students should spend average of 12 hours studying for the class. A survey was done on 20 students, and the distribution of total study hours per week is bell-shaped with a mean of 13 hours and a standard deviation of 2.7 hours.
Use the Empirical Rule to answer the following questions.
a) 68% of the students spend between hours and hours on Statistics each week.
b) 95% of the students spend between hours and hours on Statistics each week.
c) 99.7% of the students spend between hours and hours on Statistics each week.
Math
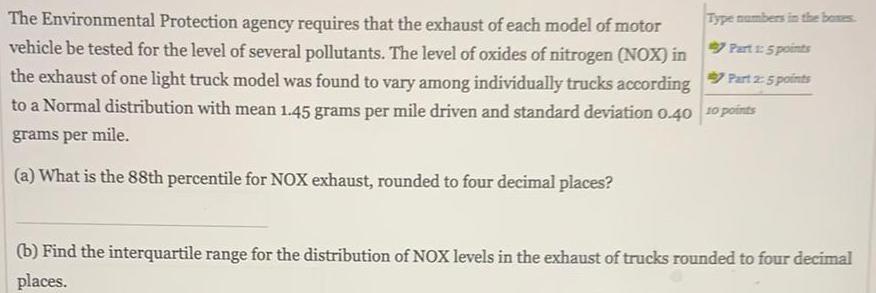
StatisticsThe Environmental Protection agency requires that the exhaust of each model of motor vehicle be tested for the level of several pollutants. The level of oxides of nitrogen (NOX) in the exhaust of one light truck model was found to vary among individually trucks according to a Normal distribution with mean 1.45 grams per mile driven and standard deviation 0.40 grams per mile.
(a) What is the 88th percentile for NOX exhaust, rounded to four decimal places?
(b) Find the interquartile range for the distribution of NOX levels in the exhaust of trucks rounded to four decimal places.

Math
StatisticsOn average, a U.S. smartphone owner between the ages of 18 and 24 sends and receives a total of 3853 text messages per month. The number sent is 191 more than the number received. On average, how many text messages are sent and how many are received per month by a smartphone owner in this age group?
Math
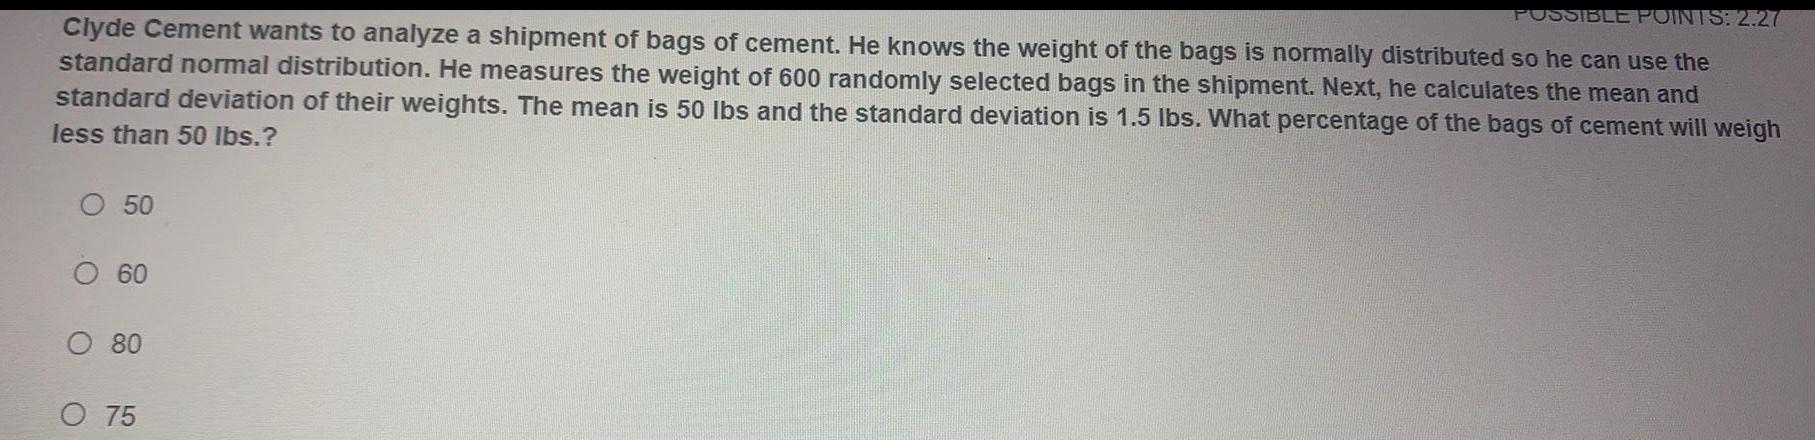
StatisticsClyde Cement wants to analyze a shipment of bags of cement. He knows the weight of the bags is normally distributed so he can use the standard normal distribution. He measures the weight of 600 randomly selected bags in the shipment. Next, he calculates the mean and standard deviation of their weights. The mean is 50 lbs and the standard deviation is 1.5 lbs. What percentage of the bags of cement will weigh less than 50 lbs.?
50
60
80
75
Math
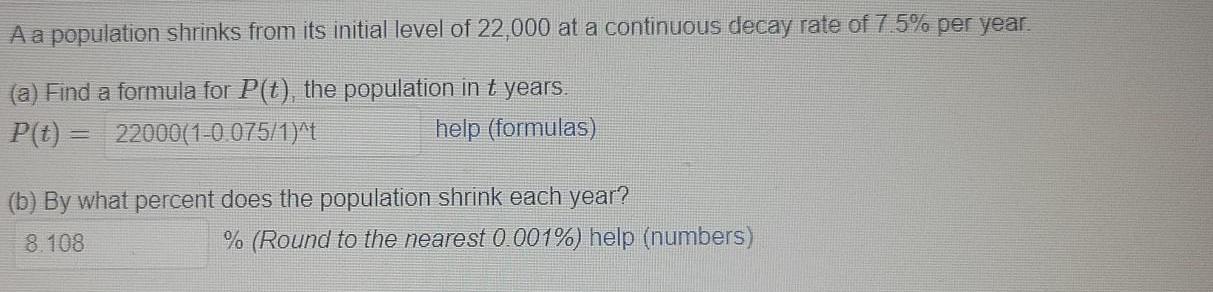
StatisticsA a population shrinks from its initial level of 22,000 at a continuous decay rate of 7.5% per year.
(a) Find a formula for P(t), the population in t years.
P(t)=
(b) By what percent does the population shrink each year?
% (Round to the nearest 0.001%) help (numbers)
Math
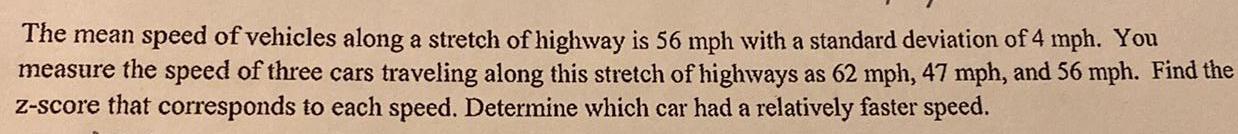
StatisticsThe mean speed of vehicles along a stretch of highway is 56 mph with a standard deviation of 4 mph. You measure the speed of three cars traveling along this stretch of highways as 62 mph, 47 mph, and 56 mph. Find the z-score that corresponds to each speed. Determine which car had a relatively faster speed.
Math
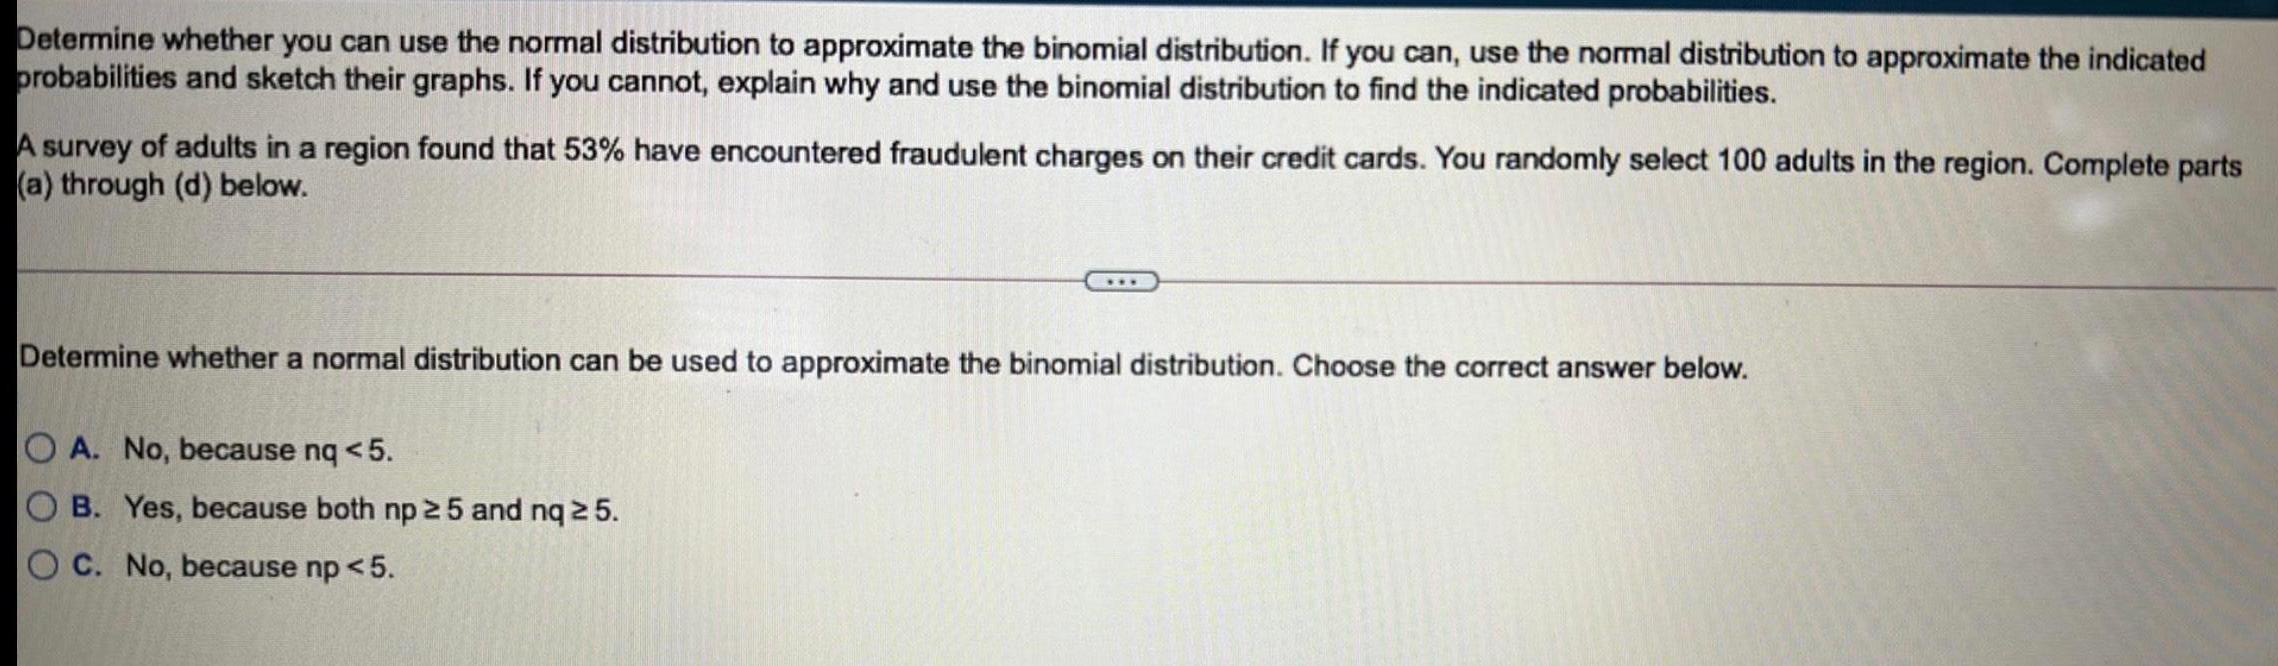
StatisticsDetermine whether you can use the normal distribution to approximate the binomial distribution. If you can, use the normal distribution to approximate the indicated probabilities and sketch their graphs. If you cannot, explain why and use the binomial distribution to find the indicated probabilities.
A survey of adults in a region found that 53% have encountered fraudulent charges on their credit cards. You randomly select 100 adults in the region. Complete parts
(a) through (d) below.
Determine whether a normal distribution can be used to approximate the binomial distribution. Choose the correct answer below.
A. No, because nq <5.
B. Yes, because both np ≤25 and nq ≤25.
C. No, because np < 5.
Math
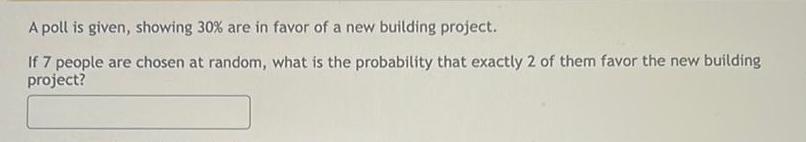
StatisticsA poll is given, showing 30% are in favor of a new building project. If 7 people are chosen at random, what is the probability that exactly 2 of them favor the new building project?
Math
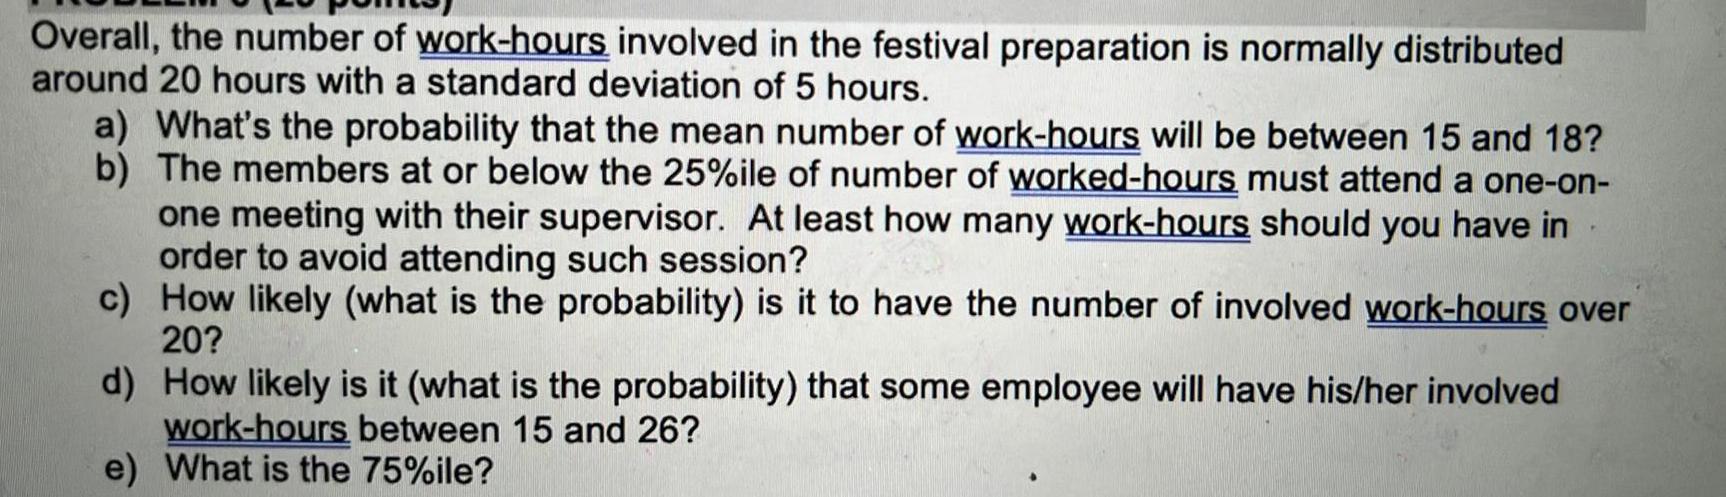
StatisticsOverall, the number of work-hours involved in the festival preparation is normally distributed around 20 hours with a standard deviation of 5 hours.
a) What's the probability that the mean number of work-hours will be between 15 and 18?
b) The members at or below the 25%ile of number of worked-hours must attend a one-on- one meeting with their supervisor. At least how many work-hours should you have in order to avoid attending such session?
c) How likely (what is the probability) is it to have the number of involved work-hours over 20?
d) How likely is it (what is the probability) that some employee will have his/her involved work-hours between 15 and 26?
e) What is the 75%ile?
Math
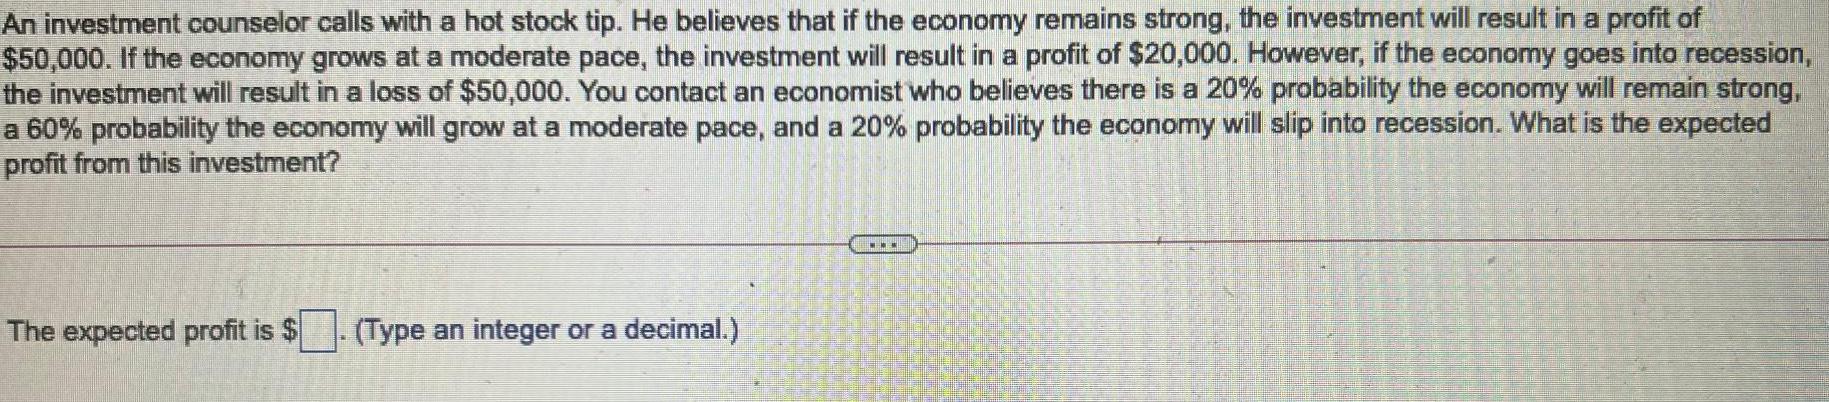
StatisticsAn investment counselor calls with a hot stock tip. He believes that if the economy remains strong, the investment will result in a profit of $50,000. If the economy grows at a moderate pace, the investment will result in a profit of $20,000. However, if the economy goes into recession, the investment will result in a loss of $50,000. You contact an economist who believes there is a 20% probability the economy will remain strong, a 60% probability the economy will grow at a moderate pace, and a 20% probability the economy will slip into recession. What is the expected profit from this investment?
Math
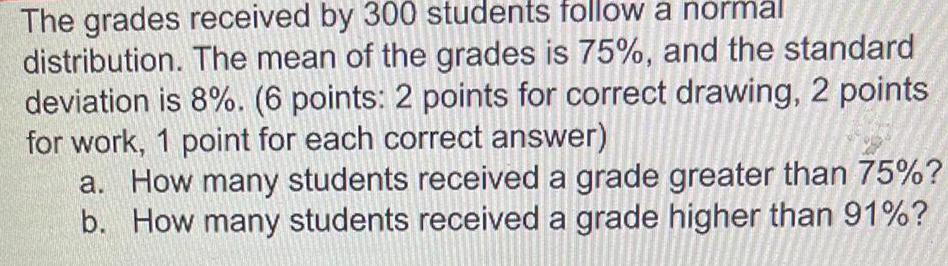
StatisticsThe grades received by 300 students follow a normal
distribution. The mean of the grades is 75%, and the standard
deviation is 8%. (6 points: 2 points for correct drawing, 2 points
for work, 1 point for each correct answer)
a. How many students received a grade greater than 75%?
b. How many students received a grade higher than 91%?
Math
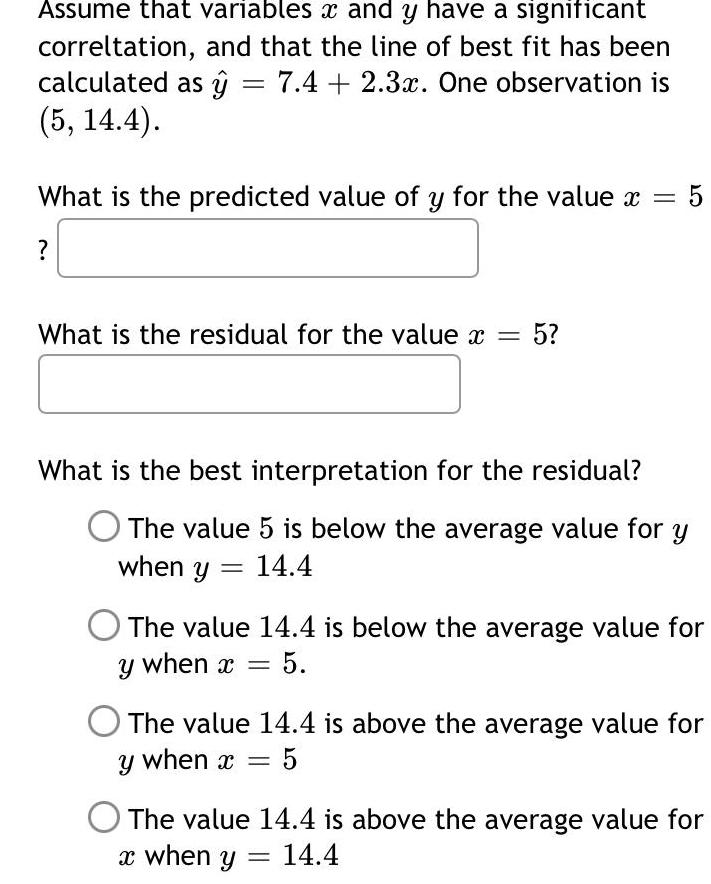
StatisticsAssume that variables x and y have a significant and that the line of best fit has been as y 7.4 2.3x. One observation is = correltation, calculated (5, 14.4).
What is the predicted value of y for the value x = 5?
What is the residual for the value x = 5?
What is the best interpretation for the residual?
The value 5 is below the average value for y when y = 14.4
The value 14.4 is below the average value for y when x = 5.
The value 14.4 is above the average value for y when x = 5
The value 14.4 is above the average value for x when y = 14.4
Math
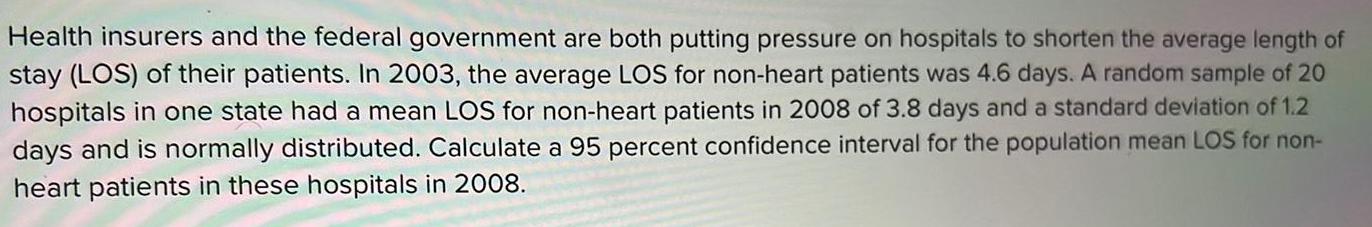
StatisticsHealth insurers and the federal government are both putting pressure on hospitals to shorten the average length of stay (LOS) of their patients. In 2003, the average LOS for non-heart patients was 4.6 days. A random sample of 20 hospitals in one state had a mean LOS for non-heart patients in 2008 of 3.8 days and a standard deviation of 1.2 days and is normally distributed. Calculate a 95 percent confidence interval for the population mean LOS for non- heart patients in these hospitals in 2008.
Math
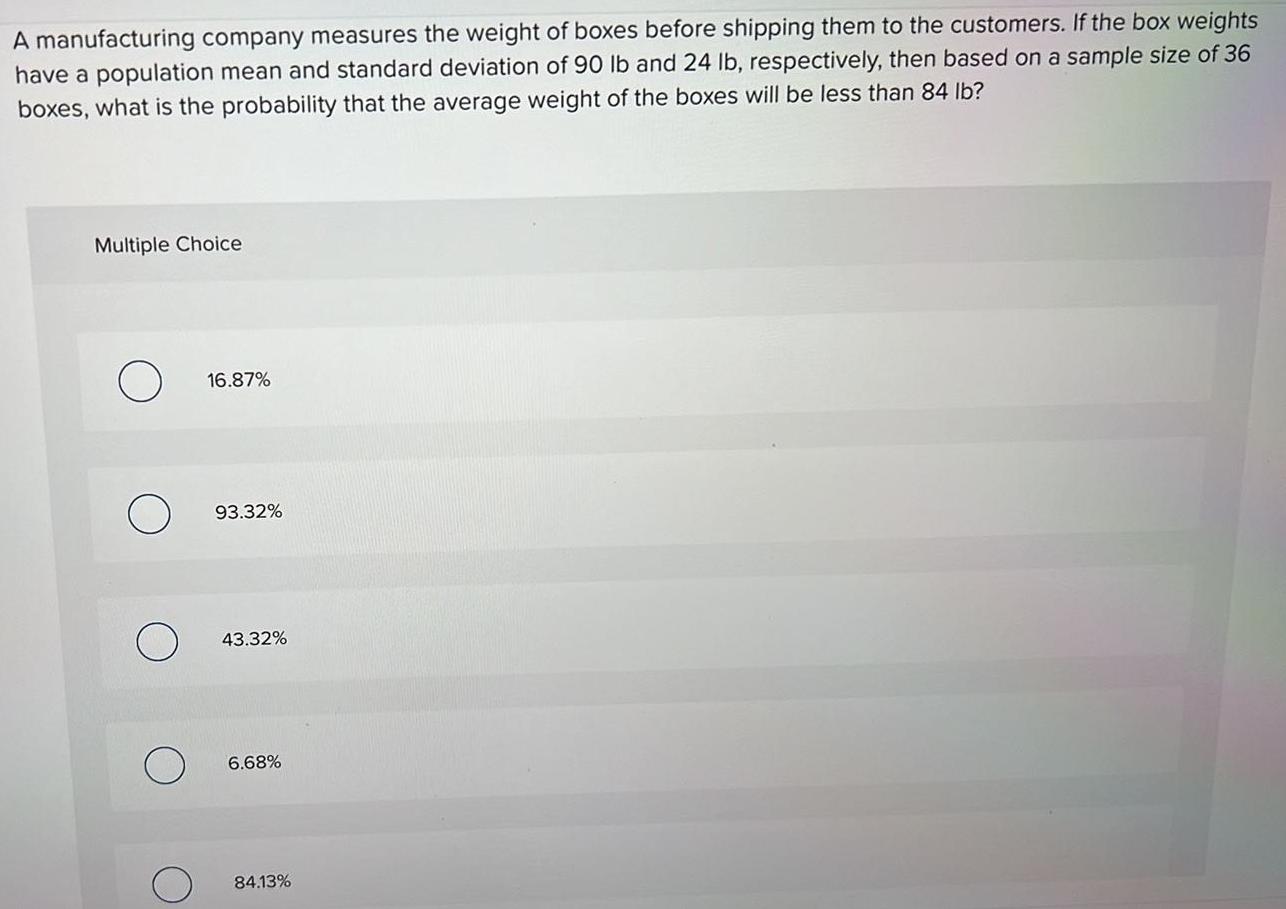
StatisticsA manufacturing company measures the weight of boxes before shipping them to the customers. If the box weights have a population mean and standard deviation of 90 lb and 24 lb, respectively, then based on a sample size of 36 boxes, what is the probability that the average weight of the boxes will be less than 84 lb?
16.87%
93.32%
43.32%
6.68%
84.13%
Math
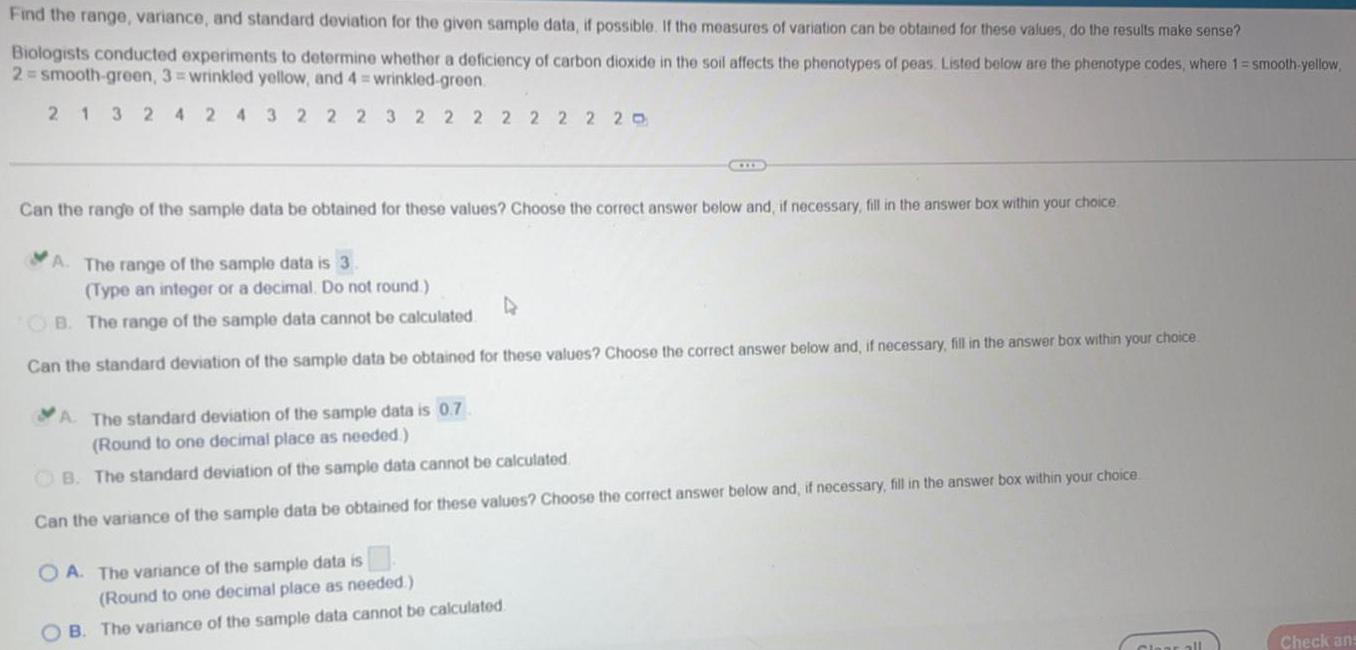
StatisticsFind the range, variance, and standard deviation for the given sample data, if possible. If the measures of variation can be obtained for these values, do the results make sense? Biologists conducted experiments to determine whether a deficiency of carbon dioxide in the soil affects the phenotypes of peas. Listed below are the phenotype codes, where 1-smooth-yellow, 2=smooth-green, 3= wrinkled yellow, and 4 = wrinkled-green
2 1 3 2 4 2 4 3 2 2 2 3 2 2 2 2 2 2 2 20
Can the range of the sample data be obtained for these values? Choose the correct answer below and, if necessary, fill in the answer box within your choice.
A. The range of the sample data is 3. (Type an integer or a decimal. Do not round) 4
B. The range of the sample data cannot be calculated.
Can the standard deviation of the sample data be obtained for these values? Choose the correct answer below and, if necessary, fill in the answer box within your choice. ID
A. The standard deviation of the sample data is 0.7 (Round to one decimal place as needed.)
B. The standard deviation of the sample data cannot
Can the variance of the sample data be obtained for these values? Choose the correct answer below and, if necessary, fill in the answer box within your choice.
A. The variance of the sample data is calculated (Round to one decimal place as needed.)
B. The variance of the sample data cannot be calculated. Clear all Check ans
Math
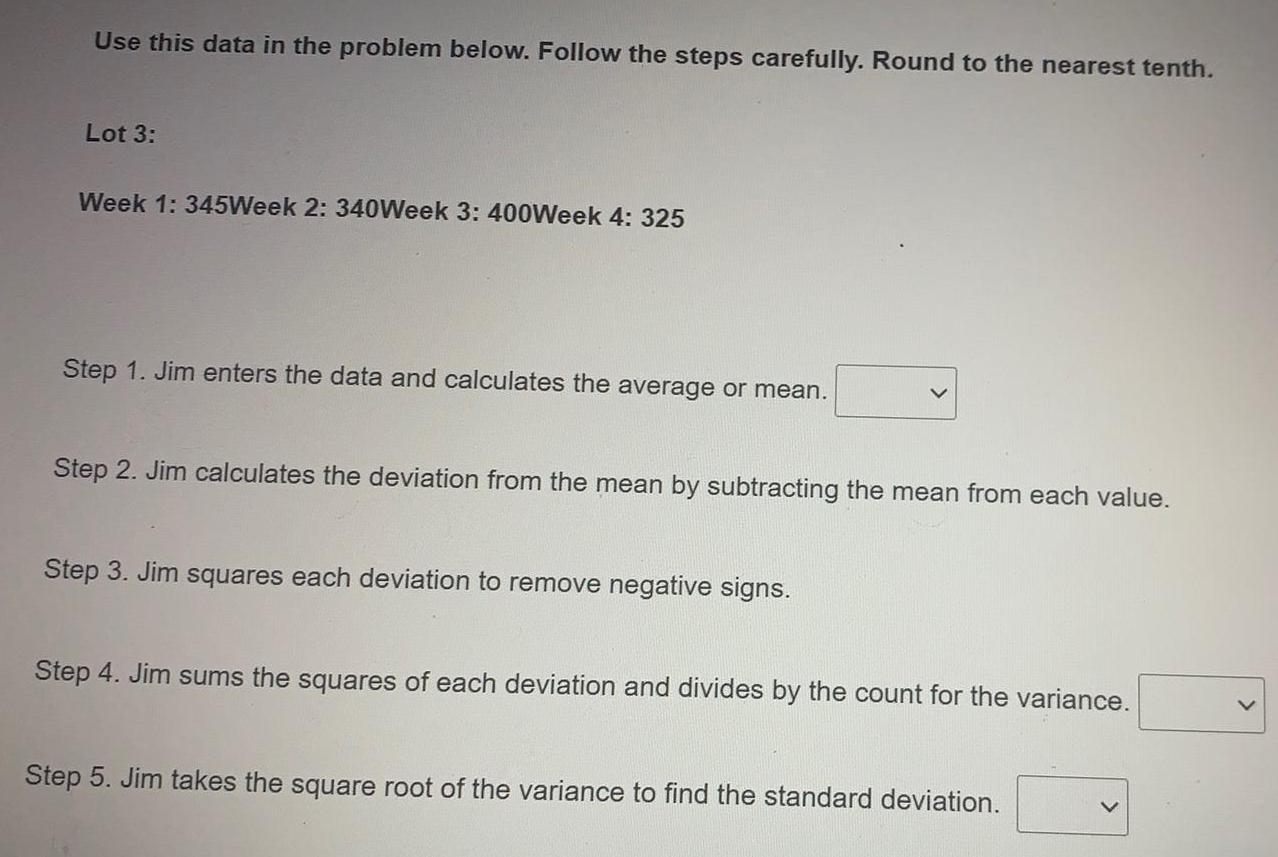
StatisticsUse this data in the problem below. Follow the steps carefully. Round to the nearest tenth.
Lot 3:
Week 1: 345Week 2: 340Week 3: 400Week 4: 325
Step 1. Jim enters the data and calculates the average or mean.
Step 2. Jim calculates the deviation from the mean by subtracting the mean from each value.
Step 3. Jim squares each deviation to remove negative signs.
Step 4. Jim sums the squares of each deviation and divides by the count for the variance.
Step 5. Jim takes the square root of the variance to find the standard deviation.
Math
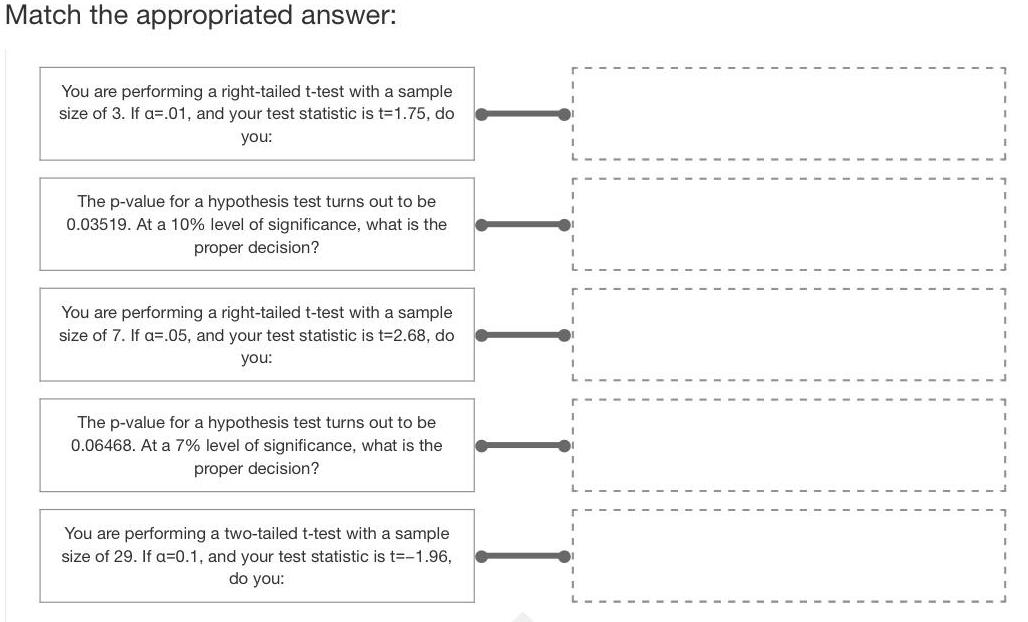
StatisticsMatch the appropriated answer:
You are performing a right-tailed t-test with a sample size of 3. If a=.01, and your test statistic is t-1.75, do you:
The p-value for a hypothesis test turns out to be 0.03519. At a 10% level of significance, what is the proper decision?
You are performing a right-tailed t-test with a sample size of 7. If a=.05, and your test statistic is t-2.68, do you:
The p-value for a hypothesis test turns out to be 0.06468. At a 7% level of significance, what is the proper decision?
You are performing a two-tailed t-test with a sample size of 29. If a=0.1, and your test statistic is t=-1.96, do you:
Math
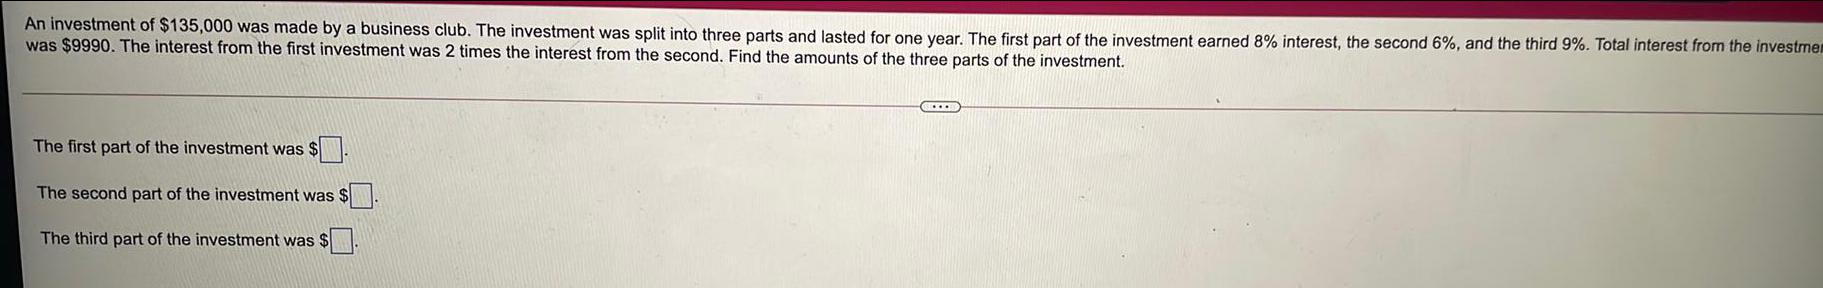
StatisticsAn investment of $135,000 was made by a business club. The investment was split into three parts and lasted for one year. The first part of the investment earned 8% interest, the second 6%, and the third 9%. Total interest from the investment was $9990. The interest from the first investment was 2 times the interest from the second. Find the amounts of the three parts of the investment.
Math
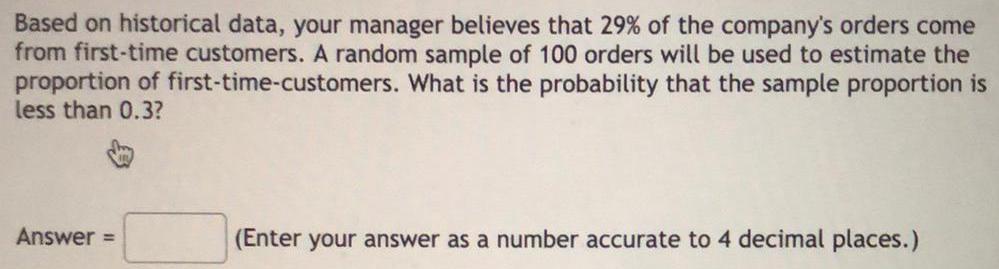
StatisticsBased on historical data, your manager believes that 29% of the company's orders come from first-time customers. A random sample of 100 orders will be used to estimate the proportion of first-time-customers. What is the probability that the sample proportion is less than 0.3?
Math
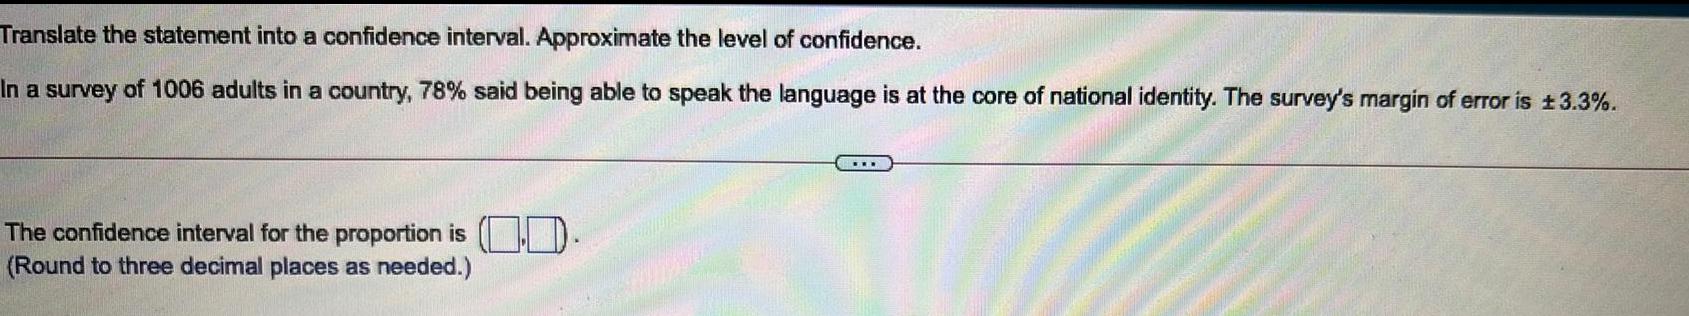
StatisticsTranslate the statement into a confidence interval. Approximate the level of confidence.
In a survey of 1006 adults in a country, 78% said being able to speak the language is at the core of national identity. The survey's margin of error is ±3.3%.
The confidence interval for the proportion is 0.
(Round to three decimal places as needed.)
Math
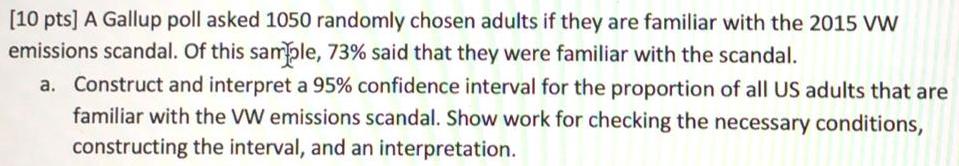
StatisticsA Gallup poll asked 1050 randomly chosen adults if they are familiar with the 2015 VW emissions scandal. Of this sample, 73% said that they were familiar with the scandal.
a. Construct and interpret a 95% confidence interval for the proportion of all US adults that are familiar with the VW emissions scandal. Show work for checking the necessary conditions, constructing the interval, and an interpretation.
Math
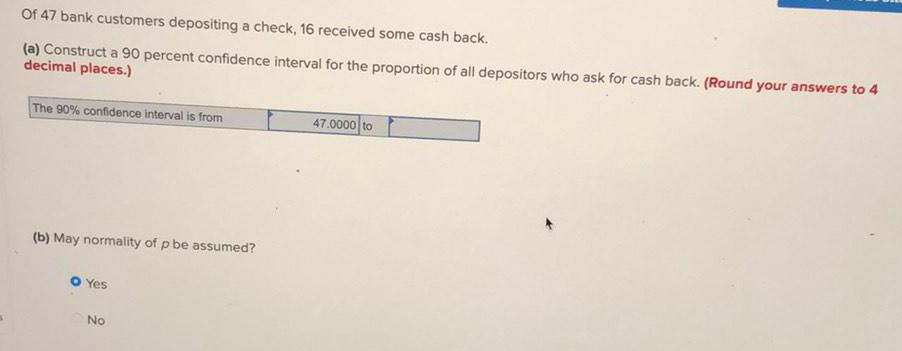
StatisticsOf 47 bank customers depositing a check, 16 received some cash back.
(a) Construct a 90 percent confidence interval for the proportion of all depositors who ask for cash back. (Round your answers to 4 decimal places.)
The 90% confidence interval is from
(b) May normality of p be assumed?
Yes
No
Math
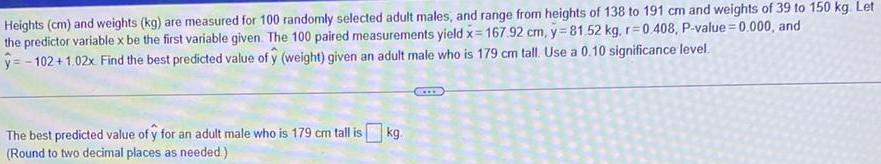
StatisticsHeights (cm) and weights (kg) are measured for 100 randomly selected adult males, and range from heights of 138 to 191 cm and weights of 39 to 150 kg. Let the predictor variable x be the first variable given. The 100 paired measurements yield x= 167.92 cm, y=81.52 kg, r=0.408, P-value=0.000, and y=-102 +1.02x Find the best predicted value of y (weight) given an adult male who is 179 cm tall. Use a 0.10 significance level.

Math
StatisticsA restaurant purchased kitchen equipment on January 1, 2017. On January 1, 2019, the value of the equipment was $14,600. The value after that date was modeled as follows.
V(t) = 14,600 e^- 0.158t
a) What is the rate of change in the value of the equipment on January 1, 2019?
b) What was the original value of the equipment on January 1, 2017?
Math
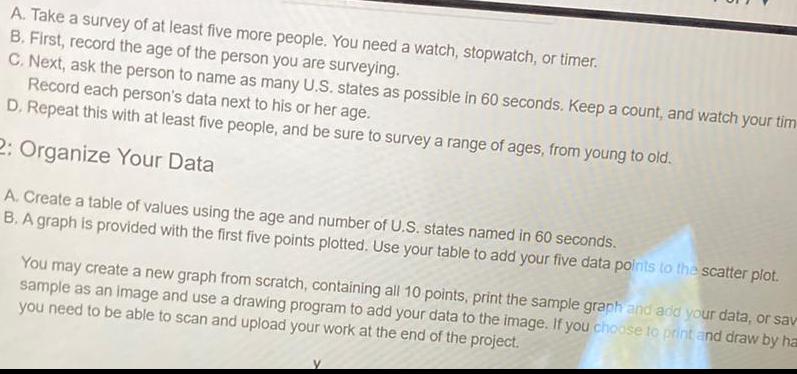
StatisticsA. Take a survey of at least five more people. You need a watch, stopwatch, or timer.
B. First, record the age of the person you are surveying.
C. Next, ask the person to name as many U.S. states as possible in 60 seconds. Keep a count, and watch your time. Record each person's data next to his or her age.
D. Repeat this with at least five people, and be sure to survey a range of ages, from young to old.
2: Organize Your Data
A. Create a table of values using the age and number of U.S. states named in 60 seconds.
B. A graph is provided with the first five points plotted. Use your table to add your five data points to the scatter plot.
You may create a new graph from scratch, containing all 10 points, print the sample graph and add your data, or save sample as an image and use a drawing program to add your data to the image. If you choose to print and draw by ha you need to be able to scan and upload your work at the end of the project.
Math
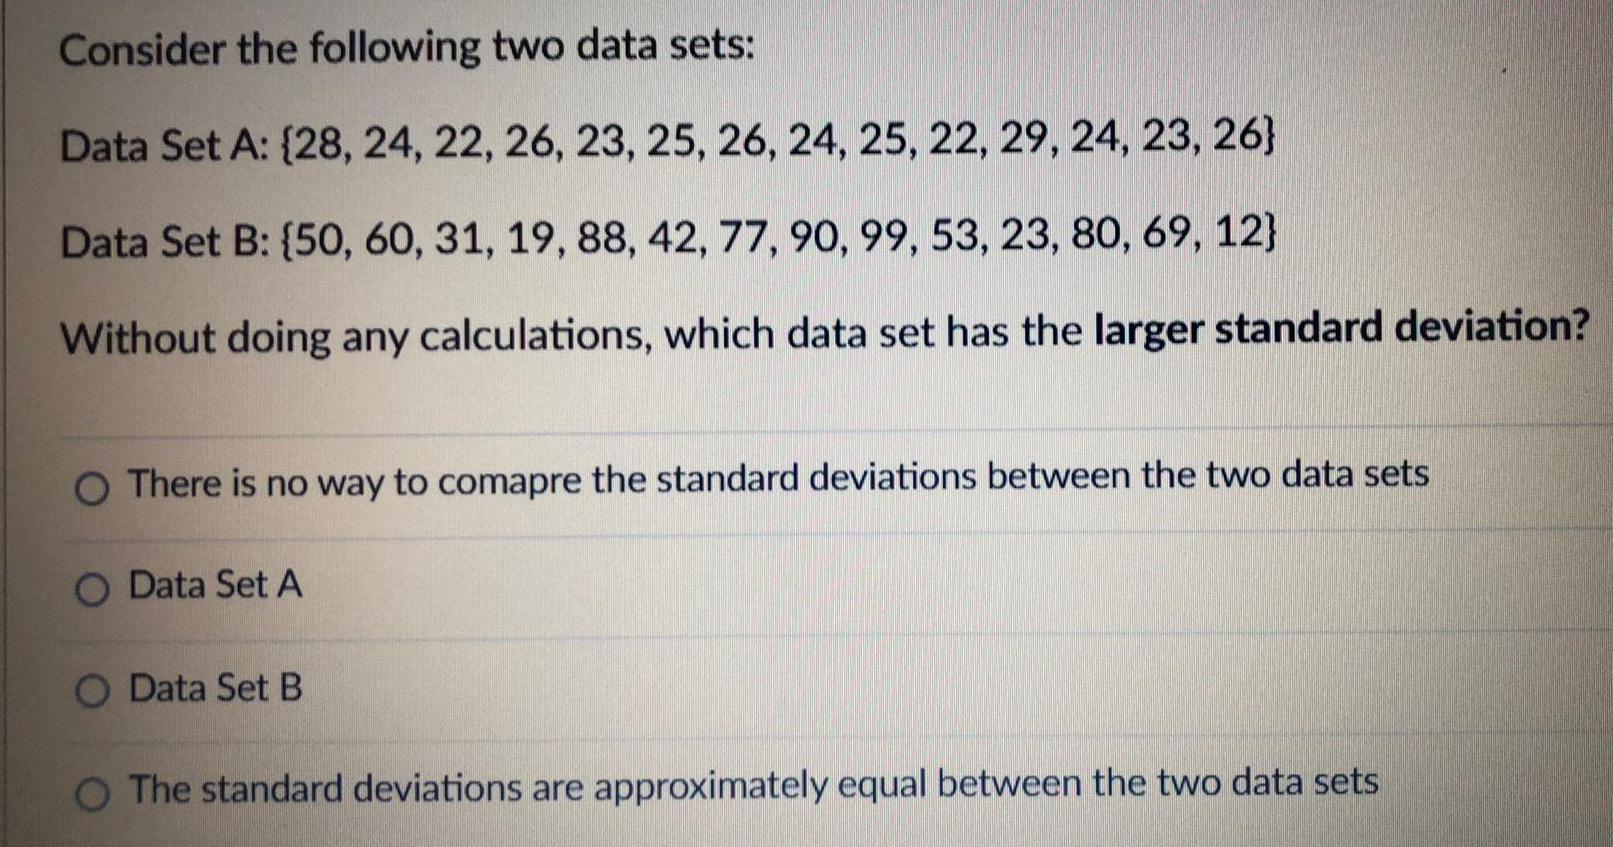
StatisticsConsider the following two data sets:
Data Set A: {28, 24, 22, 26, 23, 25, 26, 24, 25, 22, 29, 24, 23, 26}
Data Set B: {50, 60, 31, 19, 88, 42, 77, 90, 99, 53, 23, 80, 69, 12}
Without doing any calculations, which data set has the larger standard deviation?
There is no way to comapre the standard deviations between the two data sets
Data Set A
Data Set B
The standard deviations are approximately equal between the two data sets
Math
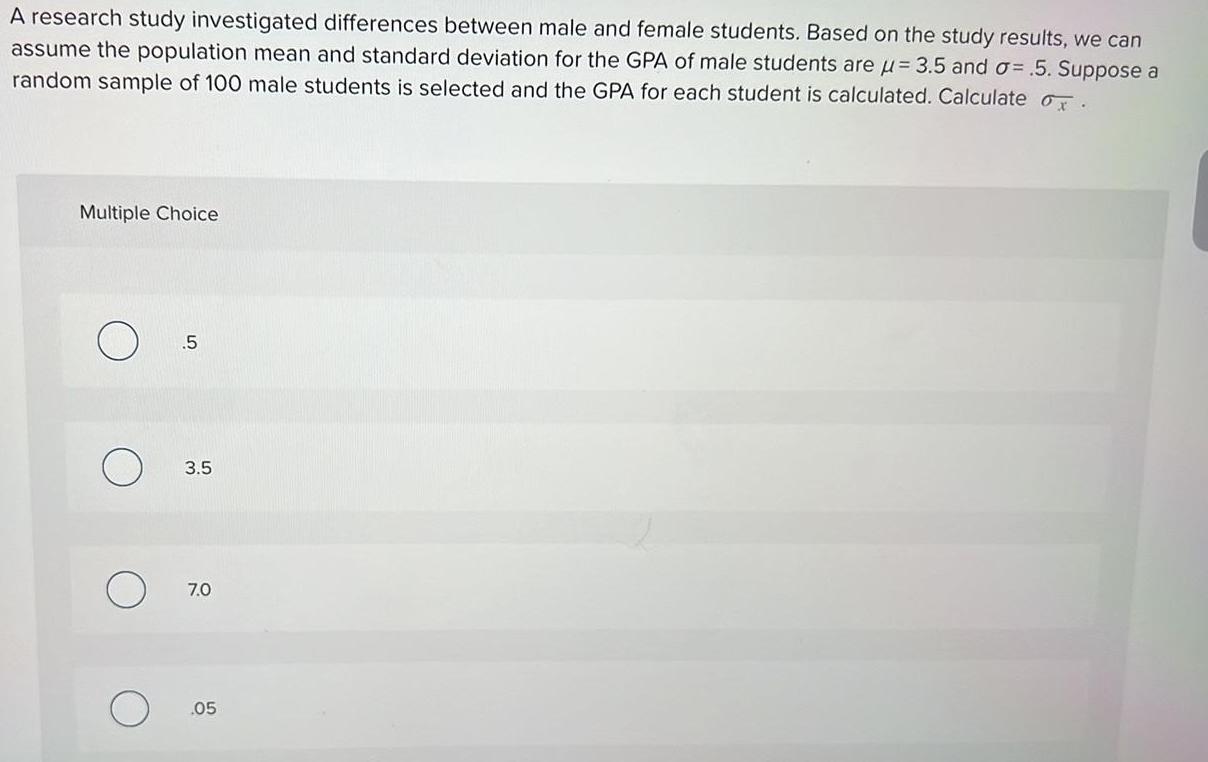
StatisticsA research study investigated differences between male and female students. Based on the study results, we can assume the population mean and standard deviation for the GPA of male students are μ = 3.5 and o= .5. Suppose a random sample of 100 male students is selected and the GPA for each student is calculated.Calculate o x .
.5
3.5
7.0
.05
Math
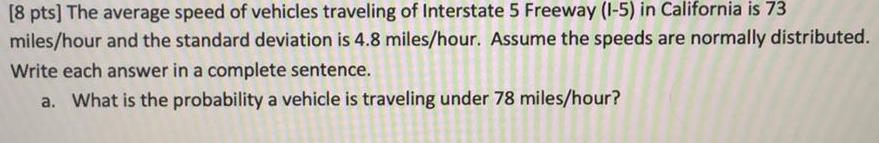
StatisticsThe average speed of vehicles traveling of Interstate 5 Freeway (I-5) in California is 73 miles/hour and the standard deviation is 4.8 miles/hour. Assume the speeds are normally distributed.
Write each answer in a complete sentence.
a. What is the probability a vehicle is traveling under 78 miles/hour?
Math
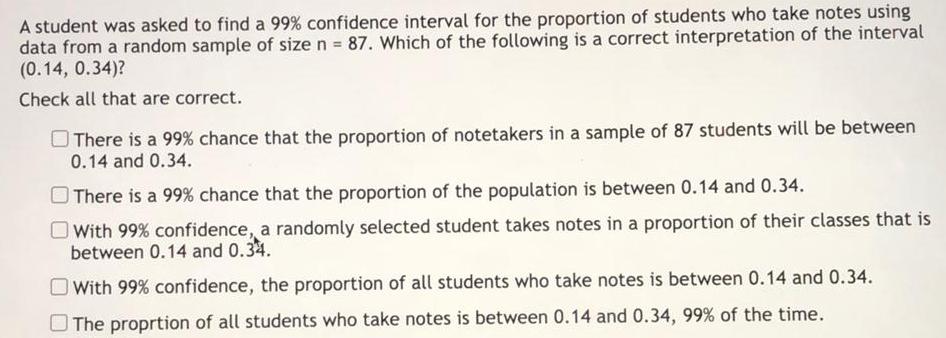
StatisticsA student was asked to find a 99% confidence interval for the proportion of students who take notes using data from a random sample of size n = 87. Which of the following is a correct interpretation of the interval (0.14, 0.34)?
Check all that are correct.
There is a 99% chance that the proportion of notetakers in a sample of 87 students will be between 0.14 and 0.34.
There is a 99% chance that the proportion of the population is between 0.14 and 0.34.
With 99% confidence, a randomly selected student takes notes in a proportion of their classes that is between 0.14 and 0.34.
With 99% confidence, the proportion of all students who take notes is between 0.14 and 0.34.
The proprtion of all students who take notes is between 0.14 and 0.34, 99% of the time.
Math
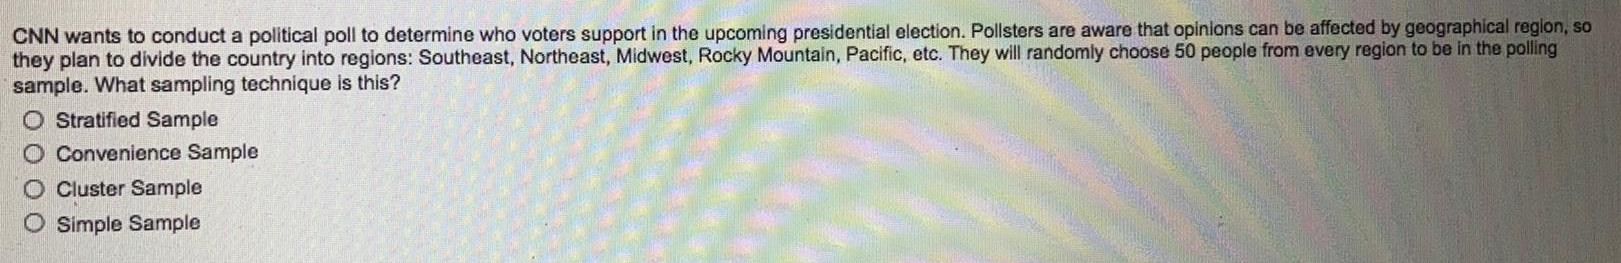
StatisticsCNN wants to conduct a political poll to determine who voters support in the upcoming presidential election. Pollsters are aware that opinions can be affected by geographical region, so they plan to divide the country into regions: Southeast, Northeast, Midwest, Rocky Mountain, Pacific, etc. They will randomly choose 50 people from every region to be in the polling sample. What sampling technique is this?
Stratified Sample
Convenience Sample
Cluster Sample
Simple Sample
Math
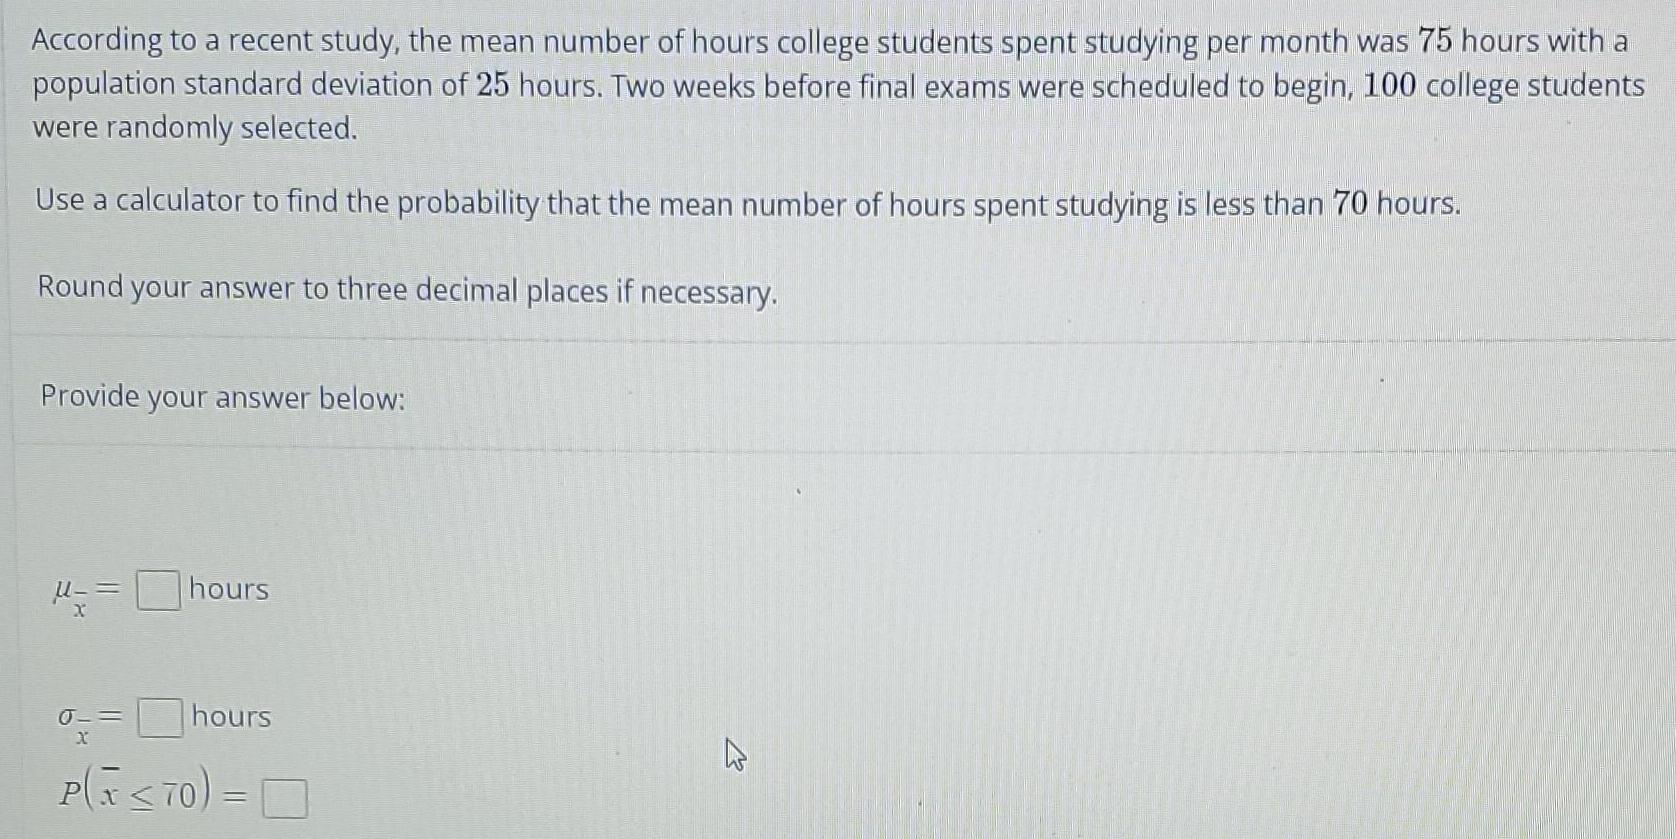
StatisticsAccording to a recent study, the mean number of hours college students spent studying per month was 75 hours with a population standard deviation of 25 hours. Two weeks before final exams were scheduled to begin, 100 college students were randomly selected.
Use a calculator to find the probability that the mean number of hours spent studying is less than 70 hours.
Round your answer to three decimal places if necessary.
Provide your answer below:
µx=
σx=
P(X<70) =
Math
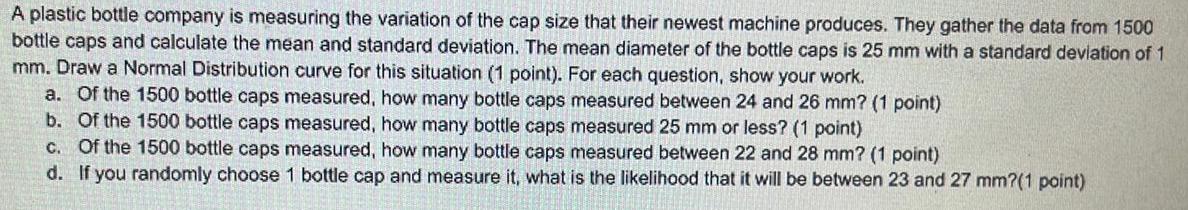
StatisticsA plastic bottle company is measuring the variation of the cap size that their newest machine produces. They gather the data from 1500 bottle caps and calculate the mean and standard deviation. The mean diameter of the bottle caps is 25 mm with a standard deviation of 1 mm. Draw a Normal Distribution curve for this situation (1 point). For each question, show your work.
a. Of the 1500 bottle caps measured, how many bottle caps measured between 24 and 26 mm? (1 point)
b. Of the 1500 bottle caps measured, how many bottle caps measured 25 mm or less? (1 point)
c. Of the 1500 bottle caps measured, how many bottle caps measured between 22 and 28 mm? (1 point)
d. If you randomly choose 1 bottle cap and measure it, what is the likelihood that it will be between 23 and 27 mm?(1 point)
Math
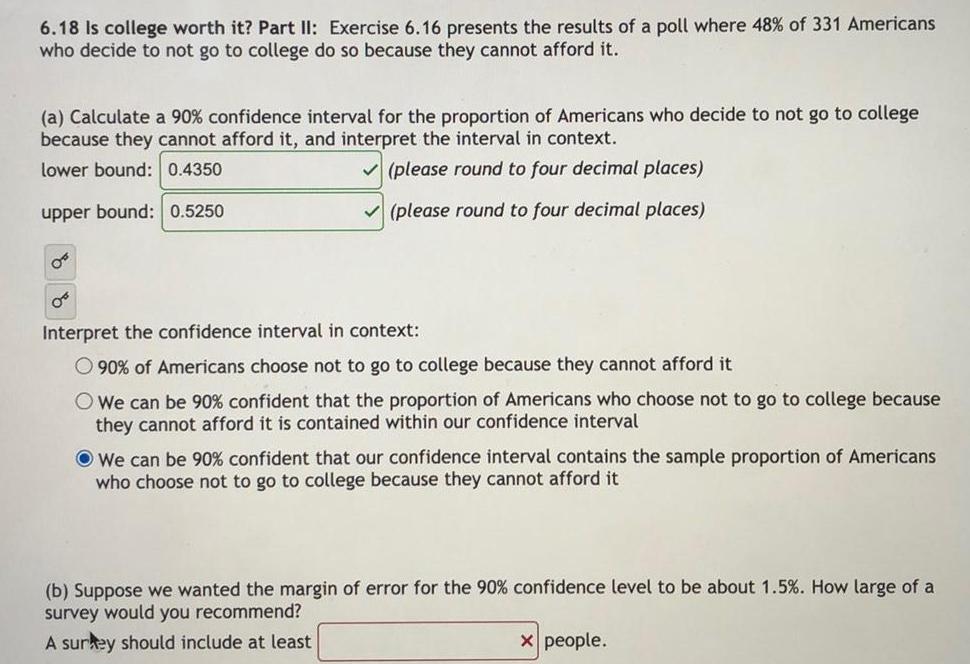
StatisticsExercise 6.16 presents the results of a poll where 48% of 331 Americans who decide to not go to college do so because they cannot afford it.
(a) Calculate a 90% confidence interval for the proportion of Americans who decide to not go to college because they cannot afford it, and interpret the interval in context.
lower bound:
upper bound:
Interpret the confidence interval in context:
90% of Americans choose not to go to college because they cannot afford it
We can be 90% confident that the proportion of Americans who choose not to go to college because they cannot afford it is contained within our confidence interval
We can be 90% confident that our confidence interval contains the sample proportion of Americans who choose not to go to college because they cannot afford it
(b) Suppose we wanted the margin of error for the 90% confidence level to be about 1.5%. How large of a survey would you recommend?
Math
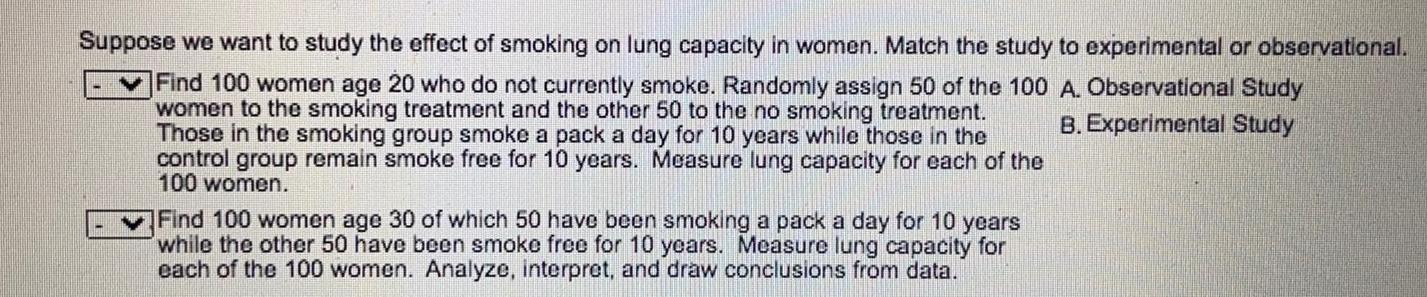
StatisticsSuppose we want to study the effect of smoking on lung capacity in women. Match the study to experimental or observational.
Find 100 women age 20 who do not currently smoke. Randomly assign 50 of the 100 women to the smoking treatment and the other 50 to the no smoking treatment. Those in the smoking group smoke a pack a day for 10 years while those in the control group remain smoke free for 10 years. Measure lung capacity for each of the 100 women.
Find 100 women age 30 of which 50 have been smoking a pack a day for 10 years while the other 50 have been smoke free for 10 years. Measure lung capacity for each of the 100 women. Analyze, interpret, and draw conclusions from data.
Math
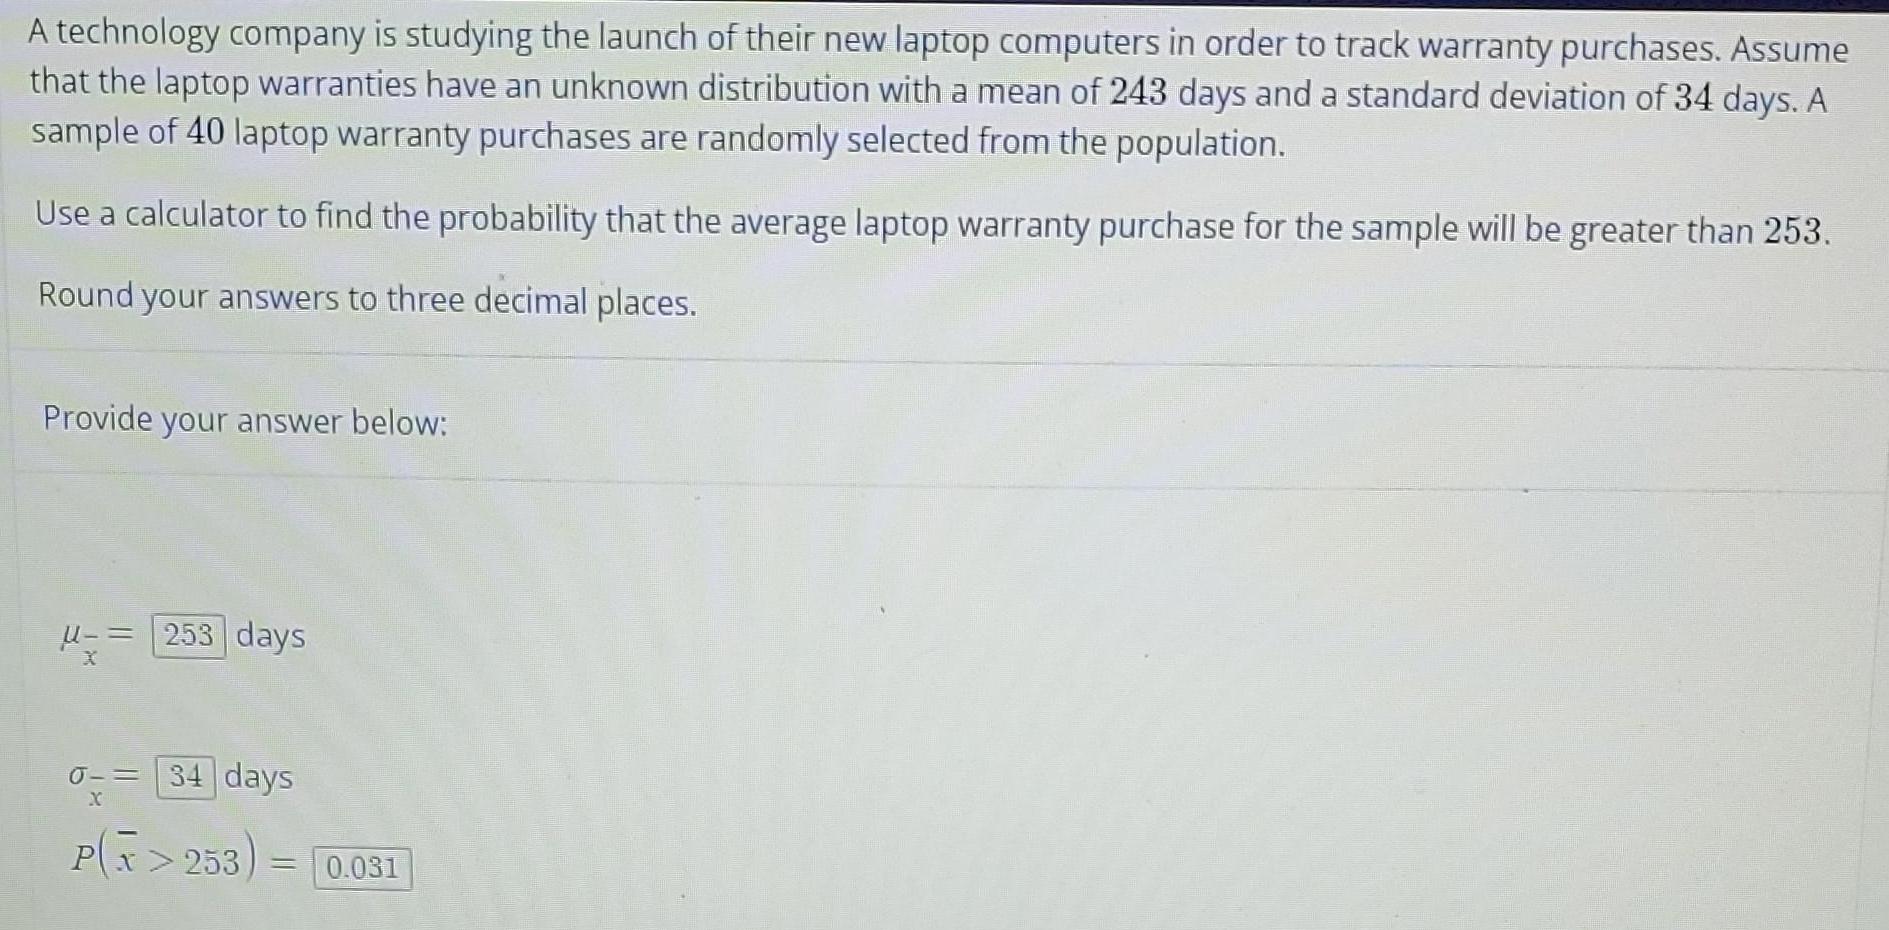
StatisticsA technology company is studying the launch of their new laptop computers in order to track warranty purchases. Assume that the laptop warranties have an unknown distribution with a mean of 243 days and a standard deviation of 34 days. A sample of 40 laptop warranty purchases are randomly selected from the population.
Use a calculator to find the probability that the average laptop warranty purchase for the sample will be greater than 253.
Round your answers to three decimal places.
Provide your answer below:
µx=
σx=
P(x>253) =
Math
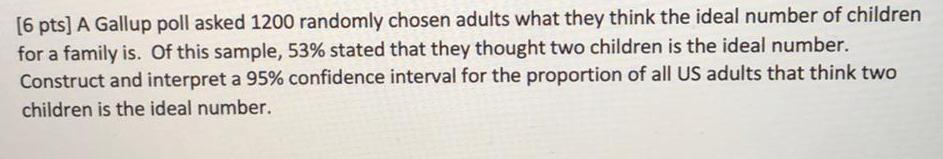
StatisticsA Gallup poll asked 1200 randomly chosen adults what they think the ideal number of children for a family is. Of this sample, 53% stated that they thought two children is the ideal number. Construct and interpret a 95% confidence interval for the proportion of all US adults that think two children is the ideal number.
Math
StatisticsA newsgroup is interested in constructing a 99% confidence interval for the proportion of all Americans who are in favor of a new Green initiative. Of the 518 randomly selected Americans surveyed, 397 were in favor of the initiative.
a. With 99% confidence the proportion of all Americans who favor the new Green initiative is between ... and .... Round to 3 decimal places.
b. If many groups of 518 randomly selected Americans were surveyed, then a different confidence interval would be produced from each group. About ... percent of these confidence intervals will contain the true population proportion of Americans who favor the Green initiative and about ... percent will not contain the true population proportion.

Math
StatisticsTranslate the statement into a confidence interval. Approximate the level of confidence.
In a survey of 1033 parents of children ages 8-14, 73% say they are willing to get a second or part time job to pay for their children's college education and 45% say they lose sleep worrying about college costs. The survey's margin of error is ±2%.
Use the results from the survey about getting a second or part-time job.
Math
StatisticsA researcher wishes to estimate, with 95% confidence, the population proportion of adults who eat fast food four to six times per week. Her estimate must be accurate
within 3% of the population proportion.
(a) No preliminary estimate is available. Find the minimum sample size needed.
(b) Find the minimum sample size needed, using a prior study that found that 22% of the respondents said they eat fast food four to six times per week.
(c) Compare the results from parts (a) and (b).
(a) What is the minimum sample size needed assuming that no prior information is available?
n= (Round up to the nearest whole number as needed.)