Statistics Questions and Answers

Math
StatisticsConsider two normal distributions, one with mean -4 and standard deviation 13, the other with mean 8 and standard deviation
13. Answer the following statements using true or false.
a) The two distributions have the same shape.
answer:
b) The two distributions are centered at the same place.
answer:

Math
Statistics(32,33,35,35,38,41,42,43,46,49)
Calculate the mean absolute deviation for the data set shown above.

Math
StatisticsA family purchased a new ski boat for $22,000. The loan agency required a 15% down payment and they financed the balance with a 60-month fixed installment loan with an APR of 5.5%. Determine the total finance charge and monthly payment for this loan. Round your answers to the nearest cent.
Total Finance Charge:
Monthly Payment:
Math
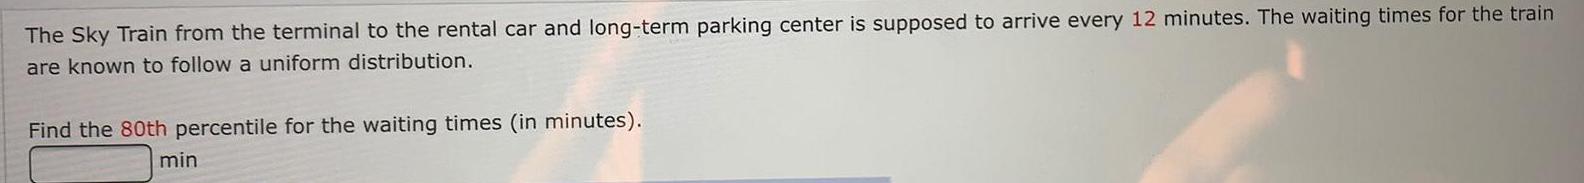
StatisticsThe Sky Train from the terminal to the rental car and long-term parking center is supposed to arrive every 12 minutes. The waiting times for the train
are known to follow a uniform distribution.
Find the 80th percentile for the waiting times (in minutes).
min

Math
StatisticsThe brain volumes (cm³) of 20 brains have a mean of 1076.3 cm3 and a standard deviation of 126.6 cm³. Use
the given standard deviation and the range rule of thumb to identify the limits separating values that are
significantly low or significantly high. For such data, would a brain volume of 1299.5 cm³ be significantly high?

Math
StatisticsTo estimate the accuracy of a laboratory scale, a weight known to have a mass of 98 grams is weighed 32 times. The reading of the scale is recorded each time.
The following MINITAB output presents a 95% confidence interval for the mean reading of the scale.
The assumed standard deviation 2.5000
Variable
Part 1 of 3
Mean
Scale Reading 32 102.3527 2.5000 0.44194 (101.4865, 103.2189)
Part 2 of 3
St Dev
(a) A scientist claims that the mean reading His actually 98 grams. Is it likely that this claim is true?
It is not
likely.
SE Mean
X
95% CI
(b) Find the critical value for a 99% confidence interval.
The critical value is 98

Math
StatisticsWatch your cholesterol: A sample of 290 patients between the ages of 38 and 82 were given a combination of drugs ezetimibe and simvastatin. They
achieved a mean reduction in total cholesterol of 0.81 millimole per liter. Assume the population standard deviation is a=0.16.
Part: 0 / 3
Part 1 of 3
(a) Construct a 95% confidence interval for the mean reduction in total cholesterol in patients who take this combination of drugs. Round the answer to at
least two decimal places.
A 95% confidence interval for the mean reduction in cholesterol is
<μ<0.
X

Math
StatisticsThe total amount paid on a 5 year loan was $16,000. If the interest rate was 7% and compounded semi-annually, what was
the principal? Round your answer to the nearest dollar.

Math
StatisticsTranslate to a system of equations and then solve.
Mitchell left Detroit on the interstate driving south towards Orlando at a speed of 60 miles per hour. Clark left Detroit 1
hour later traveling at a speed of 75 miles per hour, following the same route as Mitchell. How long will it take Clark to catch
Mitchell?
Provide your answer below:

Math
StatisticsStudents in an experimental psychology class did research on depression as a sign of stress. A test was administered to a sample
of 30 students. The scores are shown below.
43 51 11 90 76 35 64 36 42 72 54 62 35 74 51
72 36 28 38 61 49 63
35 41 22 36 51 47 86
35 41 22 36 51 47 86 13
To find the 10% trimmed mean of a data set, order the data, delete the lowest 10% of the entries and the highest 10% of the
entries, and find the mean of the remaining entries. Complete parts (a) through (c).
Man (RUNG to the heart to as t
*****
(c) What is the benefit of using a trimmed mean versus using a mean found using all data entries?
OA. It simply decreases the number of computations in finding the mean.
OB. It eliminates potential outliers that could affect the mean of the entries.
OC. It permits the comparison of the measures of central tendency.
OD. It permits finding the mean of a data set more exactly

Math
StatisticsEighty-four percent of adults in a certain country believe that life on other planets is plausible. You randomly select five adults and
ask them whether they believe that life on other planets is plausible. The random variable represents the number of adults who
believe that life on other planets is plausible. Find the mean, variance, and standard deviation of the binomial distribution for the
random variable. Interpret the results.
Find the mean of the binomial distribution.
p=
(Round to two decimal places as needed.)
*****

Math
StatisticsA survey asks 1500 workers, "Has the economy forced you to reduce the amount of vacation you plan to take this year?"
Forty-one percent of those surveyed say they are reducing the amount of vacation. Twenty workers participating in the survey are
randomly selected. The random variable represents the number of workers who are reducing the amount of vacation. Decide
whether the experiment is a binomial experiment. If it is, identify a success, specify the values of n, p, and q, and list the possible
values of the random variable x.
****
Selecting a worker who is reducing the amount of vacation
O Selecting a worker who is not reducing the amount of vacation
This is not a binomial experiment.
Specify the value of n. Select the correct choice below and fill in any answer boxes in your choice.
OA. n=
OB. This is not a binomial experiment.

Math
StatisticsSample annual salaries (in thousands of dollars) for employees at a company are listed.
53 35 52 49 30 30 53 35 52 33 49 53 45
(a) Find the sample mean and sample standard deviation.
(b) Each employee in the sample is given a 5% raise. Find the sample mean and sample standard deviation for the revised data
set.
(c) To calculate the monthly salary, divide each original salary by 12. Find the sample mean and sample standard deviation for the
revised data set
(d) What can you conclude from the results of (a), (b), and (c)?
(a) The sample mean is x = thousand dollars.
(Round to one decimal place as needed.).
*****

Math
StatisticsIn IQ test was given to a simple random sample of 68 students at a certain college. The sample mean score was 105.6. Scores on this test are known to have a
standard deviation of a=10. It is desired to construct a 90% confidence interval for the mean IQ score of students at this college.
Part: 0 / 6
Part 1 of 6
(a) What is the point estimate?

Math
StatisticsInterpret a confidence interval: A dean at a certain college looked up the GPA for a random sample of 85 students. The sample mean GPA was 2.82, and a 95% confidence interval for the mean GPA of all students in the college was 2.76 <μ<2.88.
Choose the correct interpretation of the confidence interval:
We are 95% confident that the mean GPA of all students in the sample is between 2.76 and 2.88.
We are 95% confident that the mean GPA of all students in the college is between 2.76 and 2.88.
The probability is 0.95 that the mean GPA of all students in the college is between 2.76 and 2.88.
95% of the students in the sample had a GPA between 2.76 and 2.88.

Math
StatisticsWatch your cholesterol: A sample of 310 patients between the ages of 38 and 82 were given a combination of drugs ezetimibe and simvastatin. They
achieved a mean reduction in total cholesterol of 0.93 millimole per liter. Assume the population standard deviation is a 0.17.
Part: 0/3
Part 1 of 3
(a) Construct a 98% confidence interval for the mean reduction in total cholesterol in patients who take this combination of drugs. Round the answer to at
least two decimal places.
A 98% confidence interval for the mean reduction in cholesterol is <μ<
X
Ś

Math
Statistics79% of U.S. adults think that political correctness is a problem in America today. You randomly select six U.S. adults and ask them whether they think that political correctness is a problem in America today. The random variable represents the number of U.S. adults who think that political correctness is a problem in America today. Answer the questions below.
Find the mean of the binomial distribution.
(Round to the nearest tenth as needed.).

Math
StatisticsUse the accompanying data set to complete the following actions.
a. Find the quartiles.
b. Find the interquartile range.
c. Identify any outliers.
61 54 58 63 58 64 63 64 62 58 55 56 55 57 78

Math
Statistics24% of U.S. adults say they are more likely to make purchases during a sales tax holiday. You randomly select 10 adults. Find the
probability that the number of adults who say they are more likely to make purchases during a sales tax holiday is (a) exactly two,
(b) more than two, and (c) between two and five, inclusive.
(a) P(2)=
(Round to the nearest thousandth as needed.)
CO

Math
StatisticsTwenty-eight percent of U.S. employees who are late for work blame oversleeping. You randomly select four U.S. employees who
are late for work and ask them whether they blame oversleeping. The random variable represents the number of U.S. employees
who are late for work and blame oversleeping.
Find the mean of the binomial distribution.
μ= (Round to the nearest hundredth as needed.)
*****

Math
StatisticsFind the probability using the normal distribution: P(-1.36 <z<0). Use
P(-1.36 <z< 0) =
X
The Standard Normal Distribution Table and enter the answer to 4 decimal places.
8
E
K
Math
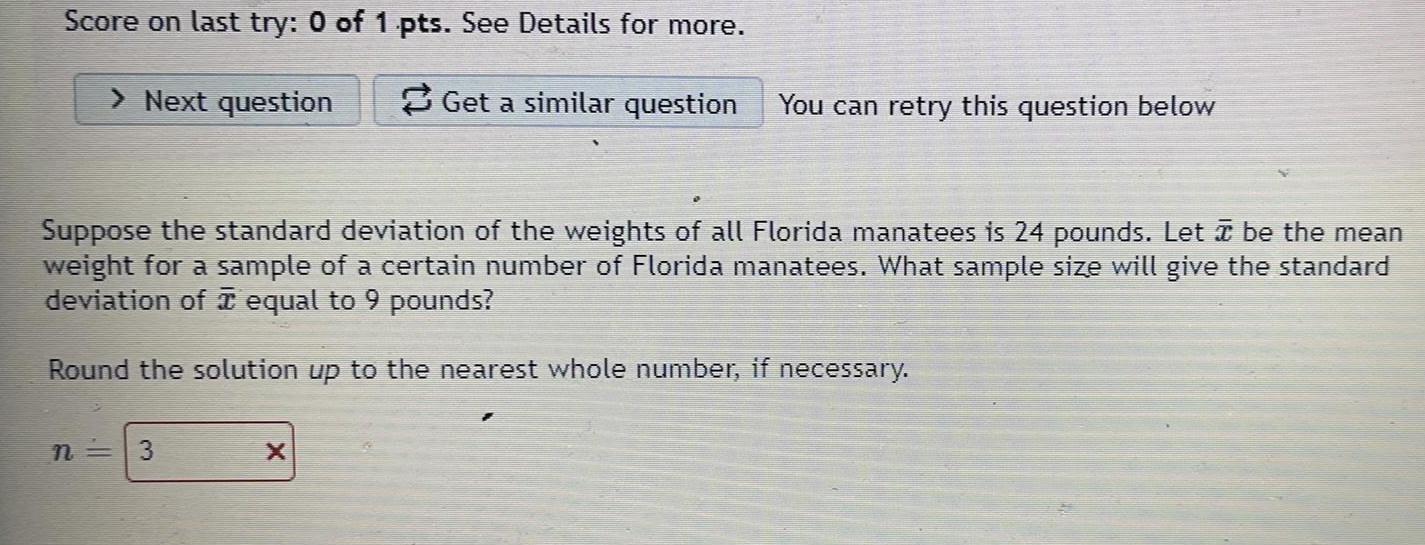
StatisticsSuppose the standard deviation of the weights of all Florida manatees is 24 pounds. Let x be the mean
weight for a sample of a certain number of Florida manatees. What sample size will give the standard
deviation of x equal to 9 pounds?

Math
StatisticsA simple random sample of 16 bicycle helmets had a mean price of x-$38.12. It is reasonable to assume that the population of helmet prices is approximately
normal with population standard deviation a-$7.79. Is it appropriate to use the methods of this section to construct a confidence interval for the mean helmet
price?

Math
StatisticsDetermine the total area under the standard normal curve in parts (a) through (c) below.
(a) Find the area under the normal curve to the left of z= -1 plus the area under the normal curve to the right of z = 1.
The combined area is.

Math
Statistics(a) If $4,500 is invested at 1.55% interest, find the value (in dollars) of the investment at the end of 4 years if the interest is compounded as follows. (Round your answers to the nearest cent.)
(1) annually
$
() quarterly
$
() monthly.
$
(iv) weekly
$
(v) daily
$
(vi) continuously
$
(b) If A(t) is the amount of the investment at time t for the case of continuous compounding, write a differential equation satisfied by A(t). (Let A represent A(t).)
dA
dt
=
Find the initial condition satisfied by A(t).
A(0) =

Math
StatisticsX follows a Binomial probability distribution with parameters n= ___ and p = ___
Complete the notation:
X ~ ___ (___.___)

Math
StatisticsDetermine the effective annual yield for each investment. Then select the better investment. Assume 360 days in a year.
12.5% compounded monthly; 12.75% compounded annually

Math
StatisticsA leading magazine (like Barron's) reported at one time that the average number of weeks an individual is unemployed is 30 weeks. Assume that for the population of all unemployed individuals the population mean length of unemployment is 30 weeks and that the population standard deviation is 4 weeks. Suppose you would like to select a random sample of 65 unemployed individuals for a follow-up study.
Find the probability that a single randomly selected value is greater than 31.
P(X> 31)=
(Enter your answers as numbers accurate to 4 decimal places.)
Find the probability that a sample of size n = 65 is randomly selected with a mean greater than 31.)
P(M>31) =
(Enter your answers as numbers accurate to 4 decimal places.)

Math
StatisticsNimesh is creating a new app for real estate developers to estimate the number of nightclubs in a city. To do this, he samples a number of cities to measure their x= "population" and y="number of nightclubs" and finds a line of best fit y=2.15+0.002x Which of the following is the correct interpretation of the slope term?
For a population increase of 1 person, the number of nightclubs increases by exactly 2
For a population increase of 1 person, the number of nightclubs increases by 2 on average
For a population increase of 1000 people, the number of nightclubs increases by 2 on average
For a population increase of 1000 people, the number of nightclubs increases by exactly 2

Math
StatisticsA set of data has a normal distribution with a mean of 47 and a standard deviation of 8. Find the percent of data within the following interval.
from 39 to 55
The percent of data within the given interval is.
(Type an integer or a decimal.)

Math
StatisticsYou are conducting a study to see if the proportion of voters who prefer Candidate A is significantly less than 0.72. You use a significance level of a = 0.01.
Ho: p = 0.72
HA:P < 0.72
You obtain a sample of size n = 491 in which there are 331 successes.
What is the test statistic for this sample? (Report answer accurate to three decimal places.)
test statistic =
What is the p-value for this sample? (Report answer accurate to four decimal places.)
p-value
Math
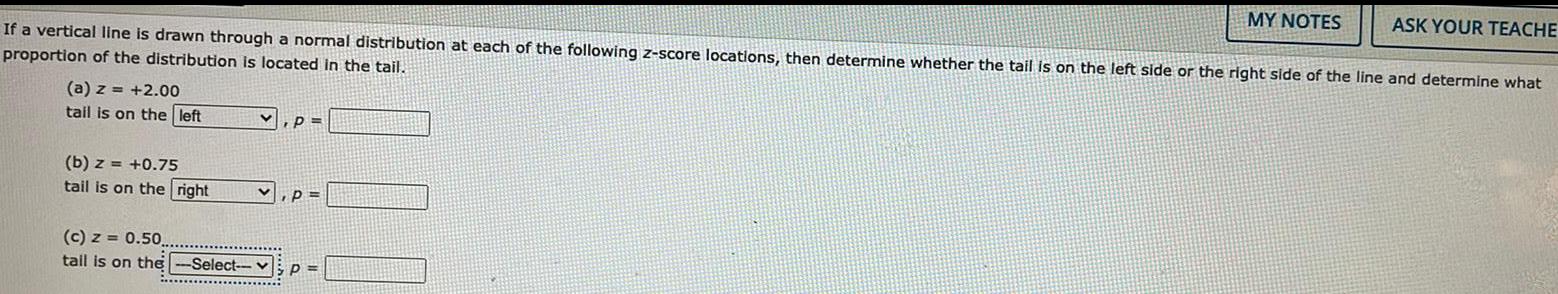
StatisticsIf a vertical line is drawn through a normal distribution at each of the following z-score locations, then determine whether the tail is on the left side or the right side of the line and determine what proportion of the distribution is located in the tail.
(a) z = +2.00
(b) z = +0.75
(c) z = 0.50.

Math
StatisticsFind the minimum, first quartile, median, third quartile, and maximum of the data set below.
4.6 3.2 6.4 5.2 5 4.9 6.2 3.8 12.4
The minimum is. (Type an integer or a decimal.)

Math
StatisticsSarah will collect data to find out where the local Scout troops want to hold their end-of-the-year picnic. Which group should Sarah survey to collect the most accurate result?
The first 10 students to walk into her next scout meeting
A random selection of of Scout troops in her area
All the students at her school
A random selection of members from only her troop

Math
StatisticsSuppose your statistics professor reports test grades as z-scores, and you got a score of 2.50 on an exam.
a) Write a sentence explaining what that means.
b) Your friend got a z-score of -1. If the grades satisfy the Nearly Normal Condition, about what percent of the class scored lower than your friend?

Math
StatisticsPeople with z-scores of 2.5 or above on a certain aptitude test are sometimes classified as geniuses. If aptitude test scores have a mean of 100 and a standard deviation of 30 points, what is the minimum aptitude test score needed to be considered a genius?

Math
StatisticsStudents in a class were asked how many pets they had at home. Their answers are given below.
0, 0, 0, 0, 2, 2, 2, 2, 3, 3, 4, 5, 6, 6, 6, 6, 7, 7, 7, 7, 7, 8, 8, 8, 8
According to the data above, what is the value of quartile one?

Math
StatisticsType I error occurs when
null hypothesis is not correct, but we accept it
null hypothesis is not correct, and we reject it
null hypothesis is correct, and we accept it
null hypothesis is correct, but we reject it

Math
StatisticsThe trade magazine QSR routinely checks the drive-through service times of fast-food restaurants. An 80% confidence interval that results from examining 580 customers in Taco Bell's drive-through has a lower bound of 170.8 seconds and an upper bound of 174.6 seconds. Complete parts (a) through (c).
(a) What is the mean service time from the 580 customers?

Math
StatisticsList five properties of the F-distribution. The F-distribution is a family of curves, each of which is determined by two types of degrees of freedom: the degrees of freedom corresponding to the variance in the numerator, denoted by d.f.N, and the degrees of freedom corresponding to the variance in the denominator, denoted by d.f.p. Determine the second of the five properties. The F-distribution is positively skewed and therefore the distribution is not symmetric. Determine the third of the five properties. The total area under each F-distribution curve is equal to 1. (Type an integer or a decimal.) Determine the fourth of the five properties. Choose the correct answer below.
A. All values of F are greater than or equal to 0.
B. All values of F are between 1 and 1.
C. All values of F are between 0 and 1.
D. All values of F are less than or equal to 0.

Math
StatisticsTeam A and B love to play pickup basketball. There are no fouls and no three-pointers, so all shots are worth 2 points.
The only problem is Team A always wins. They typically play games to 100 and Team B loses by 10 points. That is, the typical final score is Team A 100, Team B 90.
So, they decide to increase the point value of each basket for Team B to 2.2 points. Based on the typical results above, what effect is this most likely to have?
The teams will tend to score the exact same number of points.
Team A will still tend to win, by 1 point instead of 10.
Team B will now tend to win by a margin of 1 point.
Team B will now tend to win by 10 points.

Math
StatisticsThe manager of a movie theater analyzed her popcorn sales (x) and beverage sales (y) and found a weak positive correlation. What does this mean?
O As the number of bags of popcorn sold increases, the number of beverages sold also tends to increase.
O As the number of bags of popcorn sold increases, the number of beverages sold also tends to decrease.
O Buying bags of popcorn causes moviegoers to buy beverages.
O Every moviegoer who bought a bag of popcorn also bought a beverage.

Math
Statistics3) Jack has $400 and is going to start saving $30 per week. Sally has $225 and is going to start saving $55 per week. How many weeks will it take for them to have the same amount? How much money will they both have?

Math
StatisticsThe amounts of electricity bills for all households in a city have a skewed probability distribution with a mean of $137 and a standard
deviation of $30. Find the probability that the mean amount of electric bills for a random sample of 75 households selected from this
city will be within $6 of the population mean.
Round your answer to four decimal places.
P(x within $6 of u) =

Math
StatisticsA five digit number (having all different digits) is formed using the digits 1, 2, 3, 4, 5, 6, 7, 8 and 9. The probability that the formed number either begins or ends with an odd digit, is equal to

Math
StatisticsIdentify the explanatory variable and the response variable.
A teacher wants to determine if the teaching method used by her students can be used to predict the students' test scores.
The explanatory variable is the
The response variable is the

Math
StatisticsA certain experiment produces the data (3,7.6), (4,5.6), and (5,-0.5). Describe the model that produces a least-squares fit of these points by a function of the form
y= A cos x + B sin x.

Math
StatisticsLast year's report found that of the 30,215 students at a college, 8,913 had not taken a foreign language. A researcher believes this proportion has decreased this year and decides to test her hypothesis with a significance level of 0.01. From a sample of 120 students at a college she found 37 who had not taken a foreign language. Match the symbol to its value (or to its approximate value).
1. P 0.2950
2. Po 120
3. n 0.3083
Math
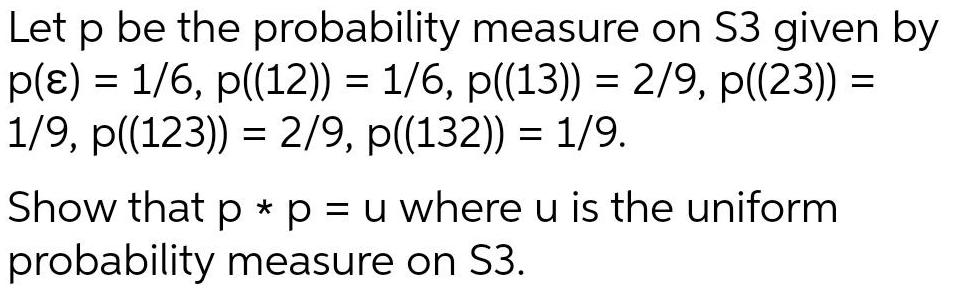
StatisticsLet p be the probability measure on S3 given by p(ɛ) = 1/6, p((12)) = 1/6, p((13)) = 2/9, p((23)) = 1/9, p((123)) = 2/9, p((132)) = 1/9.
Show that p * p = u where u is the uniform probability measure on S3.
Math
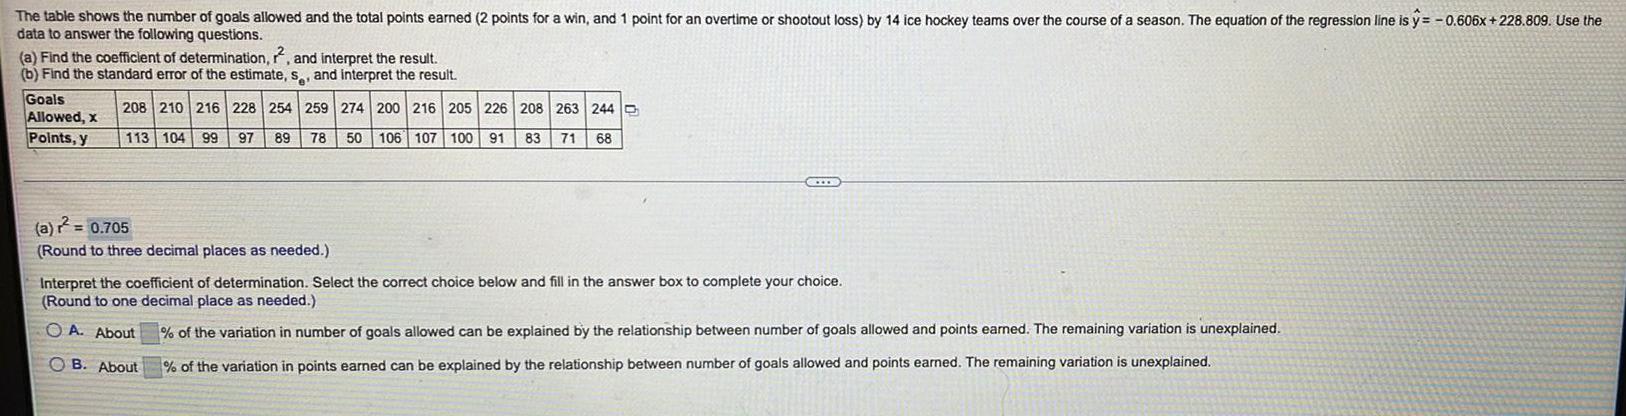
StatisticsThe table shows the number of goals allowed and the total points earned (2 points for a win, and 1 point for an overtime or shootout loss) by 14 ice hockey teams over the course of a season. The equation of the regression line is y=-0.606x +228.809. Use the
data to answer the following questions.
(a) Find the coefficient of determination, 2, and interpret the result.
(b) Find the standard error of the estimate, s, and interpret the result.
Goals Allowed, x 208 210 216 228 254 259 274 200 216 205 226 208 263 244
Points, y 113 104 99 97 89 78 50 106 107 100 91 83 71 68
(a) r² =
(Round to three decimal places as needed.)
Interpret the coefficient of determination. Select the correct choice below and fill in the answer box to complete your choice.
(Round to one decimal place as needed.)
A. About % of the variation in number of goals allowed can be explained by the relationship between number of goals allowed and points earned. The remaining variation is unexplained.
B. About % of the variation in points earned can be explained by the relationship between number of goals allowed and points earned. The remaining variation is unexplained.