Statistics Questions and Answers

Math
StatisticsA random sample of 25 Real Estate listings for houses in the Northeast section of a large city was selected from the city newspaper. A correlation coefficient of -80 was found between the age of a house and its list price. Which of the following statements is the best interpretation of this correlation?
A. Older houses tend to cost more money than newer houses.
B. Newer houses tend to cost more money than older houses.
C. Older houses are worth more because they were built with higher quality materials and labor.
D. New houses cost more because supplies and labor are more expensive today.

Math
StatisticsFor each research objective presented, identify the population and sample in the study: ) The Gallup organization contracts 1028 teenagers who are 13 to 17 years of age and asks whether they had been prescribed any medications.

Math
StatisticsThe average number of years a person takes to complete a graduate degree is 3. The standard deviation is 4. Assume the variable is normally distributed. If an individual enrolls in the program, find the probability that it will take
a. More than 4 years to complete the program.
b. Less than 3 years to complete the program.

Math
StatisticsA college statistics class conducted a survey of how students spend their money. They gathered data from a large random sample of college students who estimated how much money they typically spent each week in different categories (e.g., food, entertainment, etc.). The following statistics were calculated for money spent weekly on food: mean = $31.52; median $30.00; interquartile range = $34.00; standard deviation = $21.60; range = $132.50. The class determined that a mistake had been made and a value entered as 138 should have been entered as 38. They recalculate all of the statistics. Which of the following would be true?
A. The value of the median decreases, the value of the mean stays the same.
B. The values of the median and mean both decrease.
C. The value of the median stays the same, the value of the mean decreases.
![The five number summary of a dataset was found to be:
0, 1, 15, 17, 20
An observation is considered an outlier if it is below:
Enter an integer or decimal number [more..]
An observation is considered an outlier if it is above:](https://media.kunduz.com/media/sug-question/raw/57495591-1657629802.5957322.jpeg?w=256)
Math
StatisticsThe five number summary of a dataset was found to be:
0, 1, 15, 17, 20
An observation is considered an outlier if it is below:
Enter an integer or decimal number [more..]
An observation is considered an outlier if it is above:

Math
StatisticsA small regional carrier accepted 17 reservations for a particular flight with 13 seats. 7 reservations
went to regular customers who will arrive for the flight. Each of the remaining passengers will arrive
for the flight with a 40% chance, independently of each other.
Find the probability that overbooking occurs.
Find the probability that the flight has empty seats.

Math
StatisticsA pollster is going to sample a number of voters in a large city and construct a 90% confidence interval for the proportion who support the incumbent candidate for mayor. Find a sample size so that the margin of error will be no larger than 0.05.

Math
StatisticsOne way of checking the effect of undercoverage, nonresponse, and other sources of error in a sample survey is to compare the
sample with known demographic facts about the population. The 2010 census found that 13.9%, or 32,576,000, of the
235,016,000 adults, aged 18 and over, in the United States identified themselves as of Hispanic origin.
Is the value 13.9% a parameter or a statistic?
13.9% is a parameter derived from a national Census that includes all individuals in a population.
13.9% is a statistic derived from a national Census that sampled 32,576,000 adults.
13.9% is a parameter derived from a national Census that sampled 32,576,000 adults.
13.9% is a statistic derived from a national Census that includes all individuals in a population.

Math
StatisticsConsider a value to be significantly low if its z score less than or equal to -2 or consider a value to be significantly high if its z score is greater than or equal to 2.
A test is used to assess readiness for college. In a recent year, the mean test score was 20.7 and the standard deviation was 4.6. Identify the test scores that are significantly low or significantly high.
A. Test scores that are greater than
B. Test scores that are between
C. Test scores that are less than.

Math
StatisticsIn a study, 41% of adults questioned reported that their health was excellent. A researcher wishes to study the health of people living close to a nuclear power plant. Among 10 adults randomly selected from this area, only 3 reported that their health was excellent. Find the probability that when 10 adults are randomly selected, 3 or fewer are in excellent health.

Math
StatisticsUse the standard normal table to find the z-score that corresponds to the given percentile. If the area is not in the table, use the entry closest to the area. If the area is halfway between two entries, use the z-score halfway between the corresponding z-scores. If convenient, use technology to find the z-score.\

Math
StatisticsA hospital is trying to cut down on emergency room wait times. It is interested in the amount of time patients must wait before being called back to be examined. An investigation committee randomly surveyed 70 patients. The sample mean was 1.5 hours with a sample standard deviation of 0.5 hours.
Explain in complete sentences what the 95% confidence interval for the population mean time spent waiting means.
There is a 95% chance that a patient's wait time lies within this interval.
We are 95% confident that the true population mean time of all patient wait times lies within this interval.
We are 95% confident that the mean time of the sample of 70 patients wait time lies within this interval.
We are 95% confident that a patient's wait time lies within this interval.

Math
StatisticsTeachers' Salaries The average annual salary for all U.S. teachers is $47,750. Assume that the distribution is normal and the standard deviation is $5680.
Find these probabilities of the earnings of a teacher selected randomly. Round the final answers to at least four decimal places and intermediate z value
calculations to two decimal places.
Part 1 of 2
(a) Between $29,300 and $46.500 a year
P (29.300 < X<46.500) =

Math
StatisticsA population has parameters μ = 200.1 and σ= 9.2. You intend to draw a random sample of size
n = 206.
What is the mean of the distribution of sample means?
What is the standard deviation of the distribution of sample means?

Math
StatisticsA global research study found that the majority of today's working women would prefer a better work-life balance to an increased salary. One of the most important contributors
to work-life balance identified by the survey was "flexibility," with 45% of women saying that having a flexible work schedule is either very important or extremely important to
their career success. Suppose you select a sample of 100 working women. Answer parts (a) through (d).
*****
a. vvnat is the probability that in the sample Tewer than 49% say tnat naving a riexible Work Scnequie is eitner very important or extremely important to their career success
0.7893 (Round to four decimal places as needed.)
b. What is the probability that in the sample between 39% and 49% say that having a flexible work schedule is either very important or extremely important to their career
success?

Math
StatisticsThe brain volumes (cm³) of 20 brains have a mean of 1094.5 cm³ and a standard deviation
of 126.4 cm³. Use the given standard deviation and the range rule of thumb to identify the
limits separating values that are significantly low or significantly high. For such data, would a
brain volume of 1387.3 cm be significantly high?
WORKO
Significantly low values are
(Type an integer or a decimal.
cm³ or lower.
Do not round.)
Significantly high values are
cm³ or higher.
(Type an integer or a decimal. Do not round.)
Is 1387.3 cm³ significantly high?
A. Yes, because it is above the upper limit separating value.
OB. No, because it is below the lower limit separating value.
OC. No, because it is above the upper limit separating value.
D. Yes, because it is between the limits separating values.
OE. Yes, because it is below the lower limit separating value.
OF. No, because it is between the limits separating values.

Math
StatisticsAt the Fisher farm, the weights of zucchini squash are Normally distributed, with a mean of 5 ounces and a standard deviation of 0.7 ounces. Which weight represents the top 10% of the zucchinis? Find the z-table here.
4.1 ounces
4.3 ounces
5.7 ounces
5.9 ounces

Math
StatisticsFind the (a) mean, (b) median, (c) mode, and (d) midrange for the data and then (e) answer
the given questions.
Listed below are selling prices (dollars) of TVs that are 60 inches or larger and rated as a
"best buy" by a popular magazine. Are the resulting statistics representative of the
population of all TVs that are 60 inches and larger? If you decide to buy one of these TVs,
what statistic is most relevant, other than the measures of central tendency?
1400 1700 1950 1700 1350 1900 1700 1150 1900 1800 1700 1600

Math
StatisticsContaminated water: Polychlorinated biphenyls (PCBS) are a group of synthetic oil-like chemicals that were at one time widely used as insulation in electrical equipment and were discharged into rivers. They were discovered to be a health hazard and were banned in the 1970s. Assume that water samples are being drawn from a river in order to estimate the PCB concentration. Suppose that a random sample of size 71 has a sample mean of 1.88 parts per billion (ppb). Assume the population standard deviation is a=0.35 ppb.
(a) Construct a 98% confidence interval for the PCB concentration. Use tables or technology. Round your answers to at least two decimal places. The confidence interval is

Math
StatisticsBaby weight: Following are weights, in pounds, of 11 two-month-old baby girls. It is reasonable to assume that the population is approximately normal.
12.34 12.23
12.32 11.87
10.30 12.95
8.51
Part: 0/2
Part 1 of 2
8.51
14.13
8.63
9.34
Send data to Excel
Construct a 99.8% interval for the mean weight of two-month-old baby girls. Round the answers to three decimal places.
A 99.8% confidence interval for the mean weight of two-month-old baby girls is 10.244 << 12.130
X
S

Math
StatisticsDrill lifetime: A sample of 50 drills had a mean lifetime of 12.20 holes drilled when drilling a low-carbon steel. Assume the population standard deviation is 7.02.
Part 1 of 3
(a) Construct a 95% confidence interval for the mean lifetime of this type of drill. Use tables or technology. Round your answers to at least two decimal
places.
The confidence interval is
Part 2 of 3
(b) The manufacturer of the drills claims that the mean lifetime is greater than 13. Does this confidence interval contradict this claim?
(Choose one), the confidence interval contains some/does not contain any values greater than 13, so the claim
(Choose one) contradicted.

Math
StatisticsA survey found that the American family generates an average of 17.2 pounds of glass garbage each year. Assume the standard deviation of the distribution is 2.5 pounds. Find the probability that the mean of a sample of 49 families will be between 16.2 and 17.2 pounds. Assume that the sample is taken from a large population and the correction factor can be ignored. Round your final answer to four decimal places and intermediate z-value calculations to two decimal places.
P(16.2 < X<17.2)=

Math
StatisticsA scientist wants to find the average weight of fish living in a large pond. So she will use the weights of 30 fish from the pond to find the average weight.
Answer the questions below.
(a) Which unit(s) could be used for the unit of measurement? Check all that apply.
seconds ounces hours pounds minutes
(b) Which of the procedures below would be the best way to find the average weight?
Pick 30 fish from a shallow region of the pond and estimate their weights.
Pick 30 fish from a shallow region of the pond and weigh each of them.
Randomly pick 30 fish from the entire pond and weigh each of them.
Randomly pick 30 fish from the entire pond and estimate their weights.

Math
StatisticsLife of Smoke Detectors The average lifetime of smoke detectors that a company manufactures is 5 years, or 60 months, and the standard deviation is 8 months. Find the probability that a random sample of 34 smoke detectors will have a mean lifetime between 58 and 63 months. Assume that the sample is taken from a large population and the correction factor can be ignored. Round the final answer to at least four decimal places and intermediate z-value calculations to two decimal places.
P(58 < X<63) = 1

Math
StatisticsA sample of 20 computer chips were tested for speed in a certain application. The mean speed was x=495 megahertz, with a standard deviation of 10 megahertz. There was one outlier.
Is it appropriate to use the methods of this section to construct a confidence interval for the mean speed of this chip?
Yes
No, because the sample size is too small and the sample does not indicate an approximately normal population.
No, because we do not know the population standard deviation.
No, because the standard deviation is too high.
Math
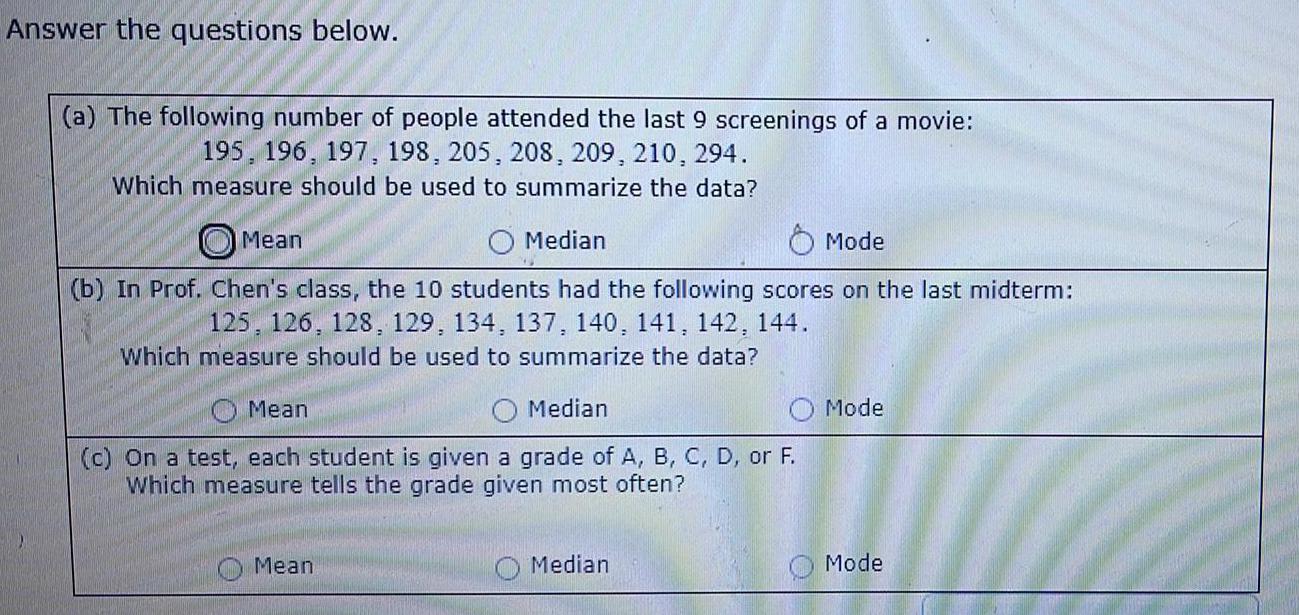
StatisticsAnswer the questions below.
(a) The following number of people attended the last 9 screenings of a movie:
195, 196, 197, 198, 205, 208, 209, 210, 294.
Which measure should be used to summarize the data?
Mean
Median
Mode
(b) In Prof. Chen's class, the 10 students had the following scores on the last midterm:
125, 126, 128, 129, 134, 137, 140, 141, 142, 144.
Which measure should be used to summarize the data?
Mean
Median
Mode
(c) On a test, each student is given a grade of A, B, C, D, or F.
Which measure tells the grade given most often?
Mean
Median
Mode

Math
StatisticsFind the critical value 2 needed to construct a confidence interval of the given level with the given sample size. Round the answer to at least three decimal places.
Level 99%, sample size 17.
Critical value =

Math
StatisticsA sample of 18 participants took part in a hearing experiment. Among other things, the absolute hearing threshold (in decibels) was measured for each participant. The 18 measurements were as follows:
25, 22, 18, 35, 37, 34, 31, 27, 24, 21, 18, 39, 26, 26, 26, 23, 23, 20
Send data to calculator
Draw the frequency polygon for these data using an initial class boundary of 17.5 and a class width of 5. Note that you can add or remove classes from the figure. Label each class with its midpoint.

Math
StatisticsFollowing a heat stroke, a patient's temperature averaged
100.4F over a 4-day period. On the fifth and sixth days, the
patient's temperature averaged 99.1F. What was the patients
average temperature over the six day?
A. 99.9F
B. 98.6F
C. 100.2
D. 100.1

Math
StatisticsIn the 1992 presidential election, Alaska's election districts averaged 1,957 votes per
district for President Clinton. The standard deviation was 572.3. The distribution of the
votes per district for President Clinton was bell-shaped.
For every question in this part, show your work on paper - calculator functions and numbers.
All work on paper will be upload on the last question of this HW

Math
StatisticsSalary of Full Professors The average salary of a male full professor at a public four-year institution offering classes at the doctoral level is $99,685. For a
female full professor at the same kind of institution, the salary is $90,330. If the standard deviation for the salaries of both genders is approximately $5200 and
the salaries are normally distributed, find the 82nd percentile salary for the following. Round your answers to the nearest dollar and intermediate z-value
calculations to 2 decimal places.
Male professors
The 82nd percentile salary for male professors is $

Math
StatisticsMath workshops and final exams: The college tutoring center staff are considering whether the center should increase the number of math workshops they offer to help students improve their performance in math classes. Faculty would like to know if
requiring student attendance at these math workshops will improve overall passing rates for their students in their math classes. They plan to use the number of workshops attended to predict the final exam score and regression analysis to determine the
effectiveness of the mandatory workshop attendance policy.
Which is the response variable?
Whether the student passes the course (yes, no)
Number of workshops attended
Final exam score
Whether the student attended a workshop (yes, no)
Math
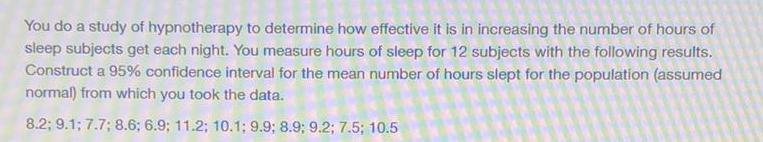
StatisticsYou do a study of hypnotherapy to determine how effective it is in increasing the number of hours of sleep subjects get each night. You measure hours of sleep for 12 subjects with the following results. Construct a 95% confidence interval for the mean number of hours slept for the population (assumed normal) from which you took the data. 8.2; 9.1; 7.7; 8.6; 6.9; 11.2; 10.1; 9.9; 8.9; 9.2; 7.5; 10.5

Math
StatisticsSuppose that 22% of all steel shafts produced by a certain process are nonconforming but can be reworked (rather than having to be scrapped). (a) In a random sample of 240 shafts, find the approximate probability that between 42 and 64 (inclusive) are nonconforming and can be reworked. (b) In a random sample of 240 shafts, find the approximate probability that at least 54 are nonconforming and can be reworked.

Math
StatisticsSuppose Exam 1 has a normal distribution with mean = 82 and standard deviation = 14.9. Select one student at random,
a. find the probability that the student got at least 90 on Exam
1. Write answer in 2 decimals.
b. find the probability that the student got between 70 and 80
on Exam 1.
Write answer in 2 decimals.

Math
StatisticsThe weights of newborn for hippopotami is approximately Normal, with a mean of 85 pounds and a standard deviation of 10 pounds.
a. What is the probability that a newborn hippo weighs between 90 and 111 pounds?
b. Suppose baby hippos that weigh at the 6th percentile or less at birth are unlikely to survive. What weight corresponds with the 6th percentile for newborn hippos?
c. In 2017, a hippo was born at a particular zoo, 6 weeks premature, and weighed only 26 pounds at birth. What percentage of baby hippos are born weighing 26 pounds or less?
a. The probability that a newborn hippo weighs between 90 and 111 pounds is.
(Round to three decimal places as needed.)

Math
StatisticsI recommend using a graphing calculator when solving this problem.
Listed below are head injury measurements from small cars that were tested in crashes. The measurements are in "hic," which is a measurement of a standard "head injury criterion," (lower "hic" values correspond to safer cars). The listed values correspond to cars A, B, C, D, E, F, and G respectively.
515, 361, 333, 527, 502, 358, 418
a) Find the mean of the measurements (2pts)
b) Find the median of the measurements (2pts)
c) Find the mode of the measurements (2pts)
d) Find the midrange of the measurements (2pts)
e) Which car appears to be safer? (2pts)

Math
StatisticsWhich of the following variables regarding football players is quantitative?
1.a
Position
2.b
Weight
3. C
Team
4.d
Race
Math
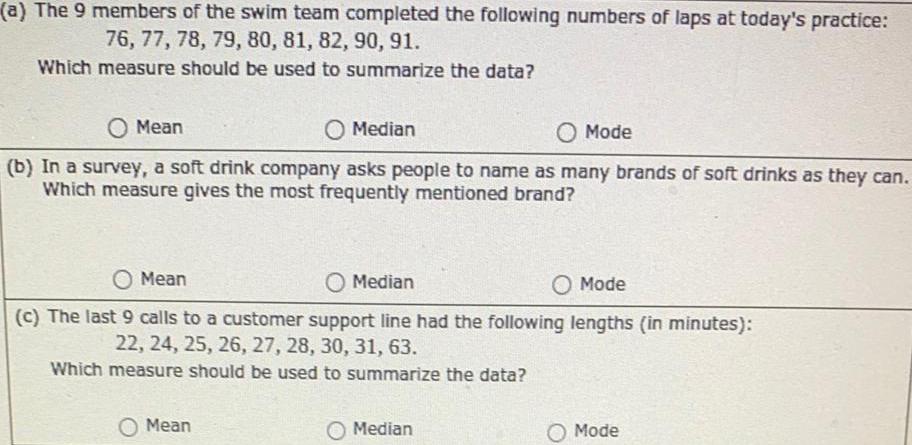
Statistics(a) The 9 members of the swim team completed the following numbers of laps at today's practice:
76, 77, 78, 79, 80, 81, 82, 90, 91.
Which measure should be used to summarize the data?
Mean
Median
Mode
(b) In a survey, a soft drink company asks people to name as many brands of soft drinks as they can.
Which measure gives the most frequently mentioned brand?
Mean
Median
Mode
(c) The last 9 calls to a customer support line had the following lengths (in minutes):
22, 24, 25, 26, 27, 28, 30, 31, 63.
Which measure should be used to summarize the data?
Mean
Median
Mode

Math
StatisticsA grocery store counts the number of customers who arrive during an hour. The average over a year is 28 customers per hour. Assume the arrival of customers follows a Poisson distribution. (It usually does.)
Find the probability that at least one customer arrives in a particular one minute period. Round your answer to 3 decimals.
Find the probability that at least two customers arrive in a particular 2 minute period. Round your answer to four decimals.

Math
StatisticsClayton is standing on the top floor of Titus Tower, 354 meters above the ground. Looking down from the window, he can see City Center Park just over the top of the Hanson Hotel. Titus Tower is 207 meters from the Hanson Hotel, and Hanson Hotel is 126 meters tall. 354 m 207 m How far is Titus Tower from City Center Park? Round your answer to the no

Math
StatisticsSuppose average pizza delivery times are normally distributed with an unknown population mean and a population standard deviation of six minutes. A random sample of 28 pizza delivery restaurants is taken and has a sample mean delivery time of 36 minutes. Find a 90% confidence interval estimate for the population mean delivery time.
Math
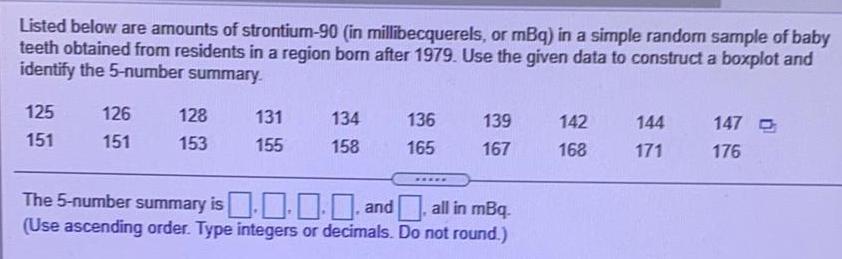
StatisticsListed below are amounts of strontium-90 (in millibecquerels, or mBq) in a simple random sample of baby teeth obtained from residents in a region born after 1979. Use the given data to construct a boxplot and identify the 5-number summary. 125 151 126 151 128 153 131 155 134 158 136 139 167

Math
StatisticsEnter a number rounded to one decimal if necessary.
You roll a fair die with the numbers 5-10 on its faces.
You record the number on the upper face after it becomes stationary.
The expected value of this experiment is
After rolling the die another 6 times, the expected value is

Math
StatisticsThe following are the ratings of males by females in an experiment involving speed dating. Use the given data to construct a boxplot and identify the 5-number summary.
3.0 4.0 5.0 6.0 6.5 6.5 7.0 7.0 7.0 7.0 7.0 7.5 7.5 7.5 7.5 7.5 8.5 9.5 9.5 10.0
The 5-number summary is

Math
StatisticsLet x be a continous random variable that is normally distributed with a mean of u = 70 and a standard deviation of 4. Find the probability that x assumes a value:
a. between x = 62 and x = 67
P(62<x<67) =
b. from x = 66 and x = 79
P(66<x<79)=
Note: Keep 4 decimal places in your answers.

Math
StatisticsIf you invest $6800 in a fund that pays 10% annual interest compounded monthly (12 times per year), how much will you have after 9 years?
Use the formula for compound interest: A=P(1+r/n)nt
You will have $ in your account after 9 years.
(Do not round until the final answer. Then round to the nearest cent as needed.)

Math
StatisticsFind the area under the normal distribution curve with μ = 20
and o 4. (Keep 4 decimal places in your answers.)
=
a. Area between x = 20 and x = 29

Math
StatisticsA group of adult males has foot lengths with a mean of 28.22 cm and a standard deviation of 1.22 cm. Use
the range rule of thumb to identify the limits separating values that are significantly low or significantly high.
Is the adult male foot length of 25.4 cm significantly low or significantly high? Explain.

Math
StatisticsSuppose that the quantity supplied S and quantity demanded D of T-shirts at a concert are given by the following functions where p is the price.
S(p)=-340+ 40p
D(p) = 1100-50p
Answer parts (a) through (c).
(a) Find the equilibrium price for the T-shirts at this concert.
The equilibrium price is $16 (Round to the nearest dollar as needed.)
What is the equilibrium quantity?
The equilibrium quantity is 300 T-shirts.
(Type a whole number.)
(b) Determine the prices for which quantity demanded is greater than quantity supplied.
For the price $
$ the quantity demanded is greater than quantity supplied.
p