Statistics Questions and Answers
Math
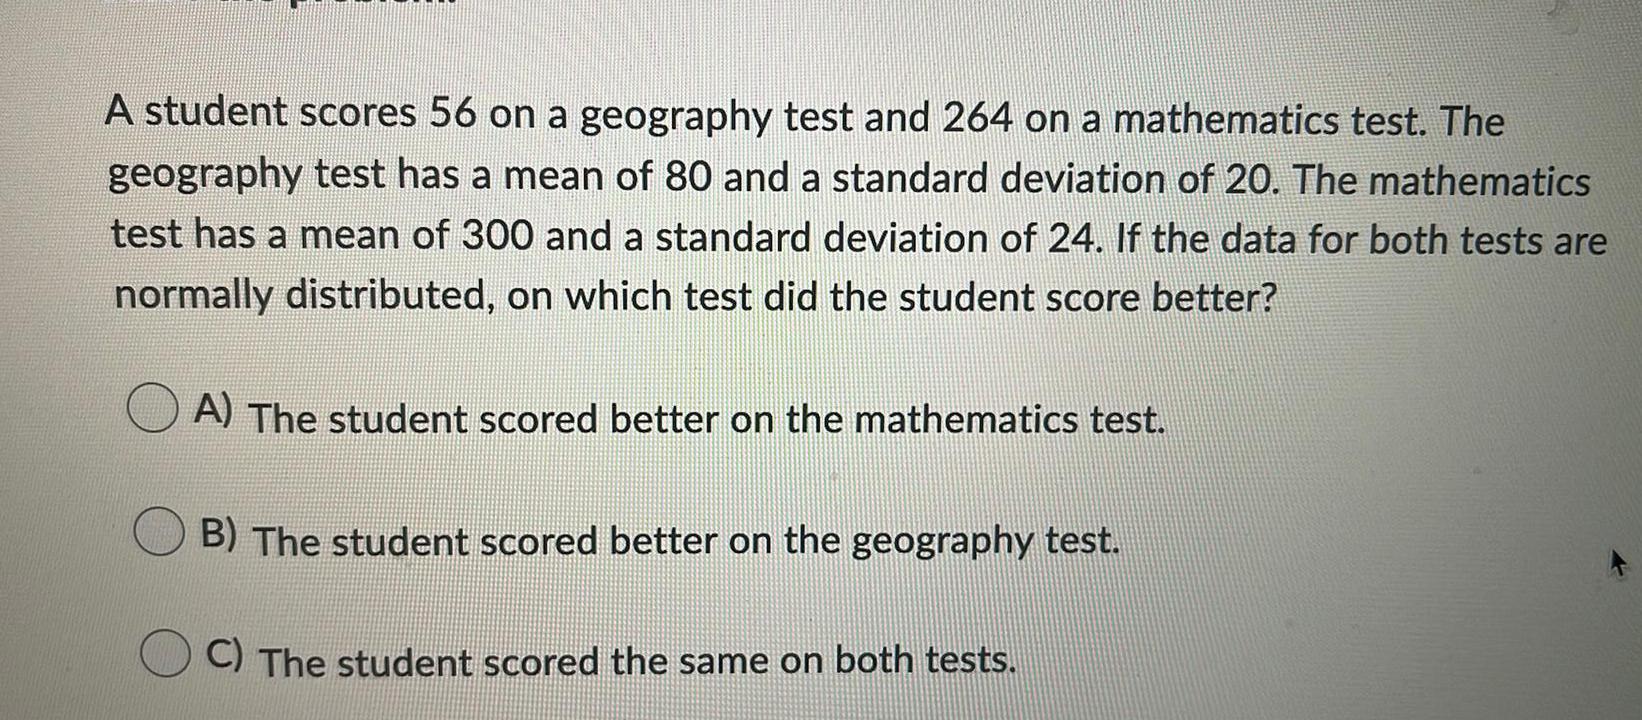
StatisticsA student scores 56 on a geography test and 264 on a mathematics test. The geography test has a mean of 80 and a standard deviation of 20. The mathematics test has a mean of 300 and a standard deviation of 24. If the data for both tests are normally distributed, on which test did the student score better?
A) The student scored better on the mathematics test.
B) The student scored better on the geography test.
C) The student scored the same on both tests.
Math
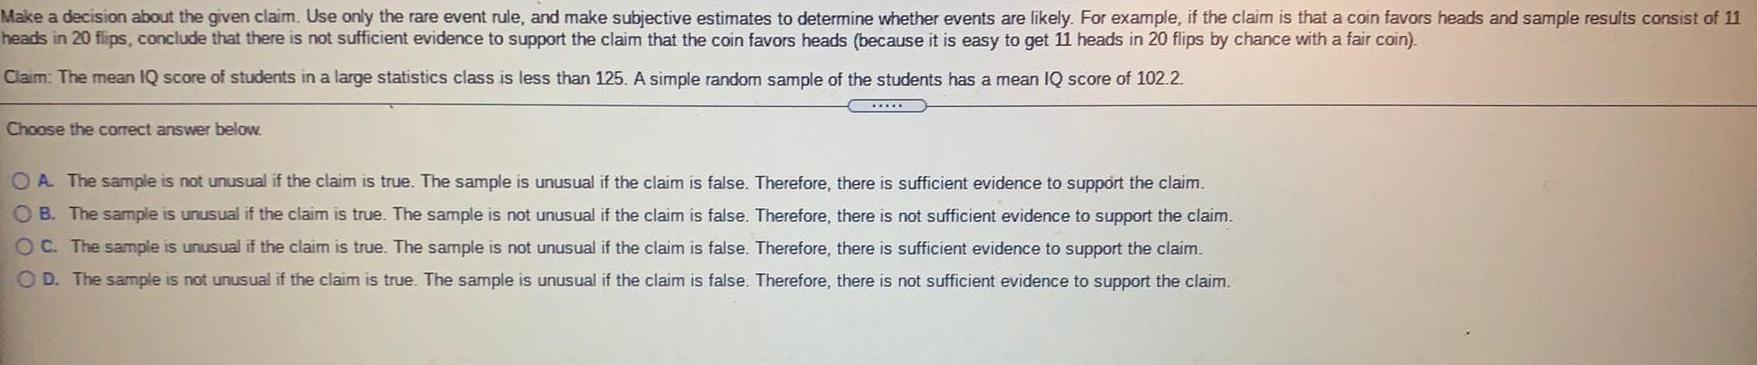
StatisticsMake a decision about the given claim. Use only the rare event rule, and make subjective estimates to determine whether events are likely. For example, if the claim is that a coin favors heads and sample results consist of 11 heads in 20 flips, conclude that there is not sufficient evidence to support the claim that the coin favors heads (because it is easy to get 11 heads in 20 flips by chance with a fair coin).
Claim: The mean IQ score of students in a large statistics class is less than 125. A simple random sample of the students has a mean IQ score of 102.2.
Choose the correct answer below.
A. The sample is not unusual if the claim is true. The sample is unusual if the claim is false. Therefore, there is sufficient evidence to support the claim.
B. The sample is unusual if the claim is true. The sample is not unusual if the claim is false. Therefore, there is not sufficient evidence to support the claim.
C. The sample is unusual if the claim is true. The sample is not unusual if the claim is false. Therefore, there is sufficient evidence to support the claim.
D. The sample is not unusual if the claim is true. The sample is unusual if the claim is false. Therefore, there is not sufficient evidence to support the claim.
Math
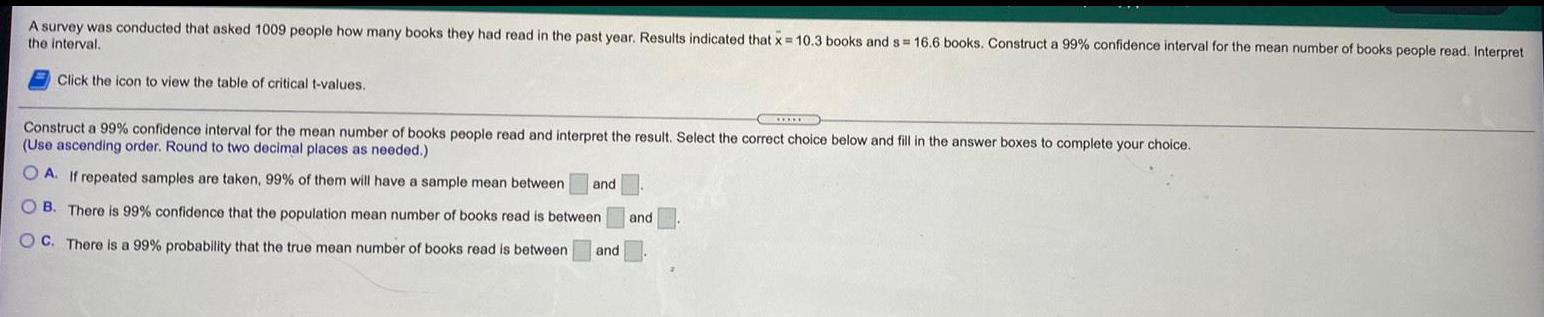
StatisticsA survey was conducted that asked 1009 people how many books they had read in the past year. Results indicated that x = 10.3 books and s= 16.6 books. Construct a 99% confidence interval for the mean number of books people read. Interpret the interval.
Click the icon to view the table of critical t-values.
Construct a 99% confidence interval for the mean number of books people read and interpret the result. Select the correct choice below and fill in the answer boxes to complete your choice.
(Use ascending order. Round to two decimal places as needed.)
A. If repeated samples are taken, 99% of them will have a sample mean between and
B. There is 99% confidence that the population mean number of books read is between
C. There is a 99% probability that the true mean number of books read is between and
and
Math
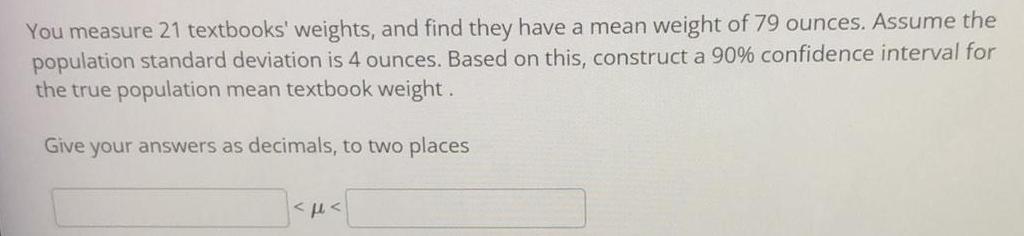
StatisticsYou measure 21 textbooks' weights, and find they have a mean weight of 79 ounces. Assume the population standard deviation is 4 ounces. Based on this, construct a 90% confidence interval for the true population mean textbook weight.
Math
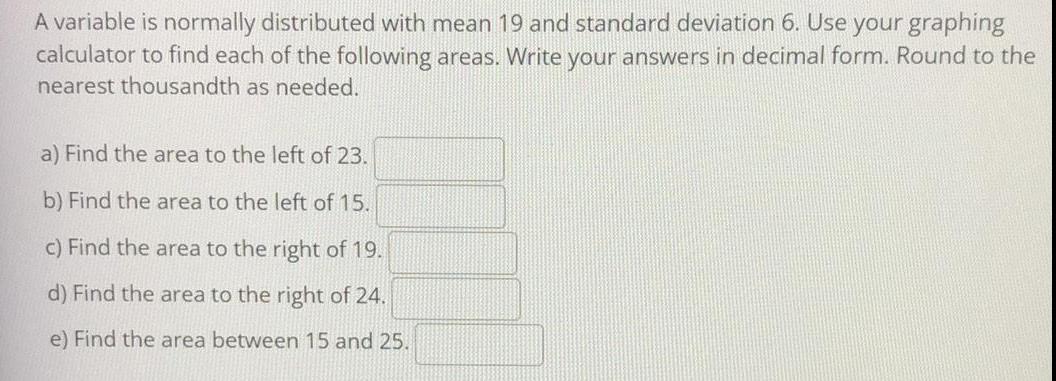
StatisticsA variable is normally distributed with mean 19 and standard deviation 6. Use your graphing
calculator to find each of the following areas. Write your answers in decimal form. Round to the
nearest thousandth as needed.
a) Find the area to the left of 23.
b) Find the area to the left of 15.
c) Find the area to the right of 19.
d) Find the area to the right of 24.
e) Find the area between 15 and 25.
Math
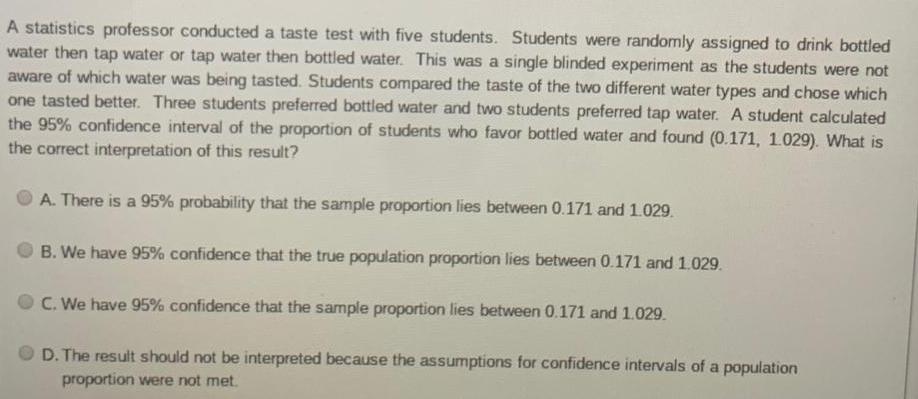
StatisticsA statistics professor conducted a taste test with five students. Students were randomly assigned to drink bottled water then tap water or tap water then bottled water. This was a single blinded experiment as the students were not aware of which water was being tasted. Students compared the taste of the two different water types and chose which one tasted better. Three students preferred bottled water and two students preferred tap water. A student calculated the 95% confidence interval of the proportion of students who favor bottled water and found (0.171, 1.029). What is the correct interpretation of this result?
A. There is a 95% probability that the sample proportion lies between 0.171 and 1.029.
B. We have 95% confidence that the true population proportion lies between 0.171 and 1.029.
C. We have 95% confidence that the sample proportion lies between 0.171 and 1.029.
D. The result should not be interpreted because the assumptions for confidence intervals of a population
proportion were not met.
Math
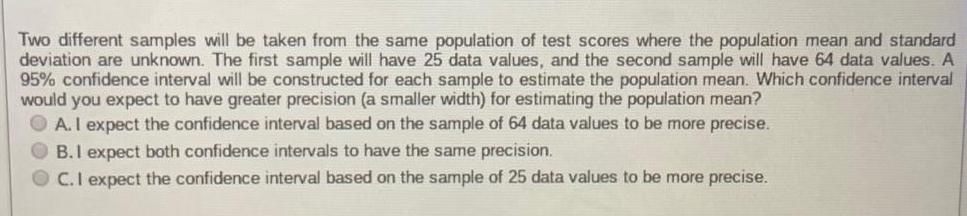
StatisticsTwo different samples will be taken from the same population of test scores where the population mean and standard deviation are unknown. The first sample will have 25 data values, and the second sample will have 64 data values. A 95% confidence interval will be constructed for each sample to estimate the population mean. Which confidence interval would you expect to have greater precision (a smaller width) for estimating the population mean?
A. I expect the confidence interval based on the sample of 64 data values to be more precise.
B. I expect both confidence intervals to have the same precision.
C.I expect the confidence interval based on the sample of 25 data values to be more precise.
Math
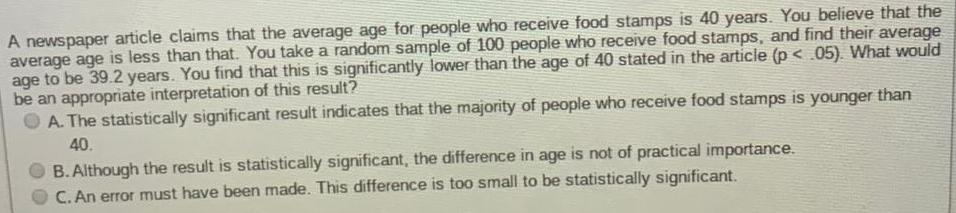
StatisticsA newspaper article claims that the average age for people who receive food stamps is 40 years. You believe that theaverage age is less than that. You take a random sample of 100 people who receive food stamps, and find their averageage to be 39.2 years. You find that this is significantly lower than the age of 40 stated in the article (p<.05). What wouldbe an appropriate interpretation of this result?
A. The statistically significant result indicates that the majority of people who receive food stamps is younger than
40.
B. Although the result is statistically significant, the difference in age is not of practical importance.
C. An error must have been made. This difference is too small to be statistically significant.
Math
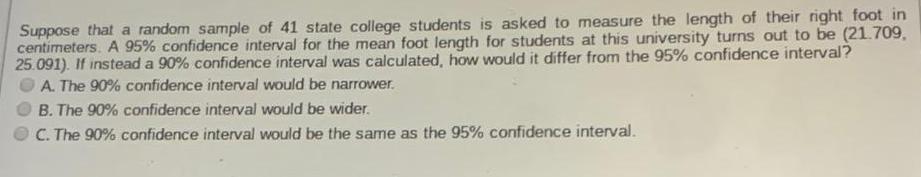
StatisticsSuppose that a random sample of 41 state college students is asked to measure the length of their right foot in centimeters. A 95% confidence interval for the mean foot length for students at this university turns out to be (21.709. 25.091). If instead a 90% confidence interval was calculated, how would it differ from the 95% confidence interval?
A. The 90% confidence interval would be narrower.
B. The 90% confidence interval would be wider.
C. The 90% confidence interval would be the same as the 95% confidence interval.
Math
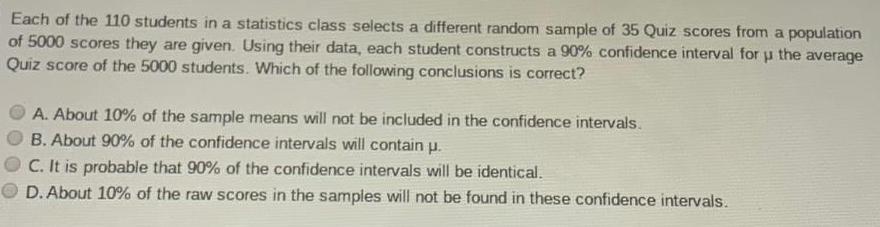
StatisticsEach of the 110 students in a statistics class selects a different random sample of 35 Quiz scores from a population of 5000 scores they are given. Using their data, each student constructs a 90% confidence interval for μ the average
Quiz score of the 5000 students. Which of the following conclusions is correct?
A. About 10% of the sample means will not be included in the confidence intervals.
B. About 90% of the confidence intervals will contain μ.
C. It is probable that 90% of the confidence intervals will be identical.
D. About 10% of the raw scores in the samples will not be found in these confidence intervals.
Math
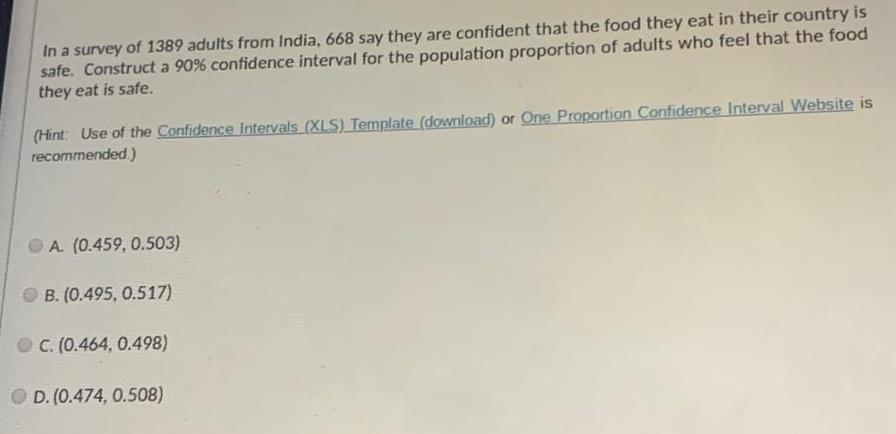
StatisticsIn a survey of 1389 adults from India, 668 say they are confident that the food they eat in their country is safe. Construct a 90% confidence interval for the population proportion of adults who feel that the food they eat is safe. (
Hint: Use of the Confidence Intervals (XLS) Template (download) or One Proportion Confidence Interval Website is recommended.)
A. (0.459, 0.503)
B. (0.495, 0.517)
C. (0.464, 0.498)
D. (0.474, 0.508)
Math
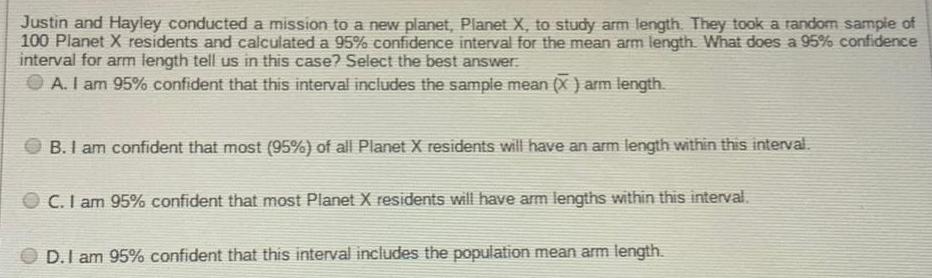
StatisticsJustin and Hayley conducted a mission to a new planet, Planet X, to study arm length. They took a random sample of 100 Planet X residents and calculated a 95% confidence interval for the mean arm length. What does a 95% confidence interval for arm length tell us in this case? Select the best answer.
A. I am 95% confident that this interval includes the sample mean (X) arm length.
B. I am confident that most (95%) of all Planet X residents will have an arm length within this interval.
C. I am 95% confident that most Planet X residents will have arm lengths within this interval.
D. I am 95% confident that this interval includes the population mean arm length.
Math
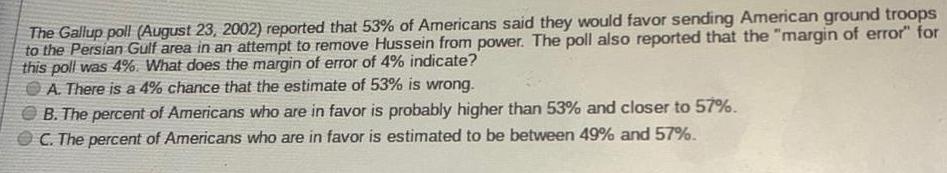
StatisticsThe Gallup poll (August 23, 2002) reported that 53% of Americans said they would favor sending American ground troops to the Persian Gulf area in an attempt to remove Hussein from power. The poll also reported that the "margin of error" for this poll was 4%. What does the margin of error of 4% indicate?
A. There is a 4% chance that the estimate of 53% is wrong.
B. The percent of Americans who are in favor is probably higher than 53% and closer to 57%.
C. The percent of Americans who are in favor is estimated to be between 49% and 57%.
Math
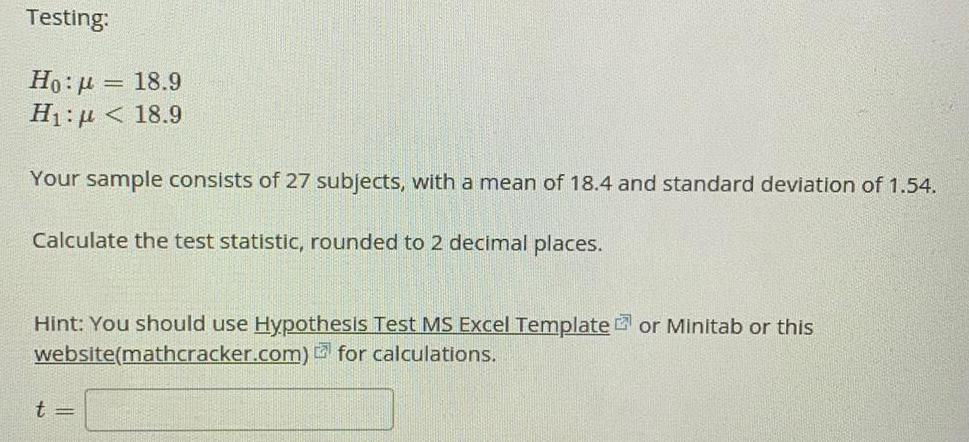
StatisticsTesting:
H0: μ = 18.9
H₁: μ< 18.9
Your sample consists of 27 subjects, with a mean of 18.4 and standard deviation of 1.54.
Calculate the test statistic, rounded to 2 decimal places.
Math
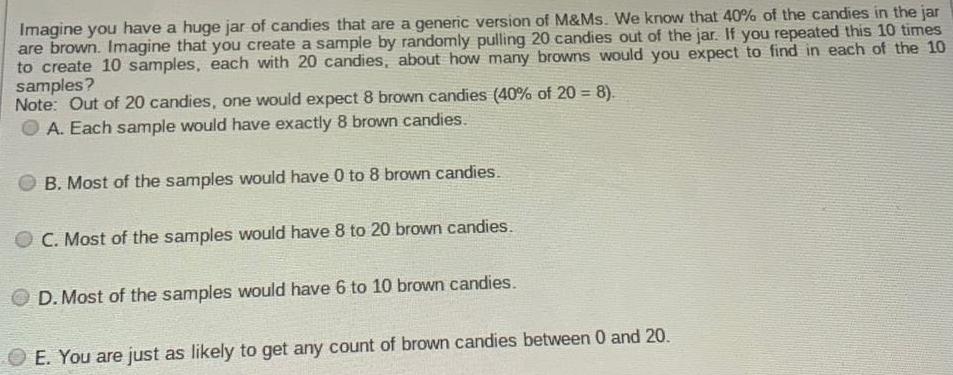
StatisticsImagine you have a huge jar of candies that are a generic version of M&Ms. We know that 40% of the candies in the jar
are brown. Imagine that you create a sample by randomly pulling 20 candies out of the jar. If you repeated this 10 times
to create 10 samples, each with 20 candies, about how many browns would you expect to find in each of the 10
samples?
Note: Out of 20 candies, one would expect 8 brown candies (40% of 20 = 8).
A. Each sample would have exactly 8 brown candies.
B. Most of the samples would have 0 to 8 brown candies.
C. Most of the samples would have 8 to 20 brown candies.
D. Most of the samples would have 6 to 10 brown candies.
OE. You are just as likely to get any count of brown candies between 0 and 20.
Math
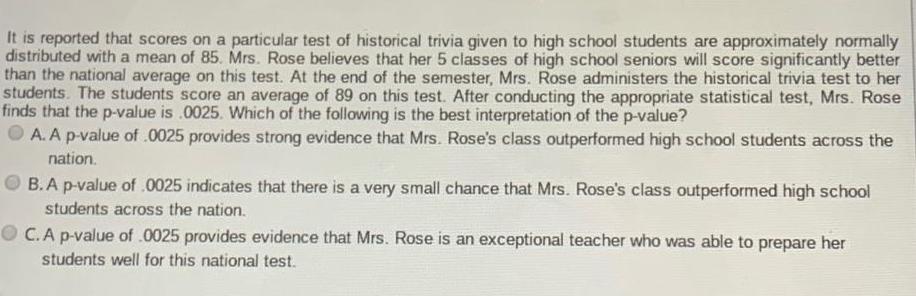
StatisticsIt is reported that scores on a particular test of historical trivia given to high school students are approximately normally
distributed with a mean of 85. Mrs. Rose believes that her 5 classes of high school seniors will score significantly better
than the national average on this test. At the end of the semester, Mrs. Rose administers the historical trivia test to her
students. The students score an average of 89 on this test. After conducting the appropriate statistical test, Mrs. Rose
finds that the p-value is .0025. Which of the following is the best interpretation of the p-value?
A. A p-value of .0025 provides strong evidence that Mrs. Rose's class outperformed high school students across the
nation.
B.A p-value of .0025 indicates that there is a very small chance that Mrs. Rose's class outperformed high school
students across the nation.
C.A p-value of .0025 provides evidence that Mrs. Rose is an exceptional teacher who was able to prepare her
students well for this national test.
Math
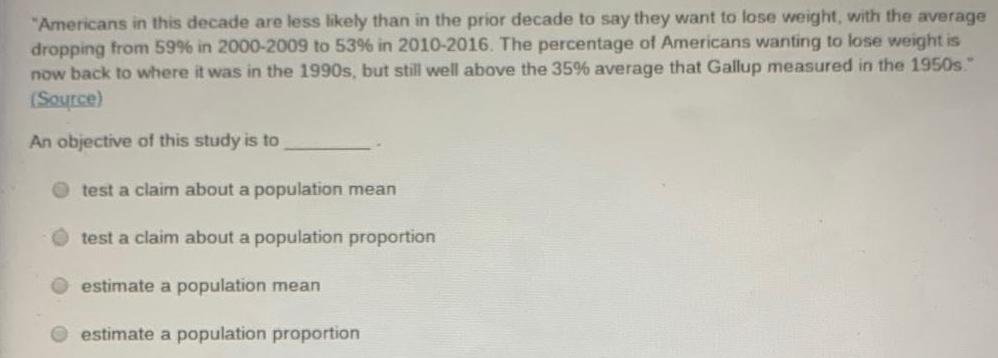
Statistics"Americans in this decade are less likely than in the prior decade to say they want to lose weight, with the average dropping from 59% in 2000-2009 to 53% in 2010-2016. The percentage of Americans wanting to lose weight is now back to where it was in the 1990s, but still well above the 35% average that Gallup measured in the 1950s." (Source)
An objective of this study is to
test a claim about a population mean
test a claim about a population proportion
estimate a population mean
estimate a population proportion
Math
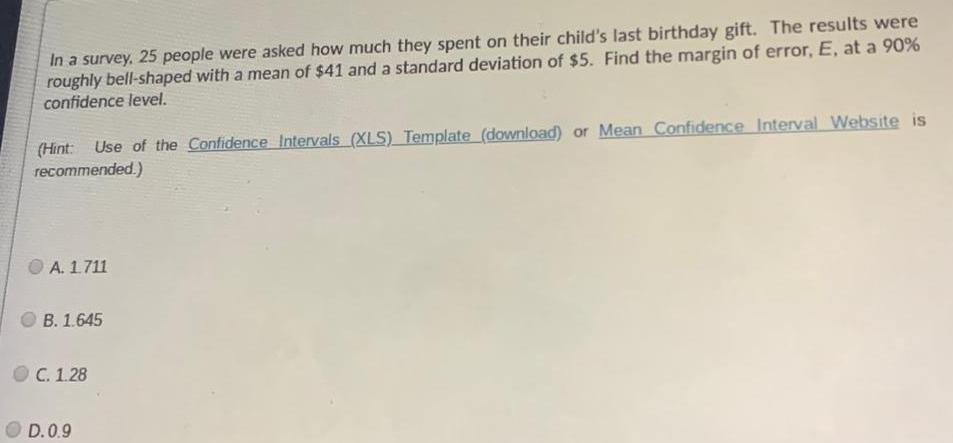
StatisticsIn a survey, 25 people were asked how much they spent on their child's last birthday gift. The results were roughly bell-shaped with a mean of $41 and a standard deviation of $5. Find the margin of error, E, at a 90% confidence level.
(Hint: Use of the Confidence Intervals (XLS) Template (download) or Mean Confidence Interval Website is recommended.)
A. 1.711
B. 1.645
C. 1.28
D.0.9
Math
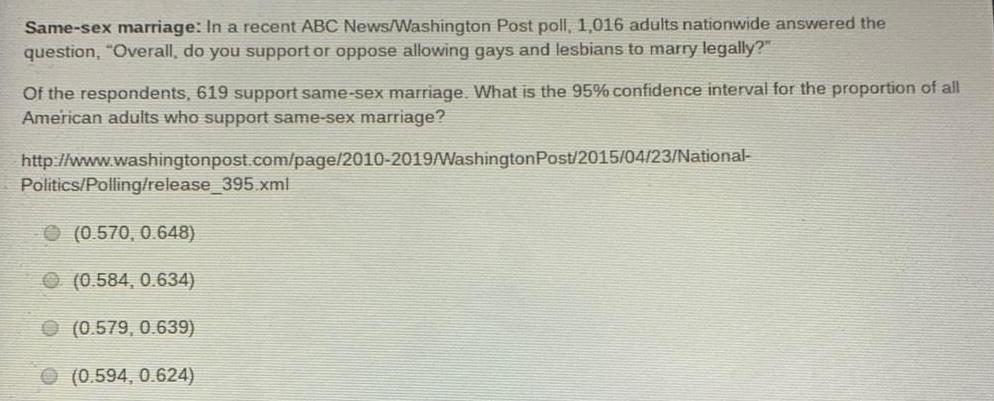
StatisticsSame-sex marriage: In a recent ABC News/Washington Post poll, 1,016 adults nationwide answered the
question, "Overall, do you support or oppose allowing gays and lesbians to marry legally?"
Of the respondents, 619 support same-sex marriage. What is the 95% confidence interval for the proportion of all
American adults who support same-sex marriage?
http://www.washingtonpost.com/page/2010-2019/Washington Post/2015/04/23/National-
Politics/Polling/release_395.xml
(0.570, 0.648)
(0.584, 0.634)
(0.579, 0.639)
(0.594, 0.624)
Math
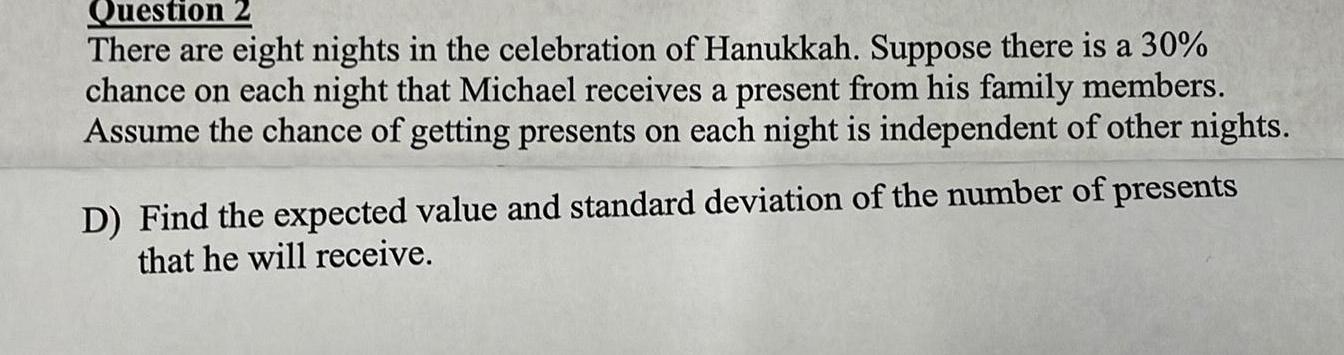
StatisticsThere are eight nights in the celebration of Hanukkah. Suppose there is a 30% chance on each night that Michael receives a present from his family members. Assume the chance of getting presents on each night is independent of other nights.
D) Find the expected value and standard deviation of the number of presents that he will receive.
Math
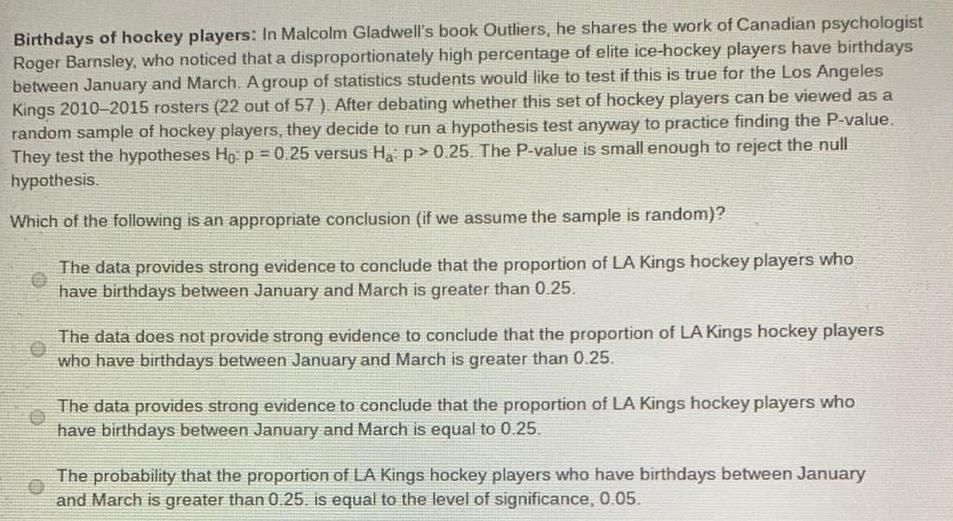
StatisticsBirthdays of hockey players: In Malcolm Gladwell's book Outliers, he shares the work of Canadian psychologist
Roger Barnsley, who noticed that a disproportionately high percentage of elite ice-hockey players have birthdays
between January and March. A group of statistics students would like to test if this is true for the Los Angeles
Kings 2010-2015 rosters (22 out of 57). After debating whether this set of hockey players can be viewed as a
random sample of hockey players, they decide to run a hypothesis test anyway to practice finding the P-value.
They test the hypotheses Ho: p = 0.25 versus Ha p > 0.25. The P-value is small enough to reject the null
hypothesis.
Which of the following is an appropriate conclusion (if we assume the sample is random)?
The data provides strong evidence to conclude that the proportion of LA Kings hockey players who
have birthdays between January and March is greater than 0.25.
The data does not provide strong evidence to conclude that the proportion of LA Kings hockey players
who have birthdays between January and March is greater than 0.25.
The data provides strong evidence to conclude that the proportion of LA Kings hockey players who
have birthdays between January and March is equal to 0.25.
The probability that the proportion of LA Kings hockey players who have birthdays between January
and March is greater than 0.25. is equal to the level of significance, 0.05.
Math
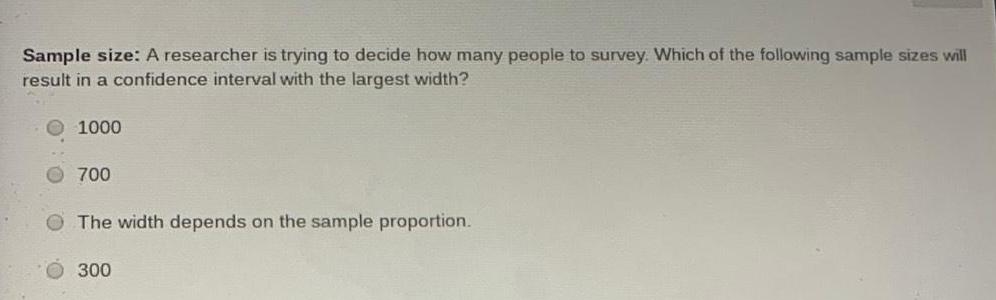
StatisticsSample size: A researcher is trying to decide how many people to survey. Which of the following sample sizes will result in a confidence interval with the largest width?
1000
700
The width depends on the sample proportion.
300
Math
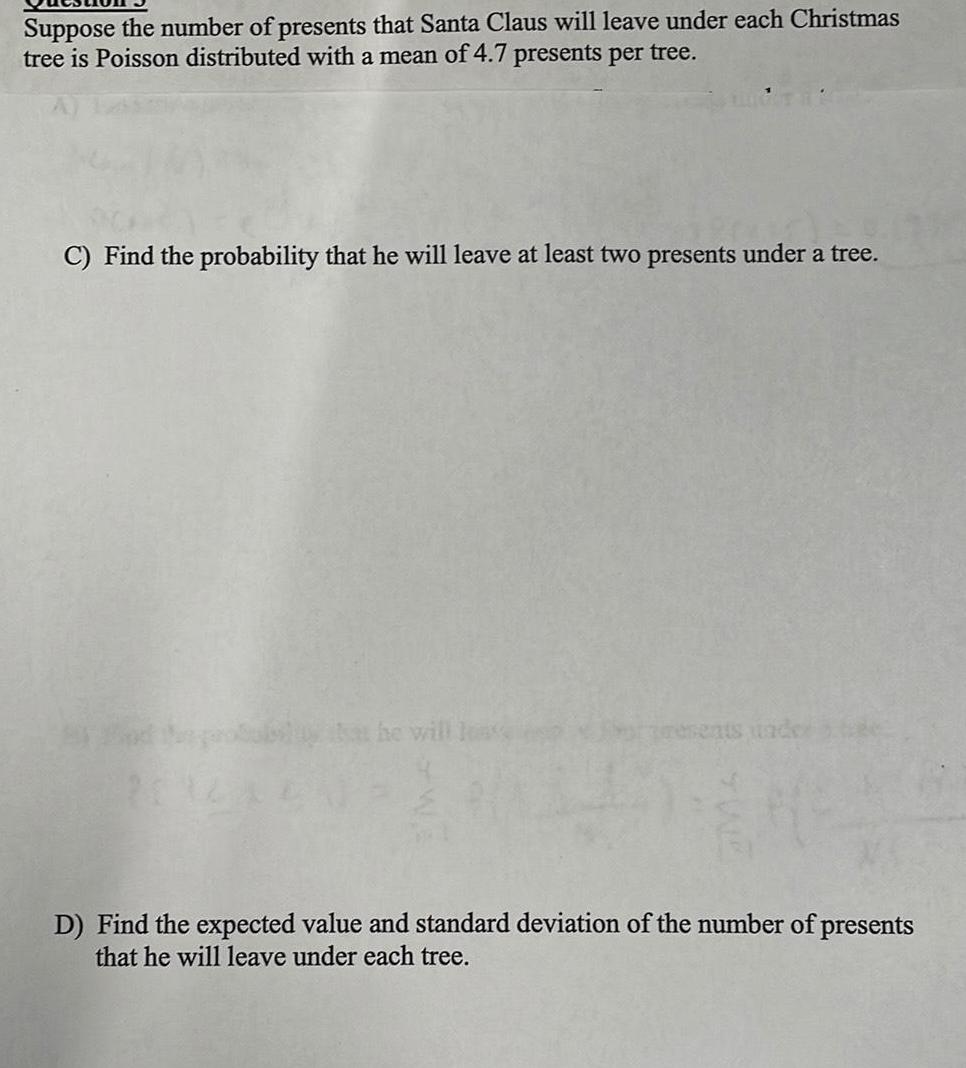
StatisticsSuppose the number of presents that Santa Claus will leave under each Christmas tree is Poisson distributed with a mean of 4.7 presents per tree.
C) Find the probability that he will leave at least two presents under a tree.
D) Find the expected value and standard deviation of the number of presents that he will leave under each tree.
Math
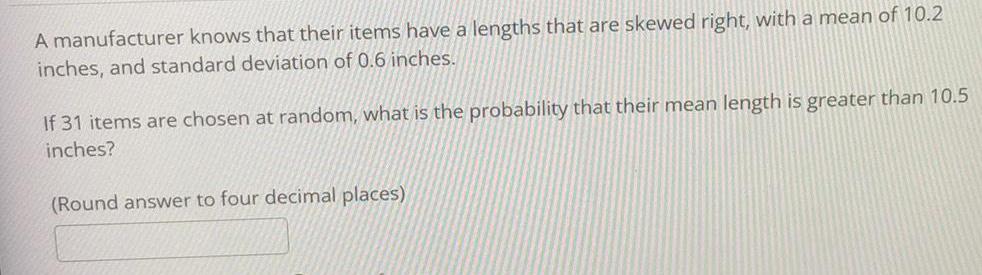
StatisticsA manufacturer knows that their items have a lengths that are skewed right, with a mean of 10.2
inches, and standard deviation of 0.6 inches.
If 31 items are chosen at random, what is the probability that their mean length is greater than 10.5
inches?
(Round answer to four decimal places)
Math
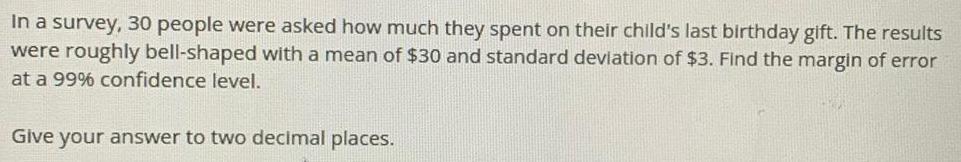
StatisticsIn a survey, 30 people were asked how much they spent on their child's last birthday gift. The results
were roughly bell-shaped with a mean of $30 and standard deviation of $3. Find the margin of error
at a 99% confidence level.
Give your answer to two decimal places.
Math
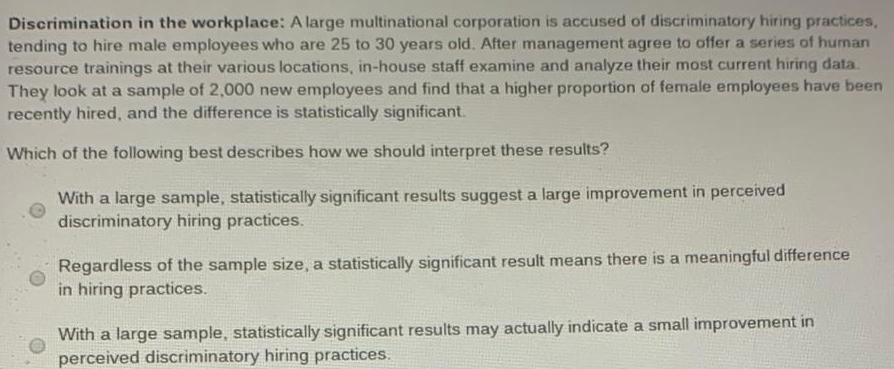
StatisticsDiscrimination in the workplace: A large multinational corporation is accused of discriminatory hiring practices,
tending to hire male employees who are 25 to 30 years old. After management agree to offer a series of human
resource trainings at their various locations, in-house staff examine and analyze their most current hiring data.
They look at a sample of 2,000 new employees and find that a higher proportion of female employees have been
recently hired, and the difference is statistically significant.
Which of the following best describes how we should interpret these results?
With a large sample, statistically significant results suggest a large improvement in perceived
discriminatory hiring practices.
Regardless of the sample size, a statistically significant result means there is a meaningful difference
in hiring practices.
With a large sample, statistically significant results may actually indicate a small improvement in
perceived discriminatory hiring practices.
Math
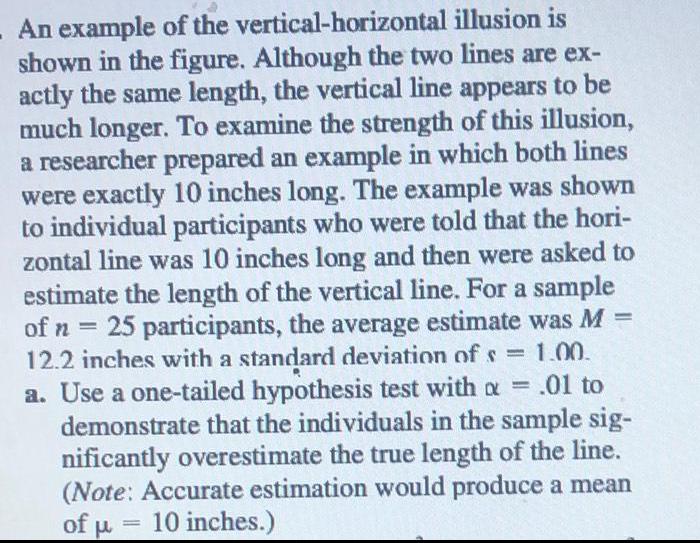
StatisticsAn example of the vertical-horizontal illusion is
shown in the figure. Although the two lines are ex-
actly the same length, the vertical line appears to be
much longer. To examine the strength of this illusion,
a researcher prepared an example in which both lines
were exactly 10 inches long. The example was shown
to individual participants who were told that the hori-
zontal line was 10 inches long and then were asked to
estimate the length of the vertical line. For a sample
of n = 25 participants, the average estimate was M
12.2 inches with a standard deviation of s = 1.00.
a. Use a one-tailed hypothesis test with a = .01 to
demonstrate that the individuals in the sample sig-
nificantly overestimate the true length of the line.
(Note: Accurate estimation would produce a mean
10 inches.)
of μ
=
=
Math
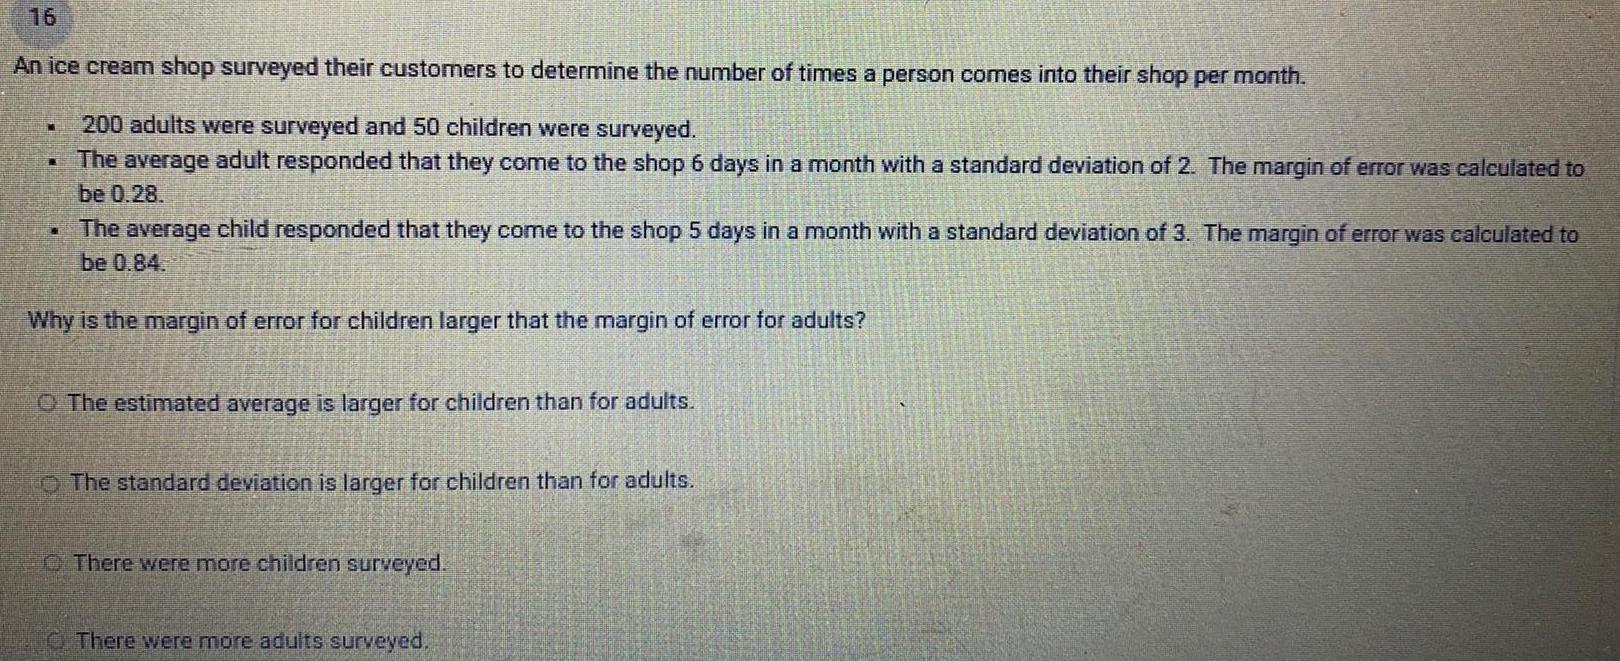
StatisticsAn ice cream shop surveyed their customers to determine the number of times a person comes into their shop per month.
200 adults were surveyed and 50 children were surveyed.
. The average adult responded that they come to the shop 6 days in a month with a standard deviation of 2. The margin of error was calculated to
be 0.28.
ME
The average child responded that they come to the shop 5 days in a month with a standard deviation of 3. The margin of error was calculated to
be 0.84.
Why is the margin of error for children larger that the margin of error for adults?
A
The estimated average is larger for children than for adults.
The standard deviation is larger for children than for adults.
There were more children surveyed.
There were more adults surveyed.
Math
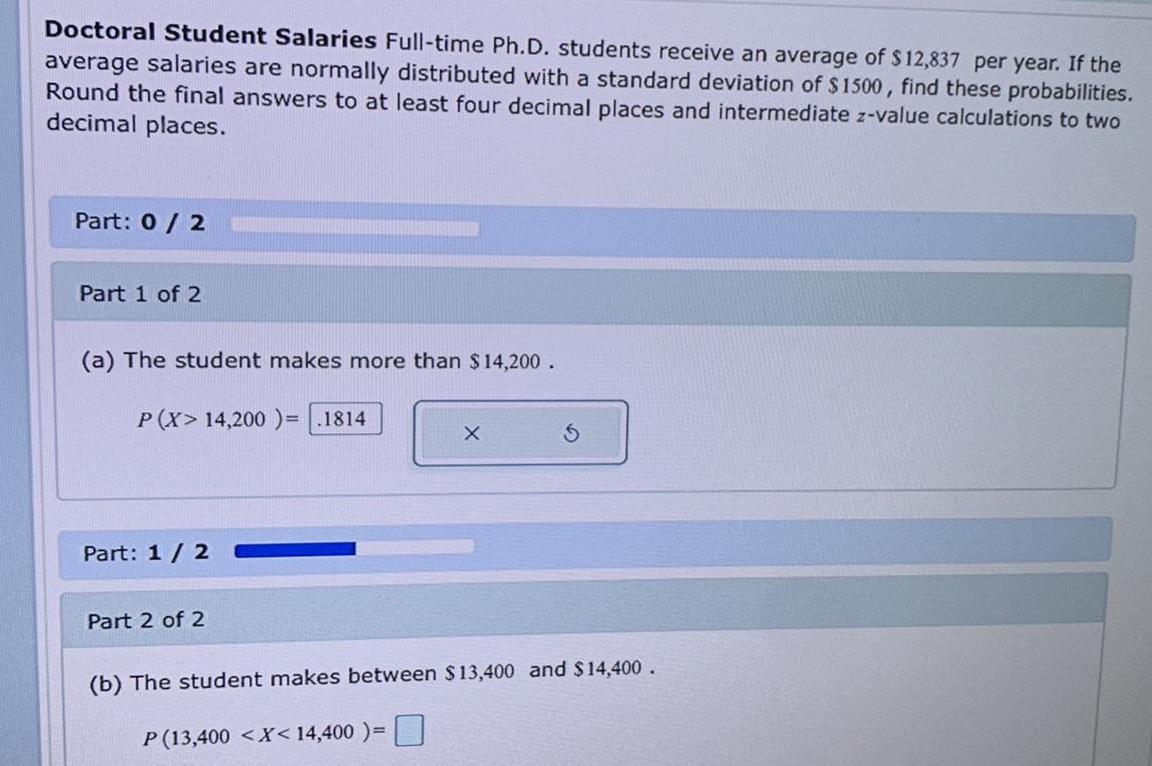
StatisticsDoctoral Student Salaries Full-time Ph.D. students receive an average of $12,837 per year. If the
average salaries are normally distributed with a standard deviation of $1500, find these probabilities.
Round the final answers to at least four decimal places and intermediate z-value calculations to two
decimal places.
Part: 0 / 2
Part 1 of 2
(a) The student makes more than $14,200.
P (X> 14,200 )= 1814
Part: 1 / 2
Part 2 of 2
X
P (13,400 < X < 14,400)=
S
(b) The student makes between $13,400 and $14,400.
Math
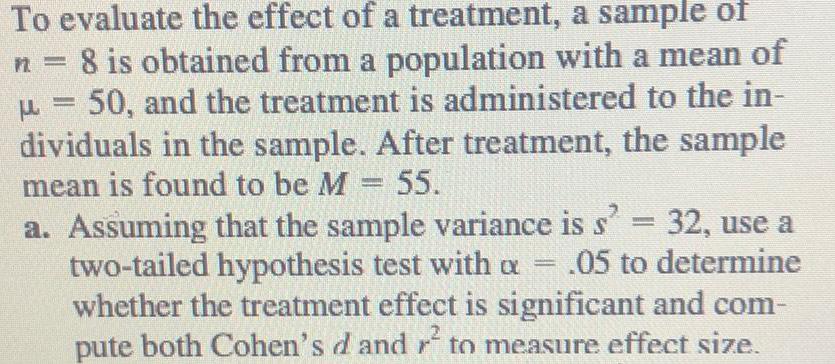
StatisticsTo evaluate the effect of a treatment, a sample of n = 8 is obtained from a population with a mean of µ = 50, and the treatment is administered to the individuals in the sample. After treatment, the sample mean is found to be M = 55.
a. Assuming that the sample variance is s² = 32, use a two-tailed hypothesis test with α = .05 to determine whether the treatment effect is significant and compute both Cohen's d and r^2 to measure effect size.
Math
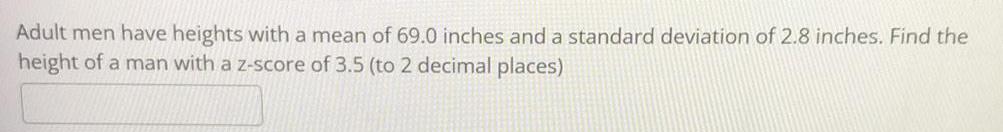
StatisticsAdult men have heights with a mean of 69.0 inches and a standard deviation of 2.8 inches. Find the height of a man with a z-score of 3.5 (to 2 decimal places)
Math
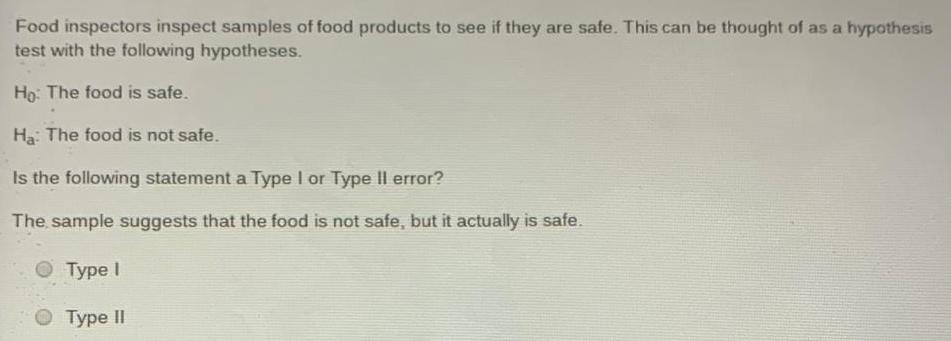
StatisticsFood inspectors inspect samples of food products to see if they are safe. This can be thought of as a hypothesis test with the following hypotheses.
Ho: The food is safe.
Ha: The food is not safe.
Is the following statement a Type I or Type II error?
The sample suggests that the food is not safe, but it actually is safe.
Type I
Type II
Math
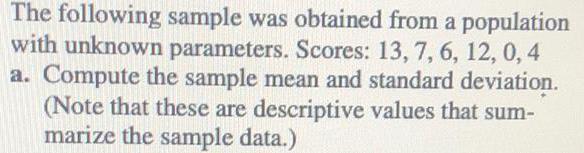
StatisticsThe following sample was obtained from a population with unknown parameters. Scores: 13, 7, 6, 12, 0, 4
a. Compute the sample mean and standard deviation. (Note that these are descriptive values that summarize the sample data.)
Math
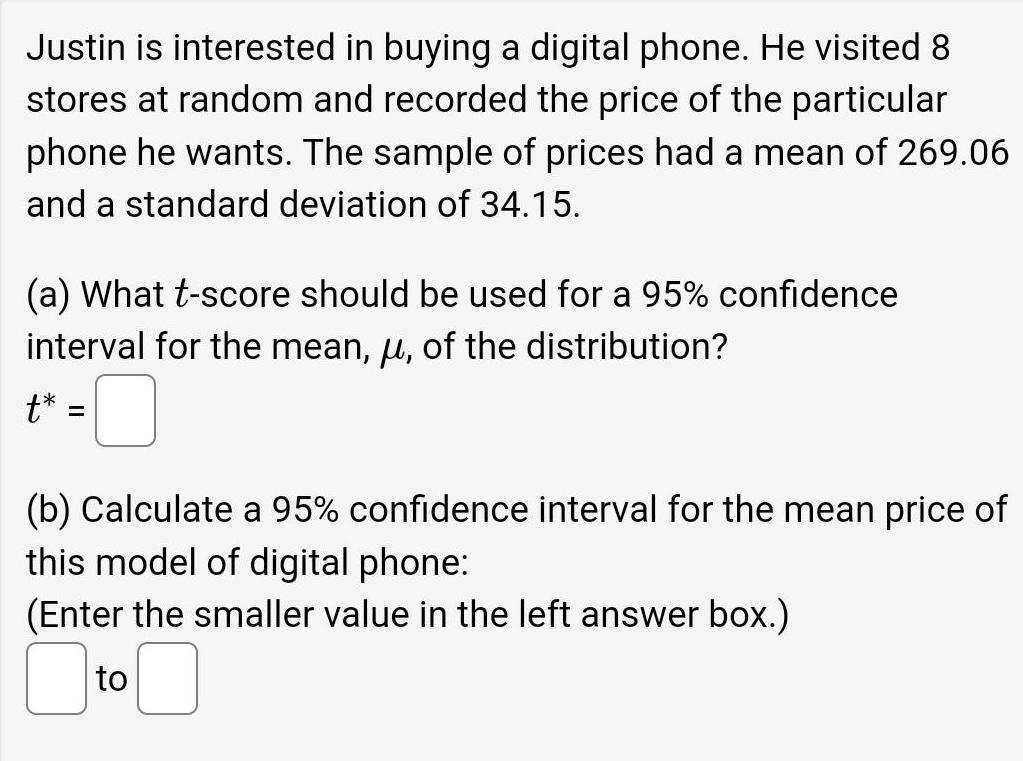
StatisticsJustin is interested in buying a digital phone. He visited 8
stores at random and recorded the price of the particular
phone he wants. The sample of prices had a mean of 269.06
and a standard deviation of 34.15.
(a) What t-score should be used for a 95% confidence
interval for the mean, μ, of the distribution?
t*
=
(b) Calculate a 95% confidence interval for the mean price of
this model of digital phone:
(Enter the smaller value in the left answer box.)
to
Math
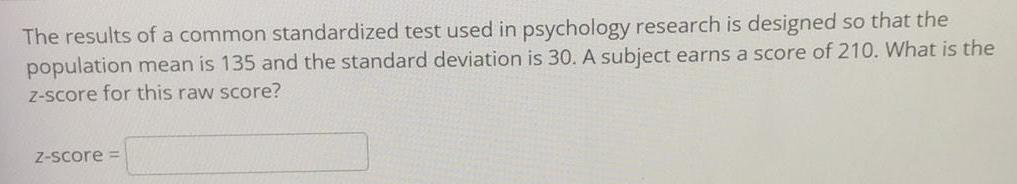
StatisticsThe results of a common standardized test used in psychology research is designed so that the
population mean is 135 and the standard deviation is 30. A subject earns a score of 210. What is the
z-score for this raw score?
Z-score =
Math
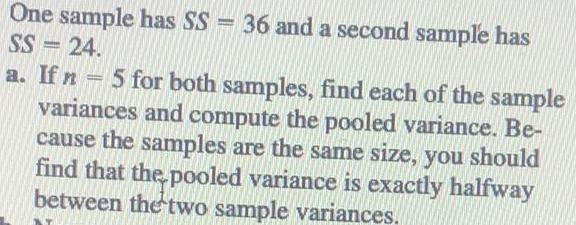
StatisticsOne sample has SS = 36 and a second sample has SS = 24.
a. If n - 5 for both samples, find each of the sample variances and compute the pooled variance. Be- cause the samples are the same size, you should find that the pooled variance is exactly halfway between the two sample variances.
Math
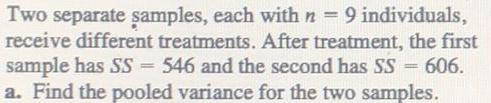
StatisticsTwo separate samples, each with n = 9 individuals, receive different treatments. After treatment, the first sample has SS = 546 and the second has SS = 606.
a. Find the pooled variance for the two samples.
Math
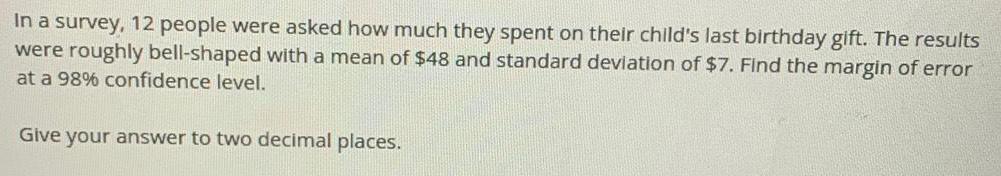
StatisticsIn a survey, 12 people were asked how much they spent on their child's last birthday gift. The results
were roughly bell-shaped with a mean of $48 and standard deviation of $7. Find the margin of error
at a 98% confidence level.
Give your answer to two decimal places.
Math
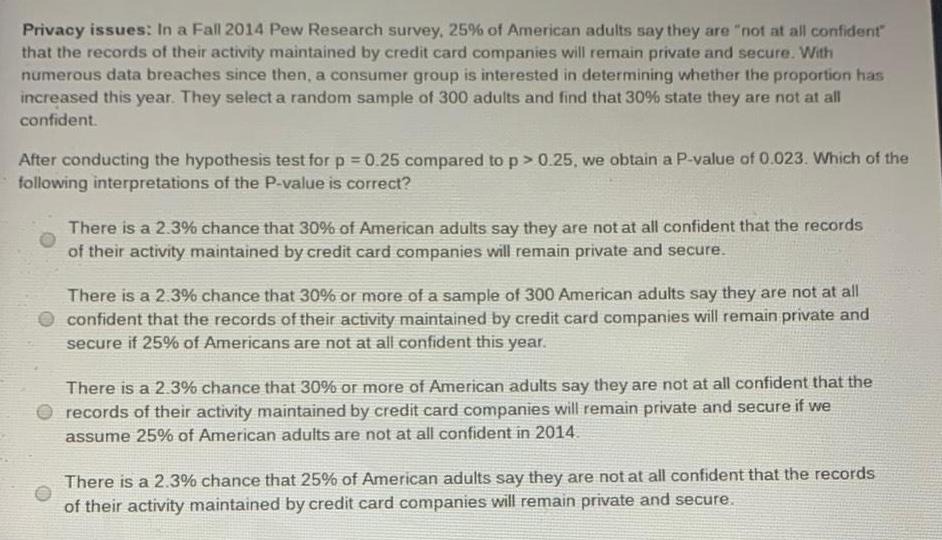
StatisticsPrivacy issues: In a Fall 2014 Pew Research survey, 25% of American adults say they are "not at all confident" that the records of their activity maintained by credit card companies will remain private and secure. With numerous data breaches since then, a consumer group is interested in determining whether the proportion has increased this year. They select a random sample of 300 adults and find that 30% state they are not at all confident.
After conducting the hypothesis test for p = 0.25 compared to p > 0.25, we obtain a P-value of 0.023. Which of the following interpretations of the P-value is correct?
There is a 2.3% chance that 30% of American adults say they are not at all confident that the records of their activity maintained by credit card companies will remain private and secure.
There is a 2.3% chance that 30% or more of a sample of 300 American adults say they are not at all confident that the records of their activity maintained by credit card companies will remain private and secure if 25% of Americans are not at all confident this year.
There is a 2.3% chance that 30% or more of American adults say they are not at all confident that the records of their activity maintained by credit card companies will remain private and secure if we assume 25% of American adults are not at all confident in 2014
There is a 2.3% chance that 25% of American adults say they are not at all confident that the records of their activity maintained by credit card companies will remain private and secure.
Math
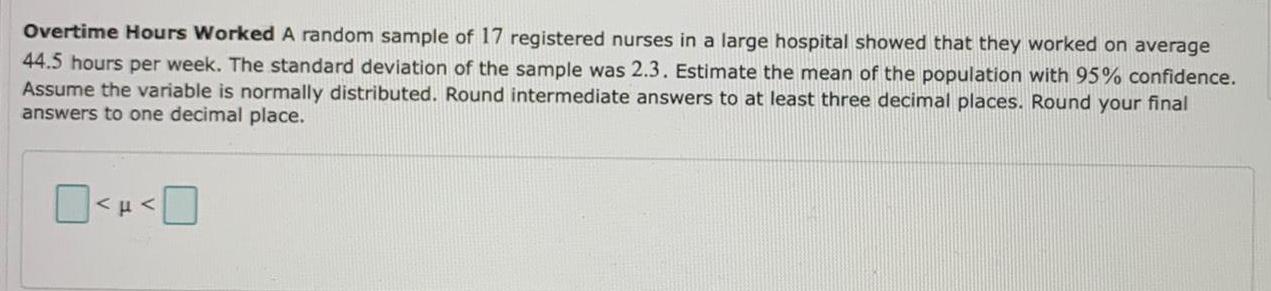
StatisticsOvertime Hours Worked A random sample of 17 registered nurses in a large hospital showed that they worked on average
44.5 hours per week. The standard deviation of the sample was 2.3. Estimate the mean of the population with 95% confidence.
Assume the variable is normally distributed. Round intermediate answers to at least three decimal places. Round your final
answers to one decimal place.
MFA
Math
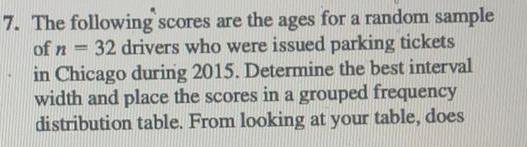
Statistics7. The following scores are the ages for a random sample
of n = 32 drivers who were issued parking tickets
in Chicago during 2015. Determine the best interval
width and place the scores in a grouped frequency
distribution table. From looking at your table, does
Math
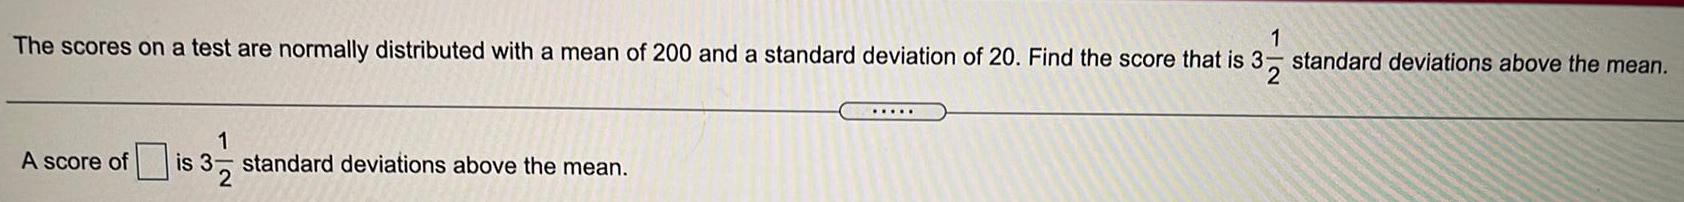
Statistics1
The scores on a test are normally distributed with a mean of 200 and a standard deviation of 20. Find the score that is 3;
32
A score of
1
is 3- standard deviations above the mean.
32
.……..
standard deviations above the mean.
Math
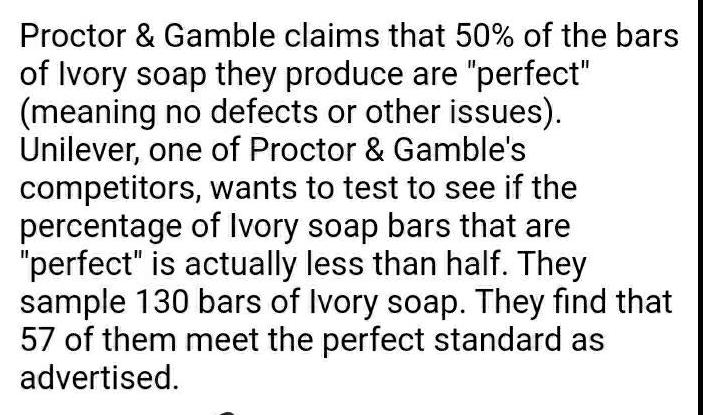
StatisticsProctor & Gamble claims that 50% of the bars of Ivory soap they produce are "perfect" (meaning no defects or other issues). Unilever, one of Proctor & Gamble's competitors, wants to test to see if the percentage of Ivory soap bars that are "perfect" is actually less than half. They sample 130 bars of Ivory soap. They find that 57 of them meet the perfect standard as advertised.
Math
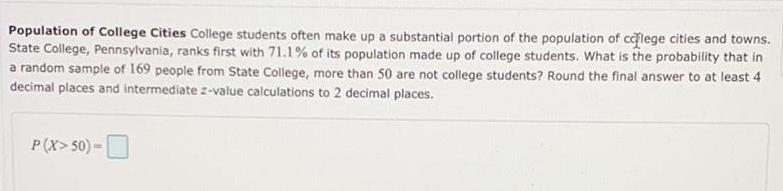
StatisticsPopulation of College Cities College students often make up a substantial portion of the population of college cities and towns.
State College, Pennsylvania, ranks first with 71.1% of its population made up of college students. What is the probability that in
a random sample of 169 people from State College, more than 50 are not college students? Round the final answer to at least 4
decimal places and intermediate z-value calculations to 2 decimal places.
P(X>50)-
Math
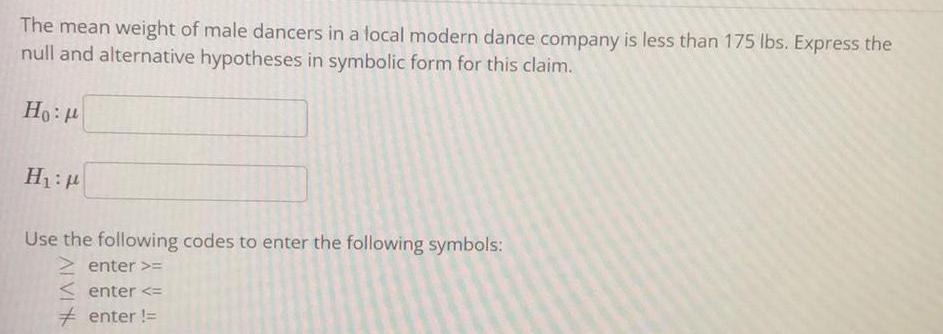
StatisticsThe mean weight of male dancers in a local modern dance company is less than 175 lbs. Express the null and alternative hypotheses in symbolic form for this claim.
Ho:
H₁:
Math
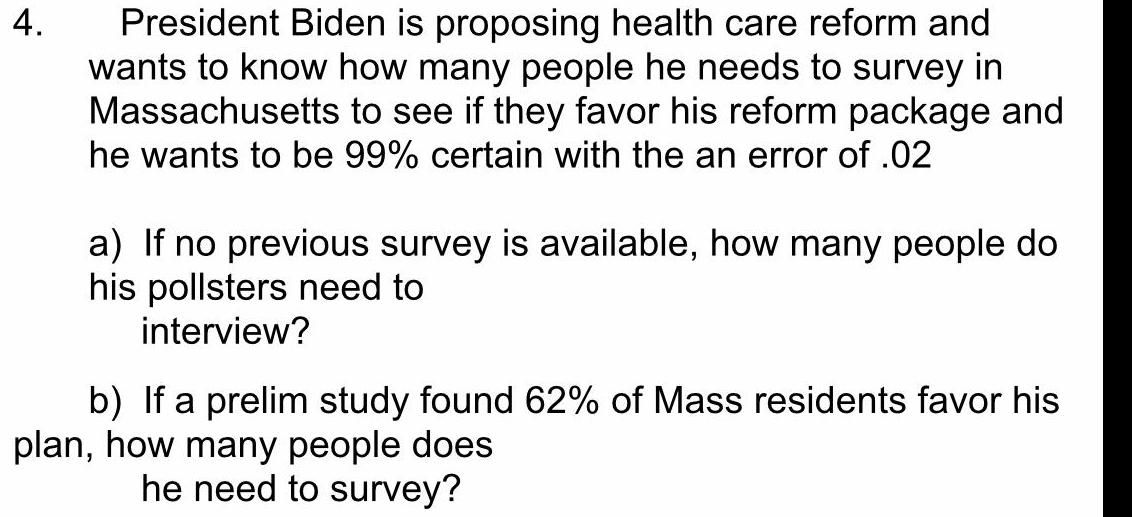
StatisticsPresident Biden is proposing health care reform and wants to know how many people he needs to survey in Massachusetts to see if they favor his reform package and he wants to be 99% certain with the an error of .02
a) If no previous survey is available, how many people do his pollsters need to interview?
b) If a prelim study found 62% of Mass residents favor his plan, how many people does he need to survey?
Math
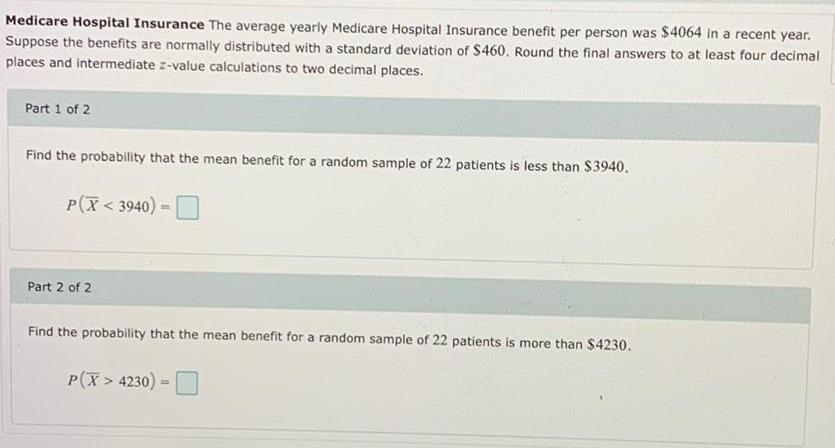
StatisticsMedicare Hospital Insurance The average yearly Medicare Hospital Insurance benefit per person was $4064 in a recent year.
Suppose the benefits are normally distributed with a standard deviation of $460. Round the final answers to at least four decimal
places and intermediate z-value calculations to two decimal places.
Part 1 of 2
Find the probability that the mean benefit for a random sample of 22 patients is less than $3940.
P(X<3940) =
Part 2 of 2
Find the probability that the mean benefit for a random sample of 22 patients is more than $4230.
P(X> 4230) =
Math
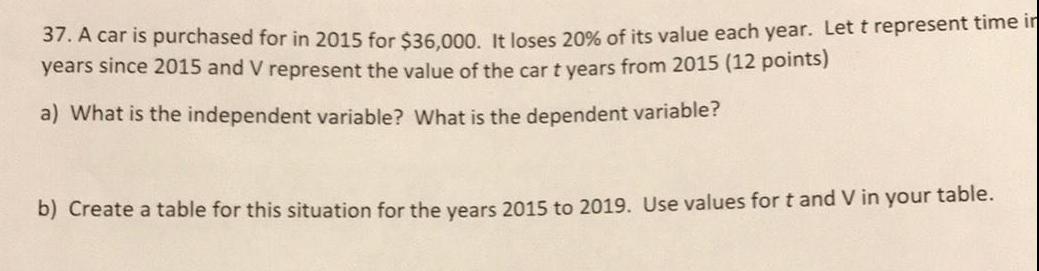
Statistics37. A car is purchased for in 2015 for $36,000. It loses 20% of its value each year. Let t represent time in years since 2015 and V represent the value of the car t years from 2015 (12 points)
a) What is the independent variable? What is the dependent variable?
b) Create a table for this situation for the years 2015 to 2019. Use values for t and V in your table.
![2. [10 points] Consider the following multiple regressions:
y = a + β₁x₁ + β₂x₂ + u
y = a + β₁x₁ + β₂x₂ + β3x3 + E
Can the two regression have the same R^2? Can they have the same
Adjusted R^2? [Explain your reasoning]](https://media.kunduz.com/media/sug-question/raw/61647552-1657384826.5306902.jpeg?w=256)
Math
Statistics2. [10 points] Consider the following multiple regressions:
y = a + β₁x₁ + β₂x₂ + u
y = a + β₁x₁ + β₂x₂ + β3x3 + E
Can the two regression have the same R^2? Can they have the same
Adjusted R^2? [Explain your reasoning]