Statistics Questions and Answers
Math
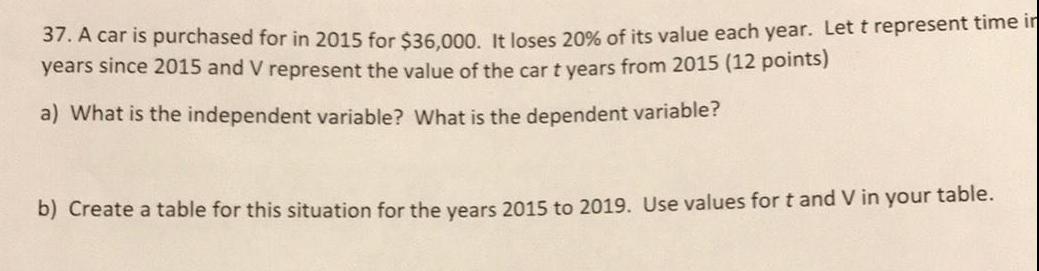
Statistics37. A car is purchased for in 2015 for $36,000. It loses 20% of its value each year. Let t represent time in years since 2015 and V represent the value of the car t years from 2015 (12 points)
a) What is the independent variable? What is the dependent variable?
b) Create a table for this situation for the years 2015 to 2019. Use values for t and V in your table.
![2. [10 points] Consider the following multiple regressions:
y = a + β₁x₁ + β₂x₂ + u
y = a + β₁x₁ + β₂x₂ + β3x3 + E
Can the two regression have the same R^2? Can they have the same
Adjusted R^2? [Explain your reasoning]](https://media.kunduz.com/media/sug-question/raw/61647552-1657384826.5306902.jpeg?w=256)
Math
Statistics2. [10 points] Consider the following multiple regressions:
y = a + β₁x₁ + β₂x₂ + u
y = a + β₁x₁ + β₂x₂ + β3x3 + E
Can the two regression have the same R^2? Can they have the same
Adjusted R^2? [Explain your reasoning]
Math
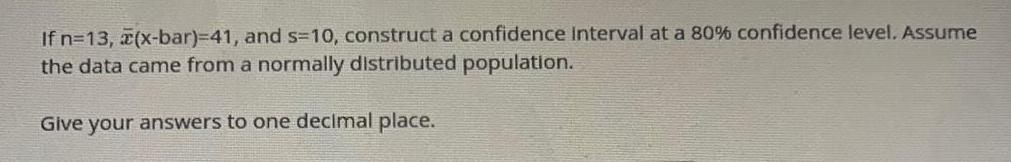
StatisticsIf n=13, x(x-bar)=41, and s=10, construct a confidence interval at a 80% confidence level. Assume the data came from a normally distributed population.
Give your answers to one decimal place.
Math
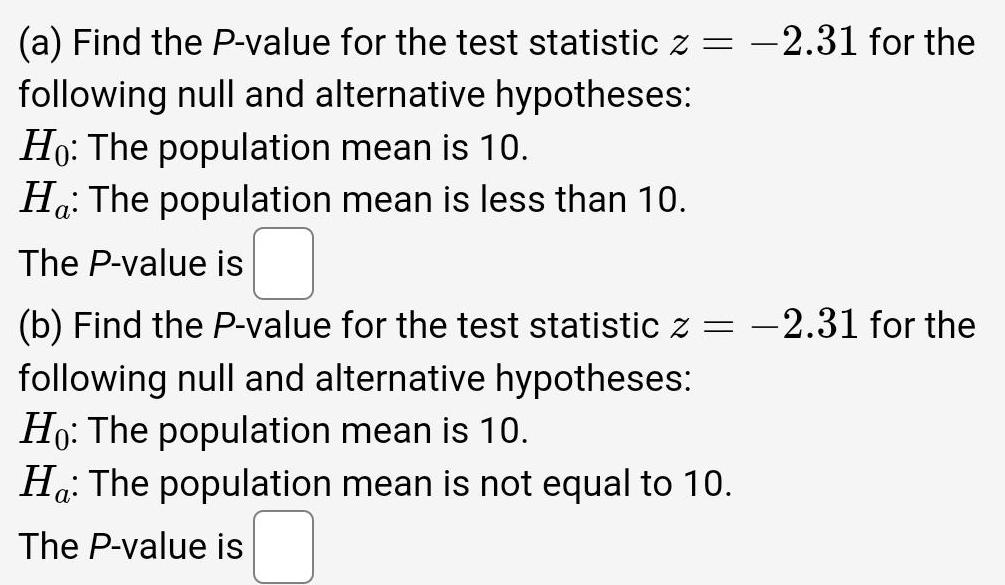
Statistics(a) Find the P-value for the test statistic z = -2.31 for the following null and alternative hypotheses:
Ho: The population mean is 10.
Ha: The population mean is less than 10.
The P-value is
(b) Find the P-value for the test statistic z = -2.31 for the following null and alternative hypotheses:
Ho: The population mean is 10.
Ha: The population mean is not equal to 10.
The P-value is
Math
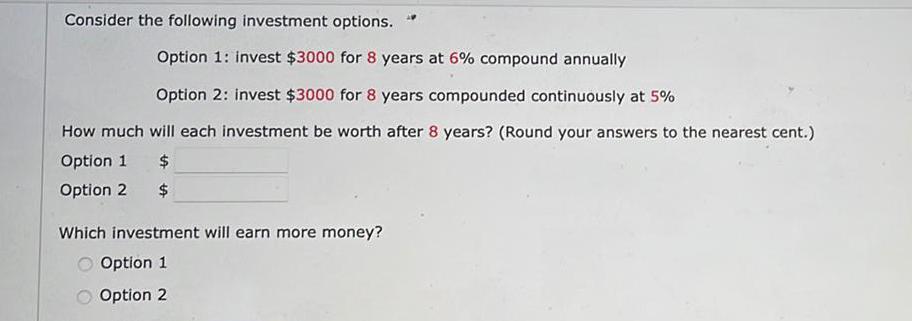
StatisticsConsider the following investment options.
Option 1: invest $3000 for 8 years at 6% compound annually
Option 2: invest $3000 for 8 years compounded continuously at 5%
How much will each investment be worth after 8 years? (Round your answers to the nearest cent.)
Option 1 $
Option 2 $
Which investment will earn more money?
O Option 1
Option 2
Math
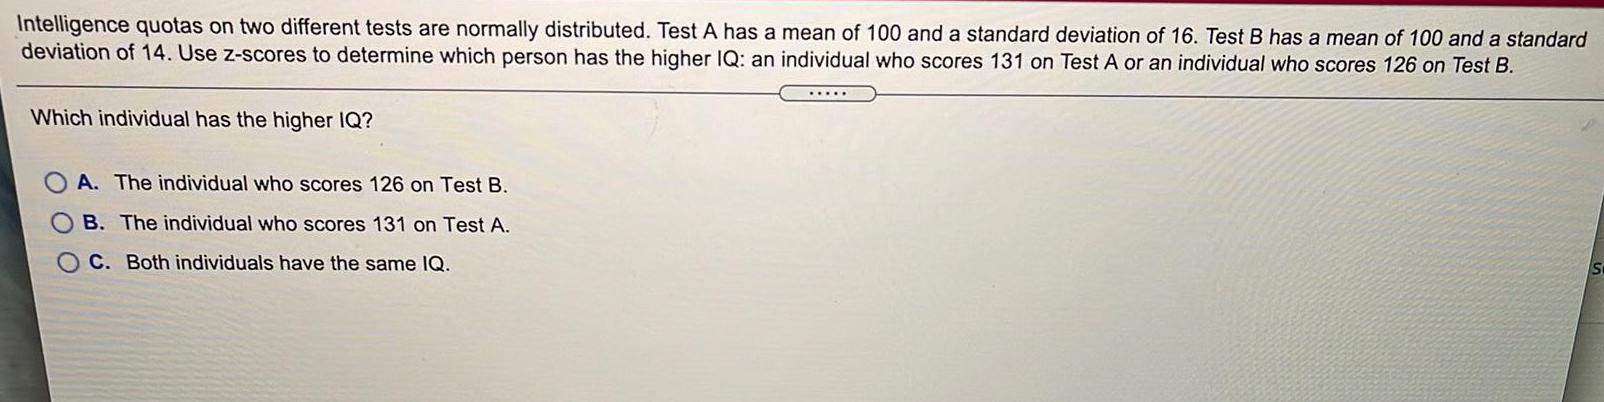
StatisticsIntelligence quotas on two different tests are normally distributed. Test A has a mean of 100 and a standard deviation of 16. Test B has a mean of 100 and a standard
deviation of 14. Use z-scores to determine which person has the higher IQ: an individual who scores 131 on Test A or an individual who scores 126 on Test B.
Which individual has the higher IQ?
A. The individual who scores 126 on Test B.
B. The individual who scores 131 on Test A.
C. Both individuals have the same IQ.
.....
St
Math
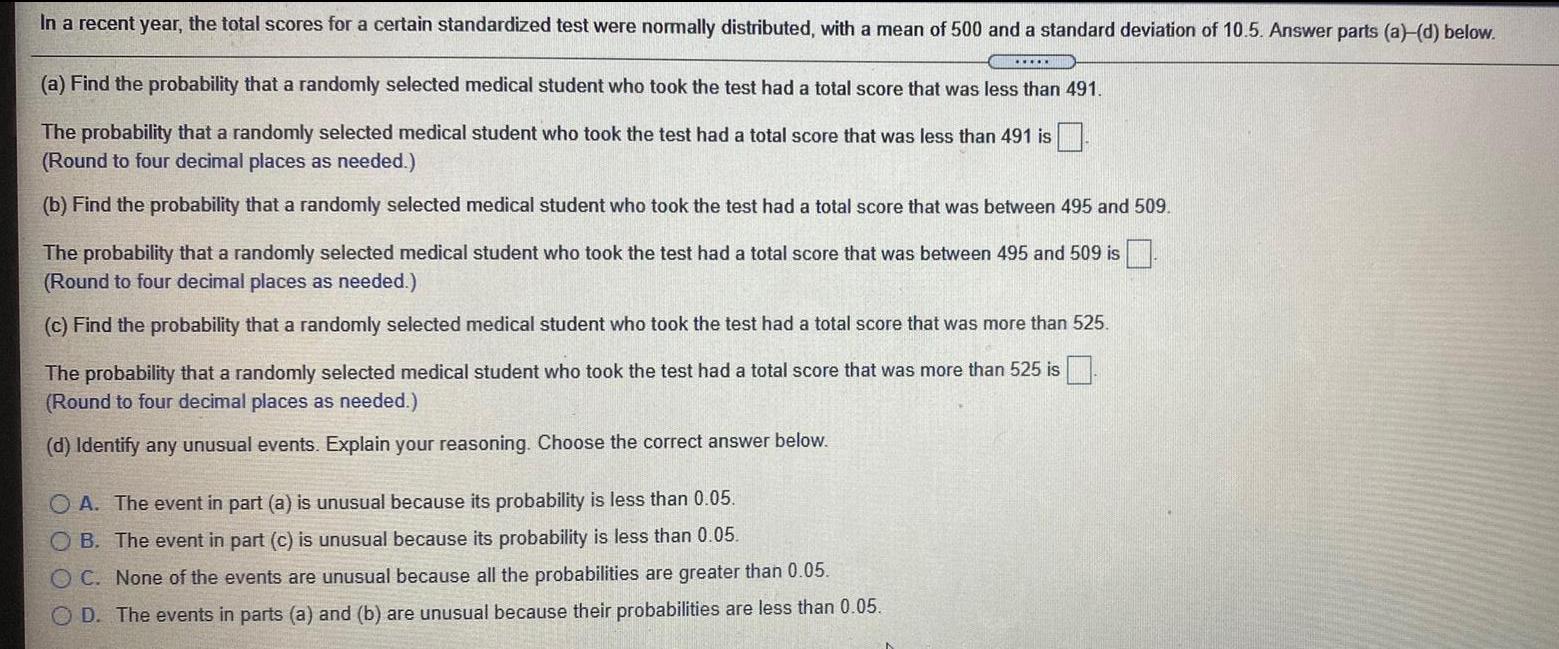
StatisticsIn a recent year, the total scores for a certain standardized test were normally distributed, with a mean of 500 and a standard deviation of 10.5. Answer parts (a)-(d) below.
(a) Find the probability that a randomly selected medical student who took the test had a total score that was less than 491.
The probability that a randomly selected medical student who took the test had a total score that was less than 491 is
(Round to four decimal places as needed.)
(b) Find the probability that a randomly selected medical student who took the test had a total score that was between 495 and 509.
The probability that a randomly selected medical student who took the test had a total score that was between 495 and 509 is
(Round to four decimal places as needed.)
(c) Find the probability that a randomly selected medical student who took the test had a total score that was more than 525.
The probability that a randomly selected medical student who took the test had a total score that was more than 525 is
(Round to four decimal places as needed.)
(d) Identify any unusual events. Explain your reasoning. Choose the correct answer below.
A. The event in part (a) is unusual because its probability is less than 0.05.
B. The event in part (c) is unusual because its probability is less than 0.05.
C. None of the events are unusual because all the probabilities are greater than 0.05.
D. The events in parts (a) and (b) are unusual because their probabilities are less than 0.05.
Math
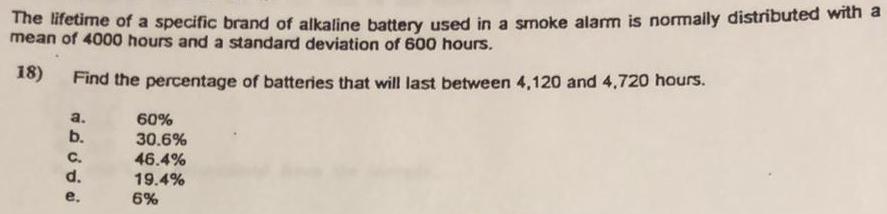
StatisticsThe lifetime of a specific brand of alkaline battery used in a smoke alarm is normally distributed with a mean of 4000 hours and a standard deviation of 600 hours.
Find the percentage of batteries that will last between 4,120 and 4,720 hours.
a. 60%
b. 30.6%
c. 46.4%
d. 19.4%
e. 6%
Math
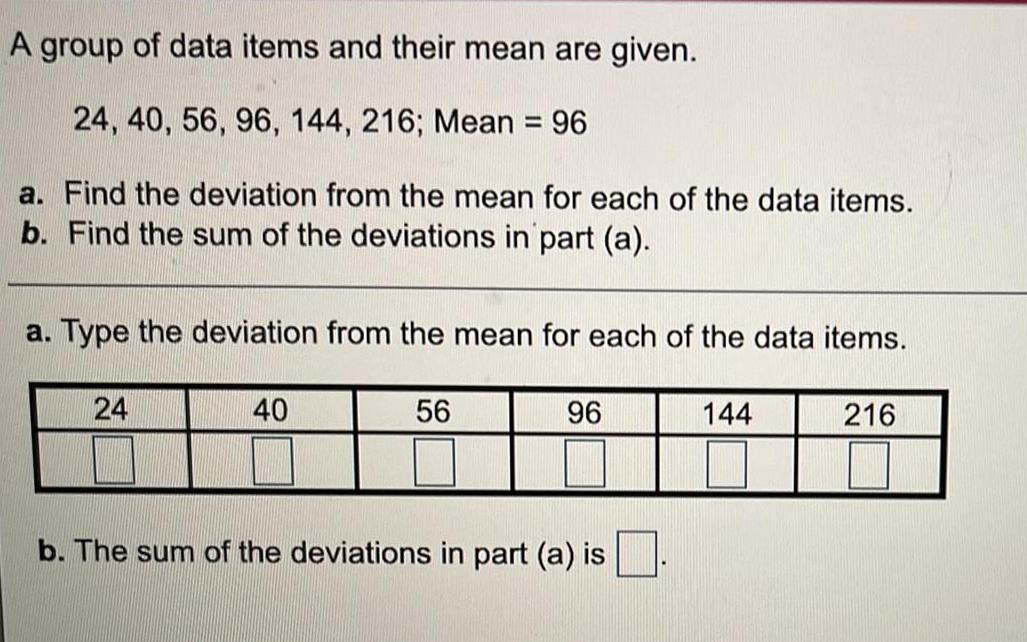
StatisticsA group of data items and their mean are given.
24, 40, 56, 96, 144, 216; Mean = 96
a. Find the deviation from the mean for each of the data items.
b. Find the sum of the deviations in part (a).
a. Type the deviation from the mean for each of the data items.
24
40
56
96
b. The sum of the deviations in part (a) is
144
216
Math
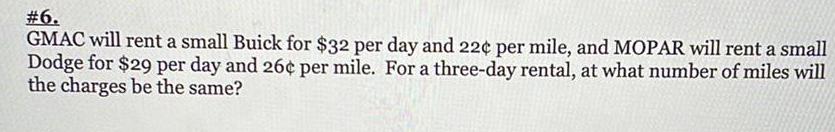
Statistics#6.
GMAC will rent a small Buick for $32 per day and 22¢ per mile, and MOPAR will rent a small
Dodge for $29 per day and 26¢ per mile. For a three-day rental, at what number of miles will
the charges be the same?
Math
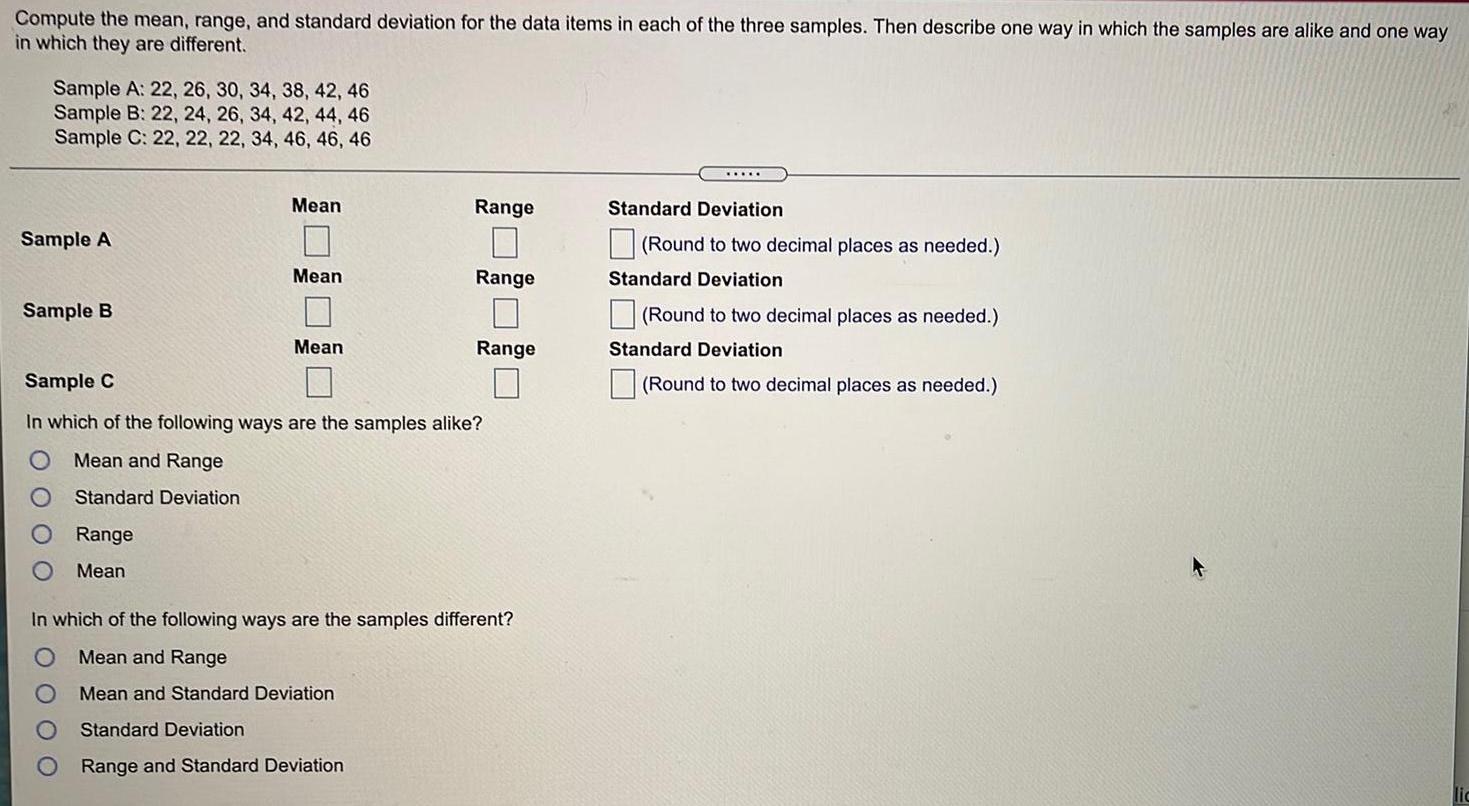
StatisticsCompute the mean, range, and standard deviation for the data items in each of the three samples. Then describe one way in which the samples are alike and one way
in which they are different.
Sample A: 22, 26, 30, 34, 38, 42, 46
Sample B: 22, 24, 26, 34, 42, 44, 46
Sample C: 22, 22, 22, 34, 46, 46, 46
In which of the following ways are the samples alike?
Mean and Range
Standard Deviation
Range
Mean
In which of the following ways are the samples different?
Mean and Range
Mean and Standard Deviation
Standard Deviation
Range and Standard Deviation
Math
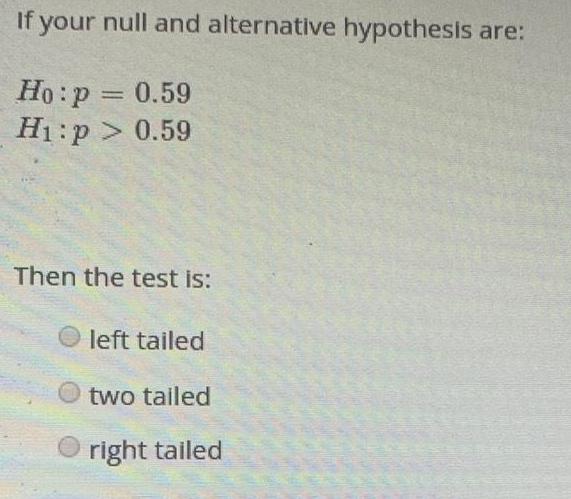
StatisticsIf your null and alternative hypothesis are:
Ho: p = 0.59
H₁: p> 0.59
Then the test is:
left tailed
two tailed
right tailed
Math
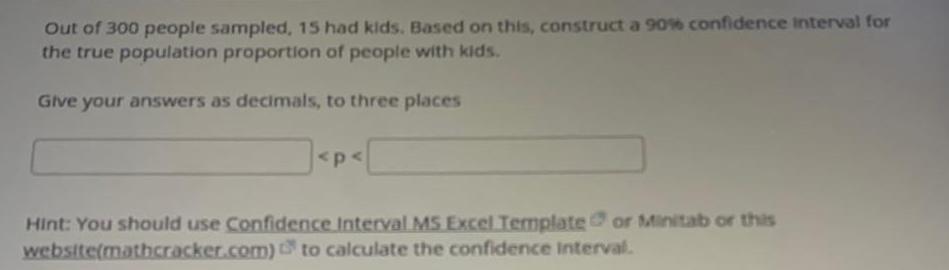
StatisticsOut of 300 people sampled, 15 had kids. Based on this, construct a 90% confidence interval for the true population proportion of people with kids.
Give your answers as decimals, to three places
...<p<...
Math
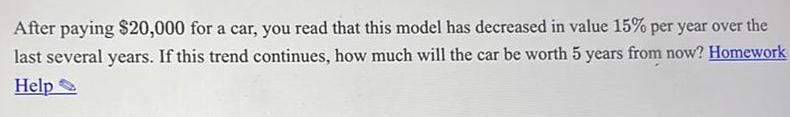
StatisticsAfter paying $20,000 for a car, you read that this model has decreased in value 15% per year over the last several years. If this trend continues, how much will the car be worth 5 years from now?
Math
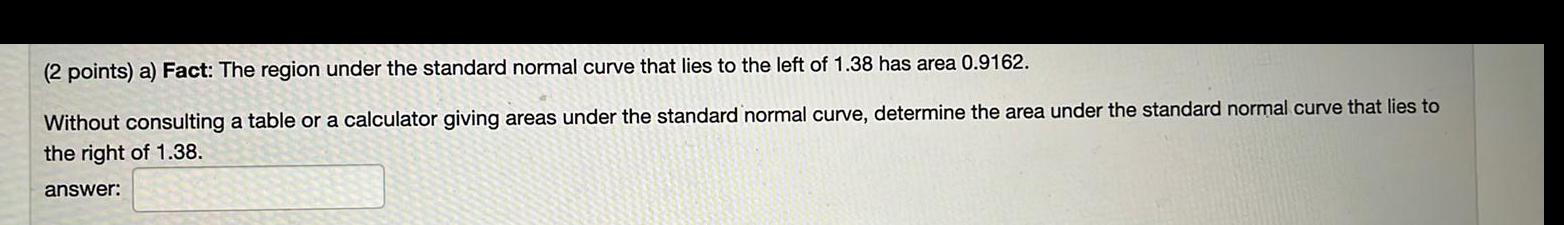
Statistics(2 points) a) Fact: The region under the standard normal curve that lies to the left of 1.38 has area 0.9162.
Without consulting a table or a calculator giving areas under the standard normal curve, determine the area under the standard normal curve that lies to
the right of 1.38.
answer:
Math
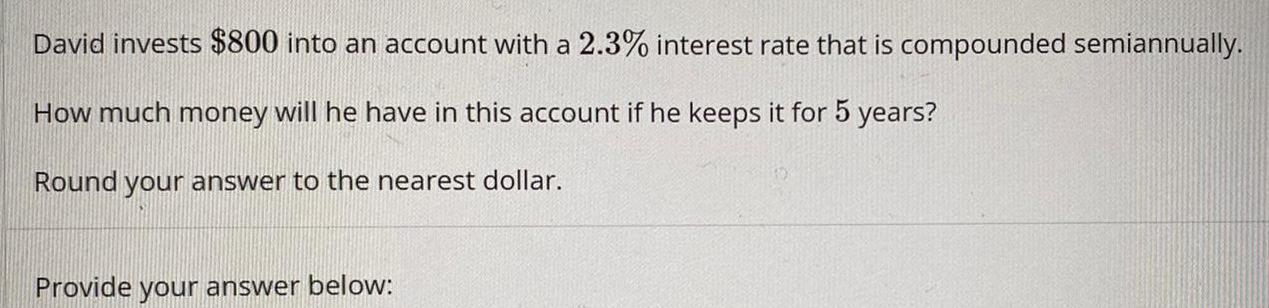
StatisticsDavid invests $800 into an account with a 2.3% interest rate that is compounded semiannually.
How much money will he have in this account if he keeps it for 5 years?
Round your answer to the nearest dollar.
Math
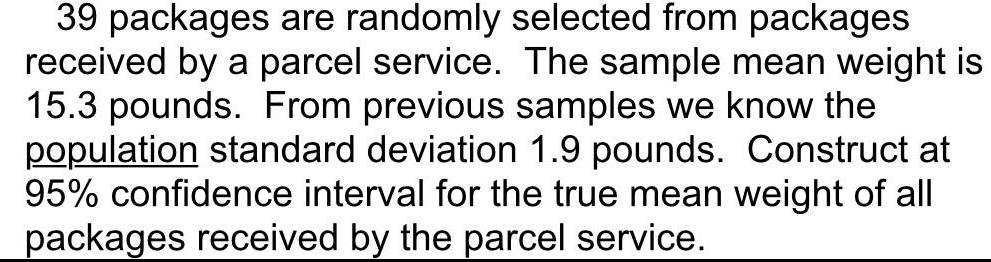
Statistics39 packages are randomly selected from packages
received by a parcel service. The sample mean weight is 15.3 pounds. From previous samples we know the
population standard deviation 1.9 pounds. Construct at 95% confidence interval for the true mean weight of all packages received by the parcel service.
Math
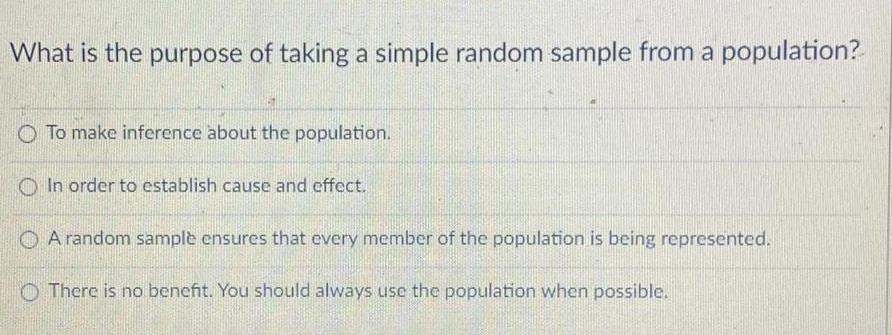
StatisticsWhat is the purpose of taking a simple random sample from a population?
To make inference about the population.
In order to establish cause and effect.
A random samplè ensures that every member of the population is being represented.
There is no benefit. You should always use the population when possible.
Math
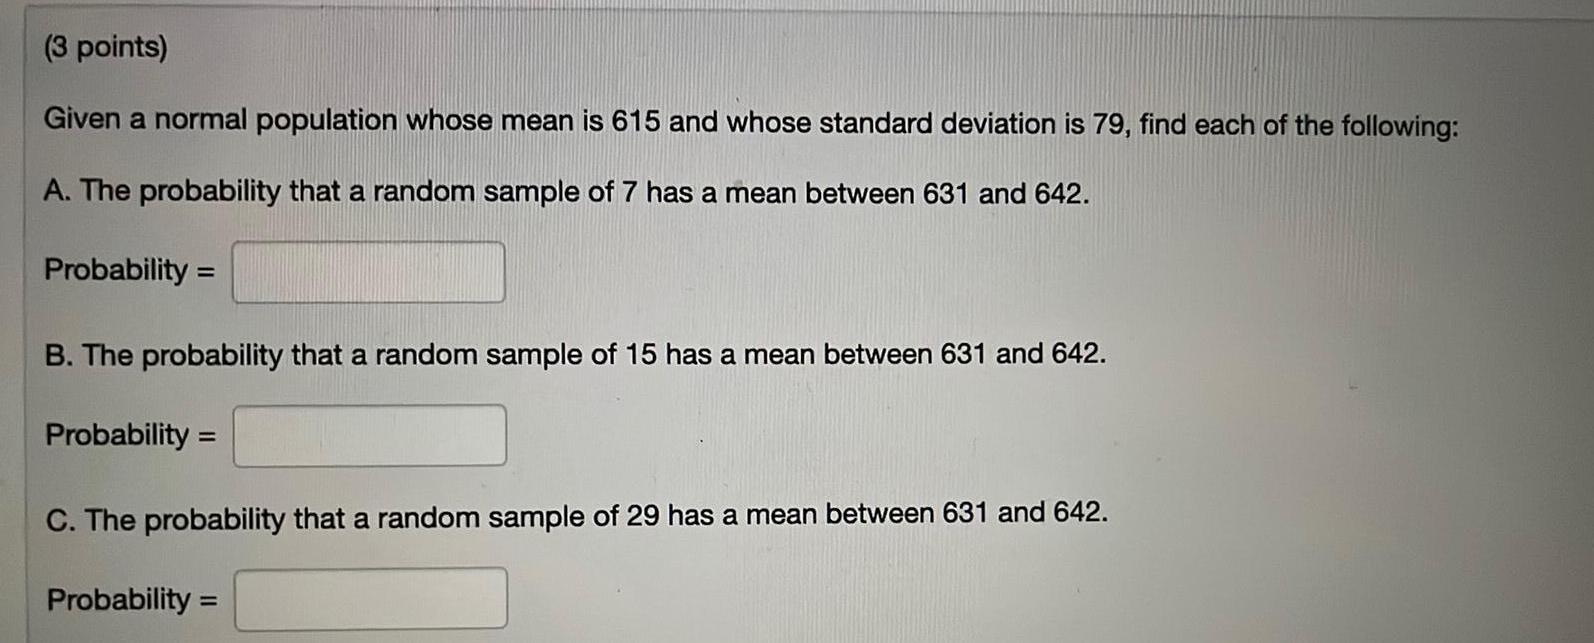
StatisticsGiven a normal population whose mean is 615 and whose standard deviation is 79, find each of the following:
A. The probability that a random sample of 7 has a mean between 631 and 642.
Probability =
B. The probability that a random sample of 15 has a mean between 631 and 642.
Probability =
C. The probability that a random sample of 29 has a mean between 631 and 642.
Probability =
Math
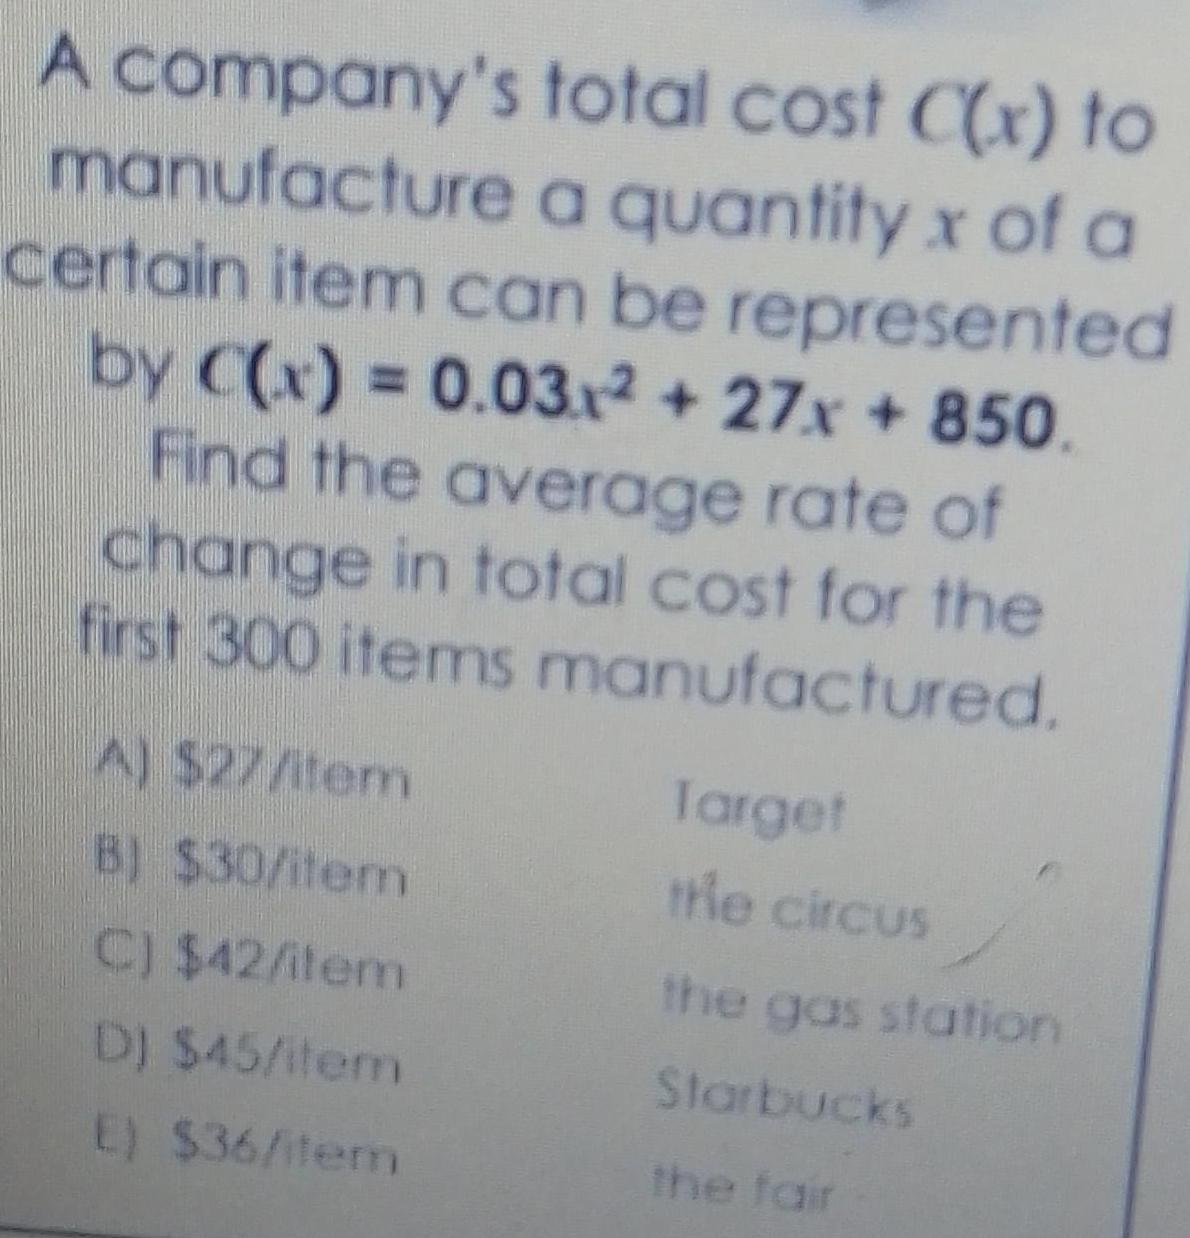
StatisticsA company's total cost C(x) to manufacture a quantity x of a certain item can be represented by C(x) = 0.03x² + 27x + 850. Find the average rate of change in total cost for the first 300 items manufactured.
A) $27/item Target
B) $30/item the circus
C) $42/item the gas station
D) $45/item Starbucks
E) $36/item the fair
Math
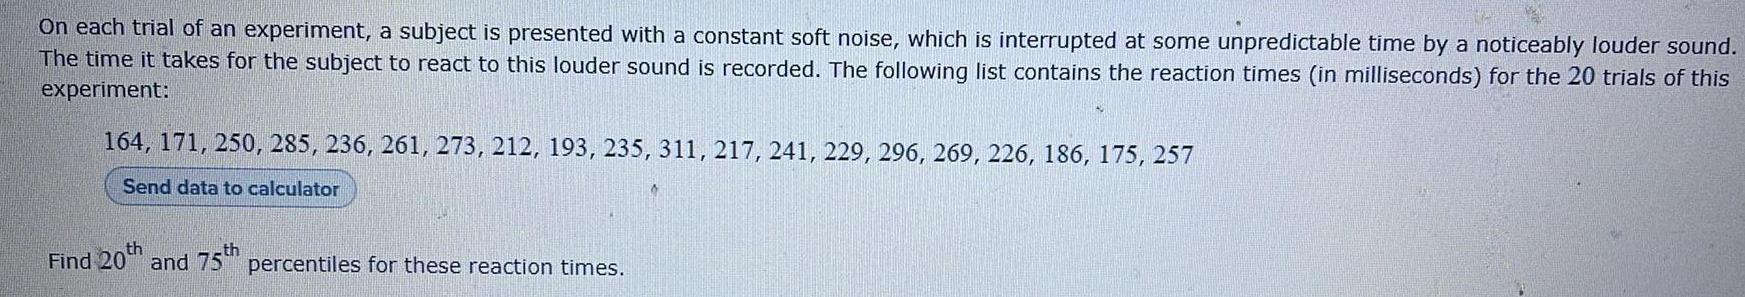
StatisticsOn each trial of an experiment, a subject is presented with a constant soft noise, which is interrupted at some unpredictable time by a noticeably louder sound. The time it takes for the subject to react to this louder sound is recorded. The following list contains the reaction times (in milliseconds) for the 20 trials of this experiment:
164, 171, 250, 285, 236, 261, 273, 212, 193, 235, 311, 217, 241, 229, 296, 269, 226, 186, 175, 257
Find 20th and 75th percentiles for these reaction times.
Math
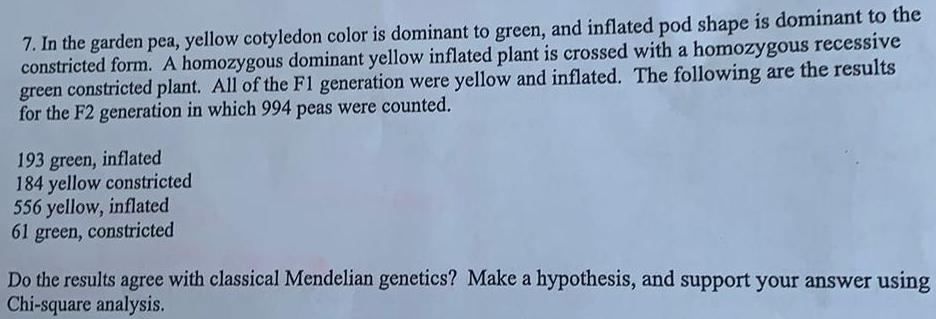
Statistics7. In the garden pea, yellow cotyledon color is dominant to green, and inflated pod shape is dominant to the
constricted form. A homozygous dominant yellow inflated plant is crossed with a homozygous recessive
green constricted plant. All of the F1 generation were yellow and inflated. The following are the results
for the F2 generation in which 994 peas were counted.
193 green, inflated
184 yellow constricted
556 yellow, inflated
61 green, constricted
Do the results agree with classical Mendelian genetics? Make a hypothesis, and support your answer using
Chi-square analysis.
Math
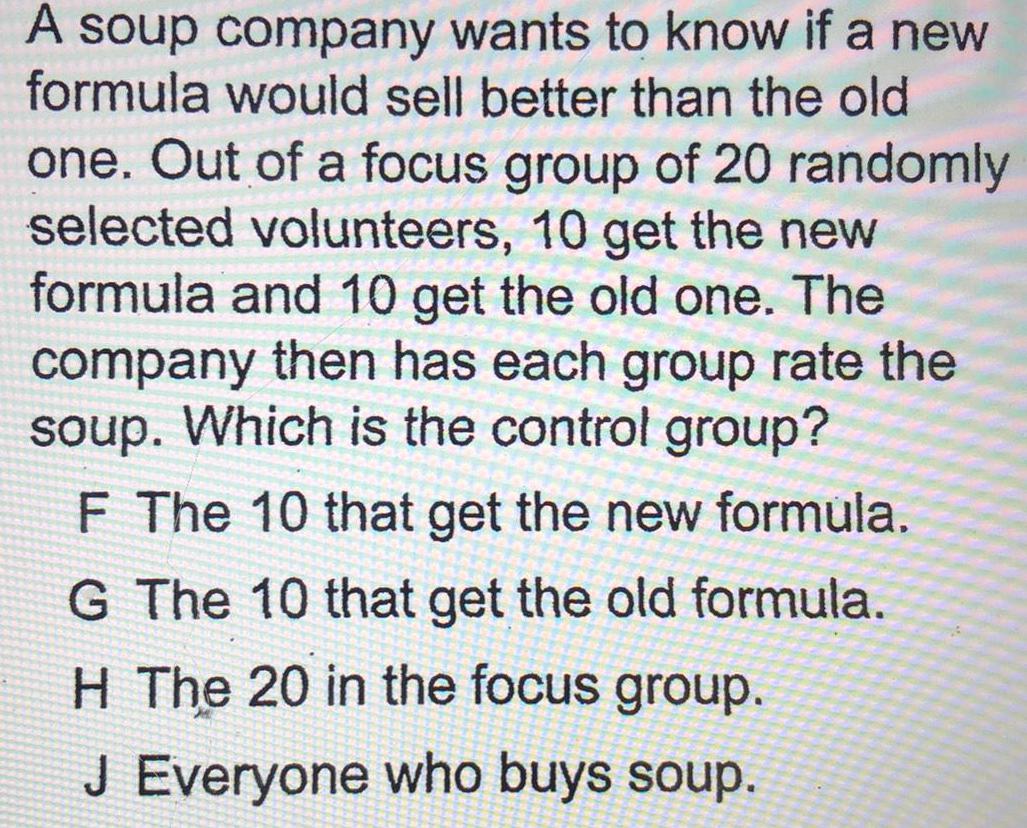
StatisticsA soup company wants to know if a new
formula would sell better than the old
one. Out of a focus group of 20 randomly
selected volunteers, 10 get the new
formula and 10 get the old one. The
company then has each group rate the
soup. Which is the control group?
F The 10 that get the new formula.
G The 10 that get the old formula.
H The 20 in the focus group.
J Everyone who buys soup.
Math
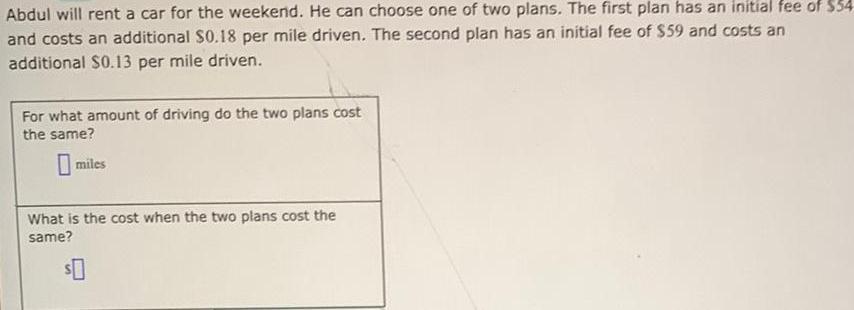
StatisticsAbdul will rent a car for the weekend. He can choose one of two plans. The first plan has an initial fee of $54
and costs an additional $0.18 per mile driven. The second plan has an initial fee of $59 and costs an
additional $0.13 per mile driven.
For what amount of driving do the two plans cost
the same?
miles
What is the cost when the two plans cost the
same?
$0
Math
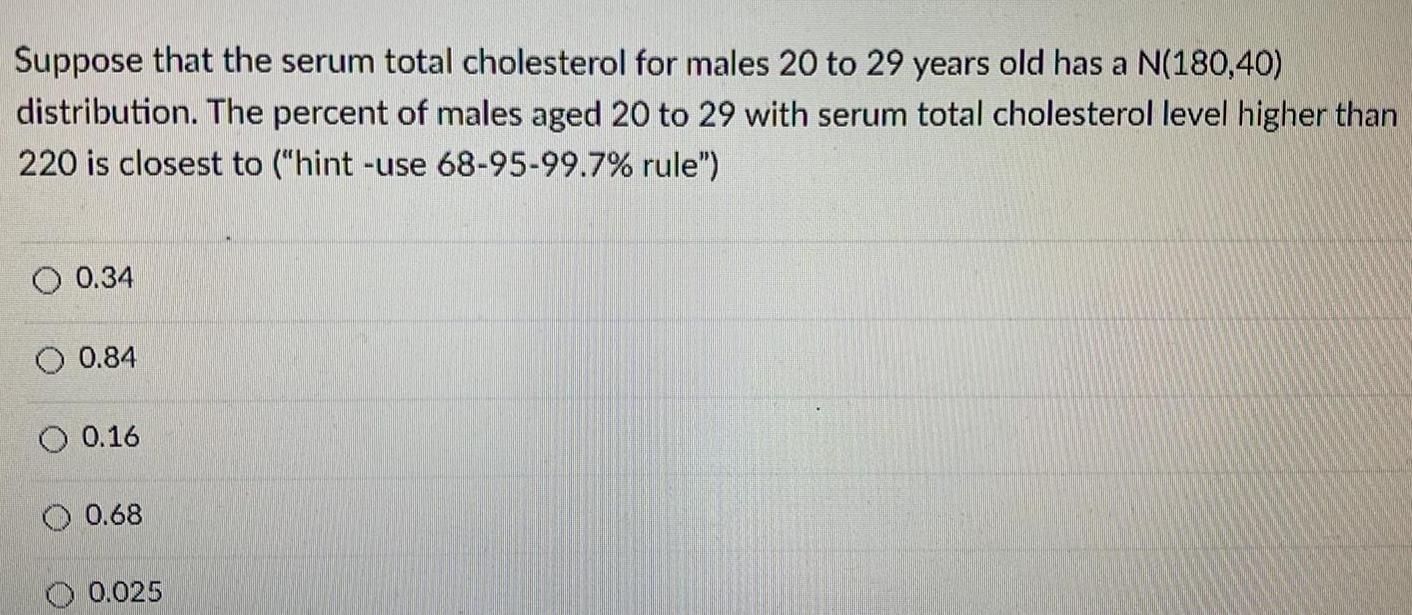
StatisticsSuppose that the serum total cholesterol for males 20 to 29 years old has a N(180,40)
distribution. The percent of males aged 20 to 29 with serum total cholesterol level higher than
220 is closest to ("hint -use 68-95-99.7% rule")
O 0.34
0.84
O 0.16
0.68
0.025
Math
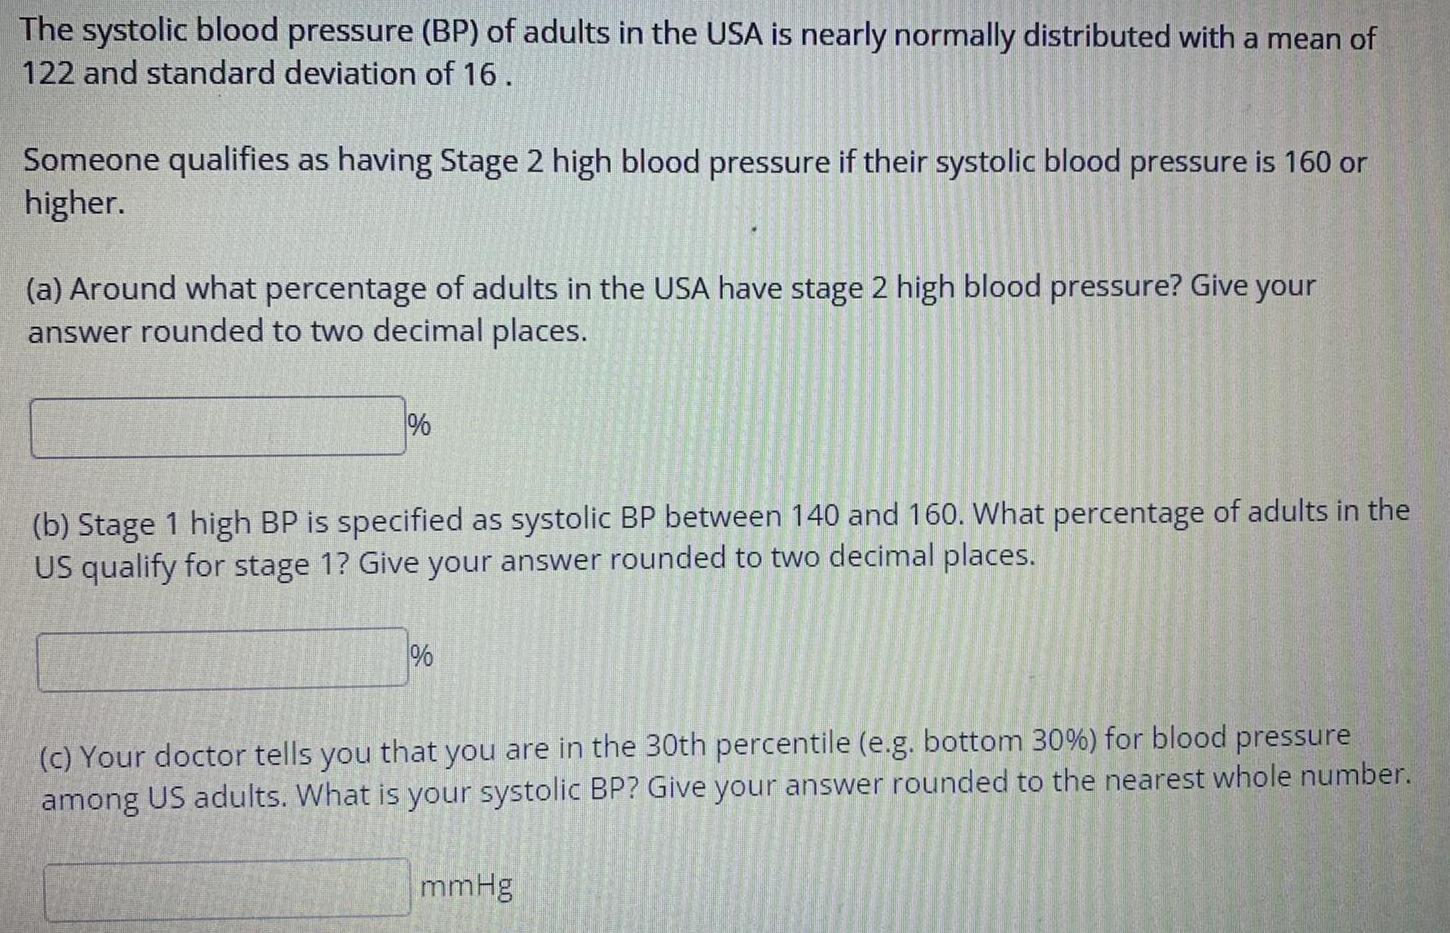
StatisticsThe systolic blood pressure (BP) of adults in the USA is nearly normally distributed with a mean of
122 and standard deviation of 16.
Someone qualifies as having Stage 2 high blood pressure if their systolic blood pressure is 160 or
higher.
(a) Around what percentage of adults in the USA have stage 2 high blood pressure? Give your
answer rounded to two decimal places.
%
(b) Stage 1 high BP is specified as systolic BP between 140 and 160. What percentage of adults in the
US qualify for stage 1? Give your answer rounded to two decimal places.
%
(c) Your doctor tells you that you are in the 30th percentile (e.g. bottom 30%) for blood pressure
among US adults. What is your systolic BP? Give your answer rounded to the nearest whole number.
mmHg
Math
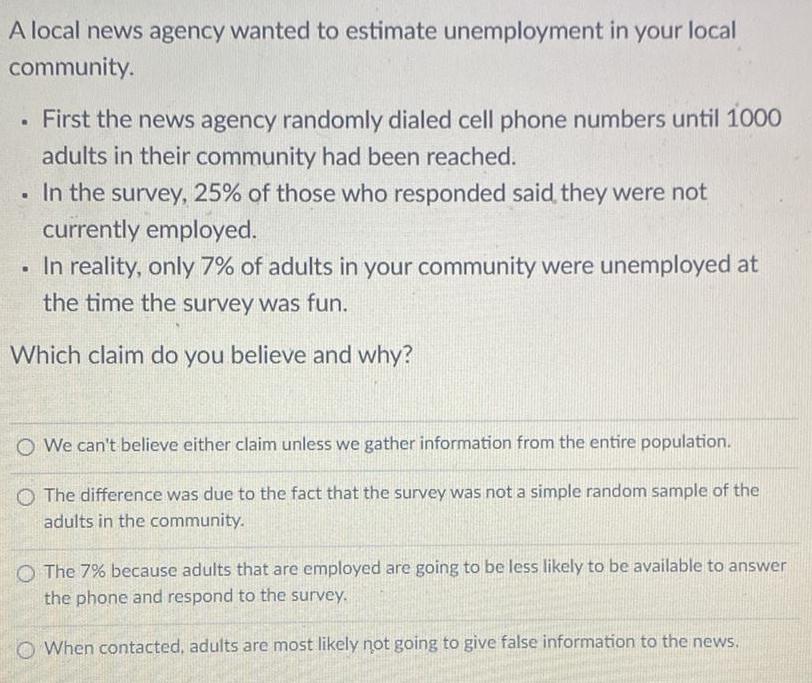
StatisticsA local news agency wanted to estimate unemployment in your local community.
First the news agency randomly dialed cell phone numbers until 1000 adults in their community had been reached.
In the survey, 25% of those who responded said, they were not currently employed.
In reality, only 7% of adults in your community were unemployed at the time the survey was fun.
Which claim do you believe and why?
We can't believe either claim unless we gather information from the entire population.
The difference was due to the fact that the survey was not a simple random sample of the adults in the community.
The 7% because adults that are employed are going to be less likely to be available to answer the phone and respond to the survey.
When contacted, adults are most likely not going to give false information to the news.
Math
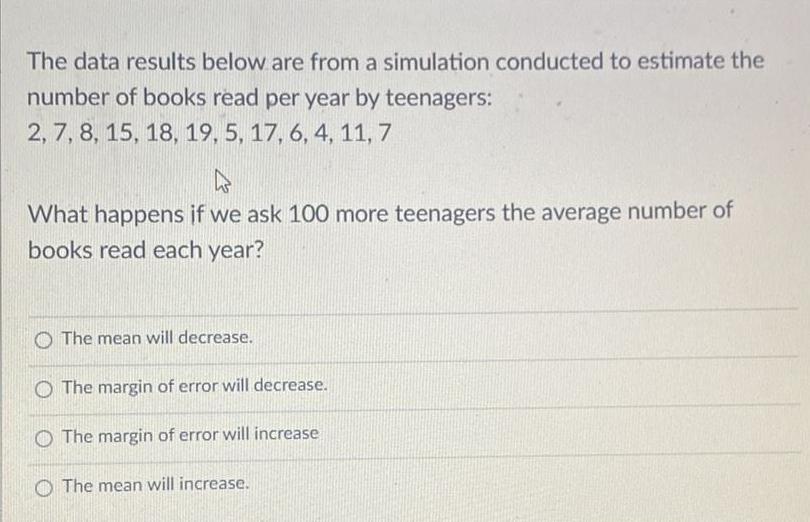
StatisticsThe data results below are from a simulation conducted to estimate the
number of books read per year by teenagers:
2, 7, 8, 15, 18, 19, 5, 17, 6, 4, 11, 7
What happens if we ask 100 more teenagers the average number of
books read each year?
The mean will decrease.
The margin of error will decrease.
The margin of error will increase
The mean will increase.
Math
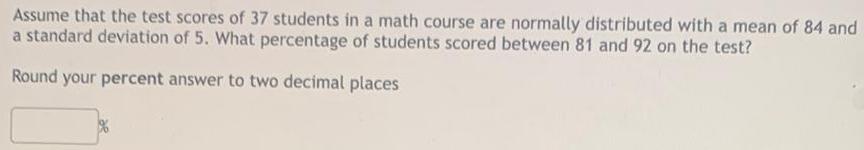
StatisticsAssume that the test scores of 37 students in a math course are normally distributed with a mean of 84 and a standard deviation of 5. What percentage of students scored between 81 and 92 on the test?Round your percent answer to two decimal places
Math
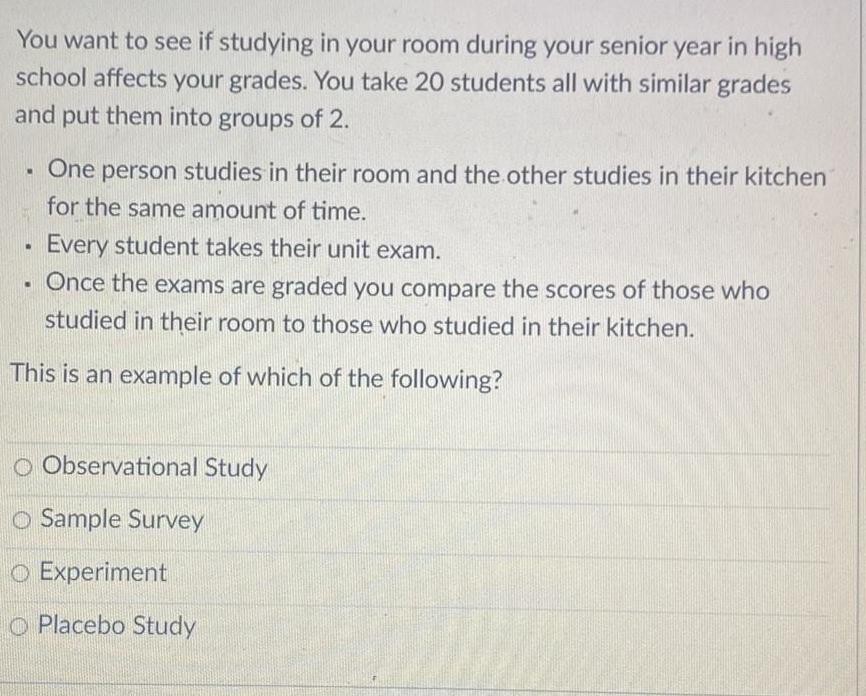
StatisticsYou want to see if studying in your room during your senior year in high
school affects your grades. You take 20 students all with similar grades
and put them into groups of 2.
One person studies in their room and the other studies in their kitchen
for the same amount of time.
Every student takes their unit exam.
Once the exams are graded you compare the scores of those who
studied in their room to those who studied in their kitchen.
This is an example of which of the following?
Observational Study
Sample Survey
Experiment
Placebo Study
Math
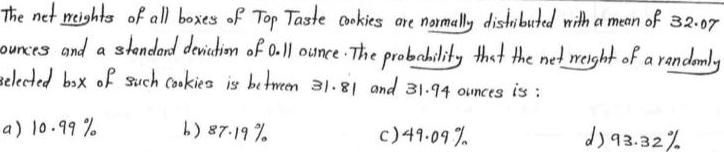
StatisticsThe net weights of all boxes of Top Taste cookies are normally distributed with a mean of 32.07 ounces and a standard deviction of 0.11 ounce. The probability that the net weight of a randomly selected box of such cookies is between 31.81 and 31.94 ounces is:
a) 10.99%
b) 87.19%
c) 49.09%
d) 93.32%
Math
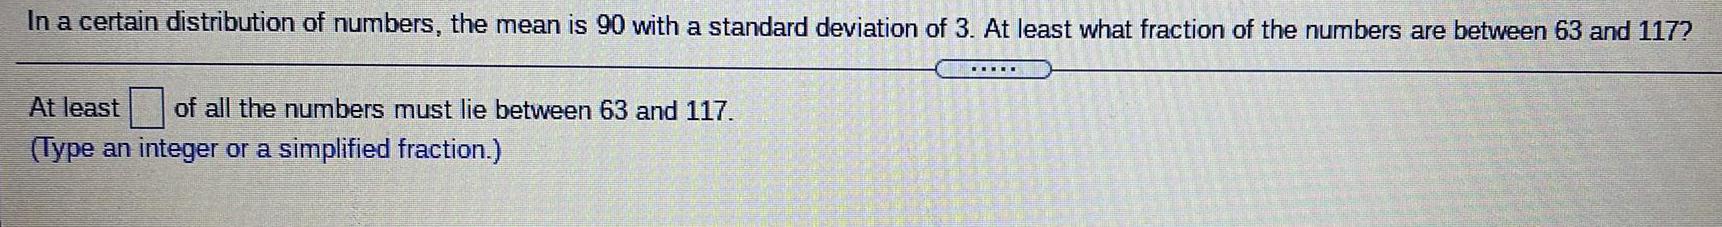
StatisticsIn a certain distribution of numbers, the mean is 90 with a standard deviation of 3. At least what fraction of the numbers are between 63 and 117?
At least of all the numbers must lie between 63 and 117.
(Type an integer or a simplified fraction.)

Math
Statisticsa regression analysis on a set of data (with two variables, X and Y) outcomes a value of r-square = 0.78
What would be the interpretation of this value?
Math
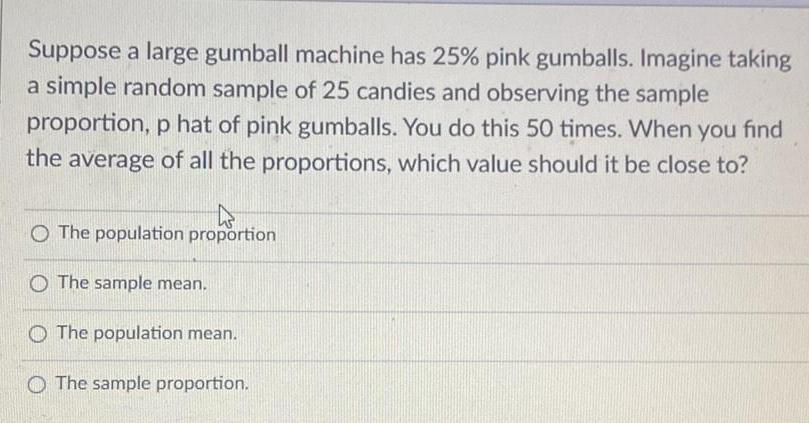
StatisticsSuppose a large gumball machine has 25% pink gumballs. Imagine taking a simple random sample of 25 candies and observing the sample proportion, p hat of pink gumballs. You do this 50 times. When you find the average of all the proportions, which value should it be close to?
The population proportion
The sample mean.
The population mean.
The sample proportion.
Math
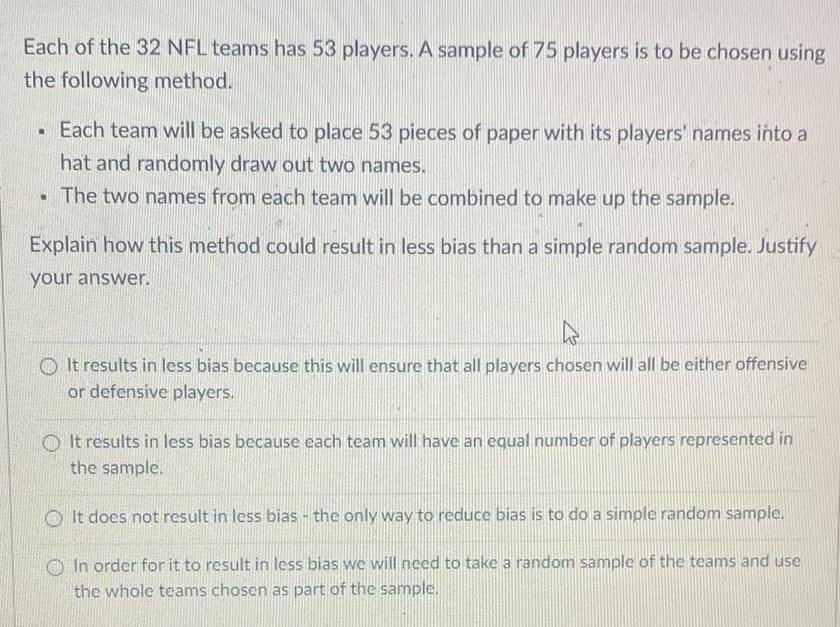
StatisticsEach of the 32 NFL teams has 53 players. A sample of 75 players is to be chosen using
the following method.
. Each team will be asked to place 53 pieces of paper with its players' names into a
hat and randomly draw out two names.
The two names from each team will be combined to make up the sample.
Explain how this method could result in less bias than a simple random sample. Justify
your answer.
It results in less bias because this will ensure that all players chosen will all be either offensive
or defensive players.
It results in less bias because each team will have an equal number of players represented in
the sample.
It does not result in less bias - the only way to reduce bias is to do a simple random sample.
In order for it to result in less bias we will need to take a random sample of the teams and use
the whole teams chosen as part of the sample.
Math
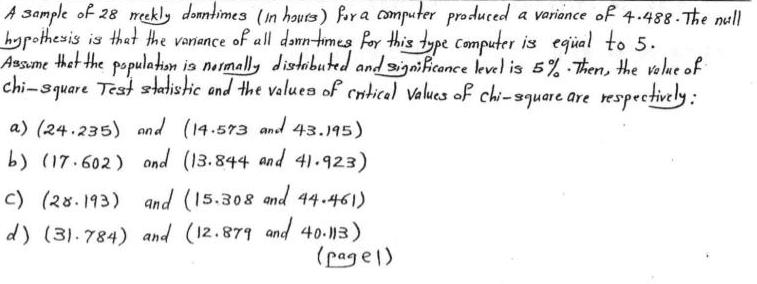
StatisticsA sample of 28 weekly donntimes (in hours) for a computer produced a variance of 4.488. The null
hypothesis is that the variance of all dann-times for this type computer is equal to 5.
Assume that the population is normally distributed and significance level is 5% Then, the value of
chi-square Test statistic and the values of critical values of chi-square are respectively:
a) (24.235) and (14.573 and 43.195)
b) (17.602) and (13.844 and 41.923)
c) (28.193) and (15.308 and 44.461)
d) (31.784) and (12.879 and 40.113)
Math
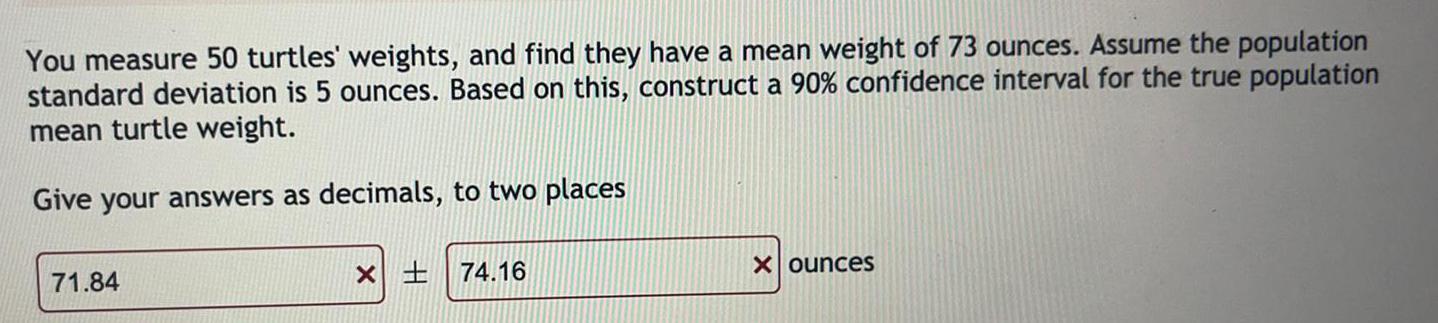
StatisticsYou measure 50 turtles' weights, and find they have a mean weight of 73 ounces. Assume the population
standard deviation is 5 ounces. Based on this, construct a 90% confidence interval for the true population
mean turtle weight.
Give your answers as decimals, to two places
ounces
Math
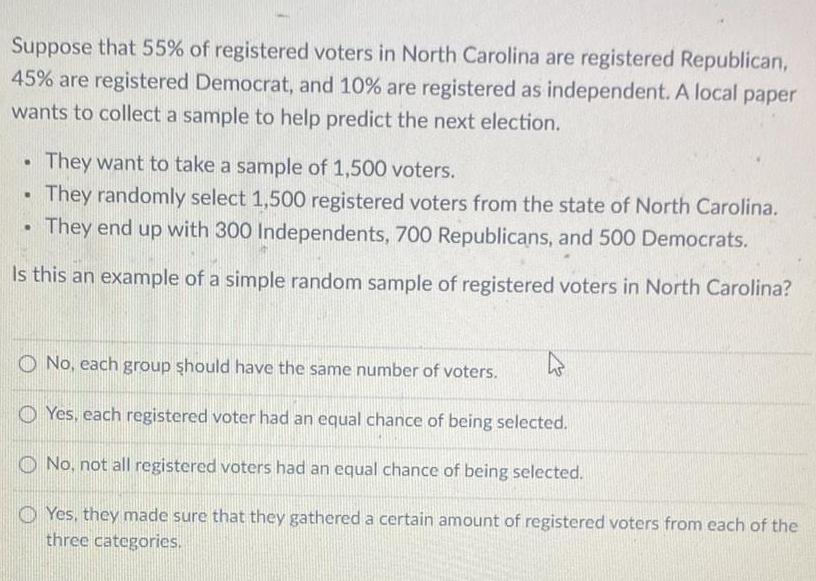
StatisticsSuppose that 55% of registered voters in North Carolina are registered Republican, 45% are registered Democrat, and 10% are registered as independent. A local paper wants to collect a sample to help predict the next election.
They want to take a sample of 1,500 voters.
They randomly select 1,500 registered voters from the state of North Carolina.
They end up with 300 Independents, 700 Republicans, and 500 Democrats.
Is this an example of a simple random sample of registered voters in North Carolina?
No, each group should have the same number of voters.
Yes, each registered voter had an equal chance of being selected.
No, not all registered voters had an equal chance of being selected.
Yes, they made sure that they gathered a certain amount of registered voters from each of the three categories.
Math
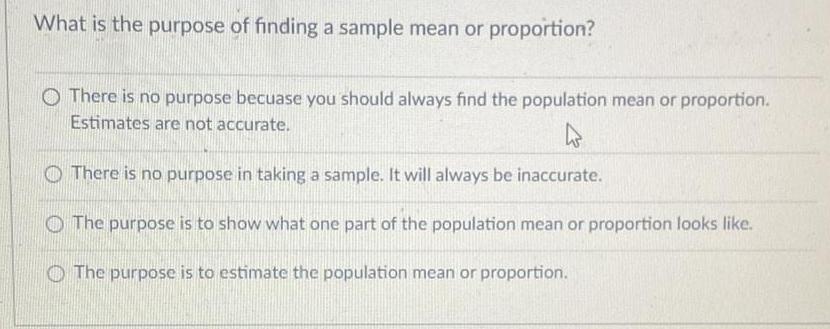
StatisticsWhat is the purpose of finding a sample mean or proportion?
There is no purpose becuase you should always find the population mean or proportion. Estimates are not accurate.
There is no purpose in taking a sample. It will always be inaccurate.
The purpose is to show what one part of the population mean or proportion looks like.
The purpose is to estimate the population mean or proportion.
Math
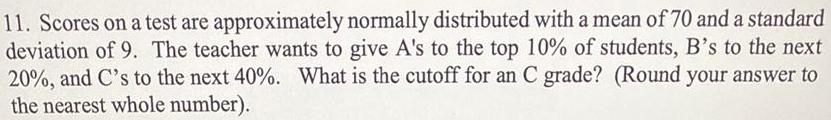
StatisticsScores on a test are approximately normally distributed with a mean of 70 and a standard deviation of 9. The teacher wants to give A's to the top 10% of students, B's to the next 20%, and C's to the next 40%. What is the cutoff for an C grade? (Round your answer to the nearest whole number).
Math
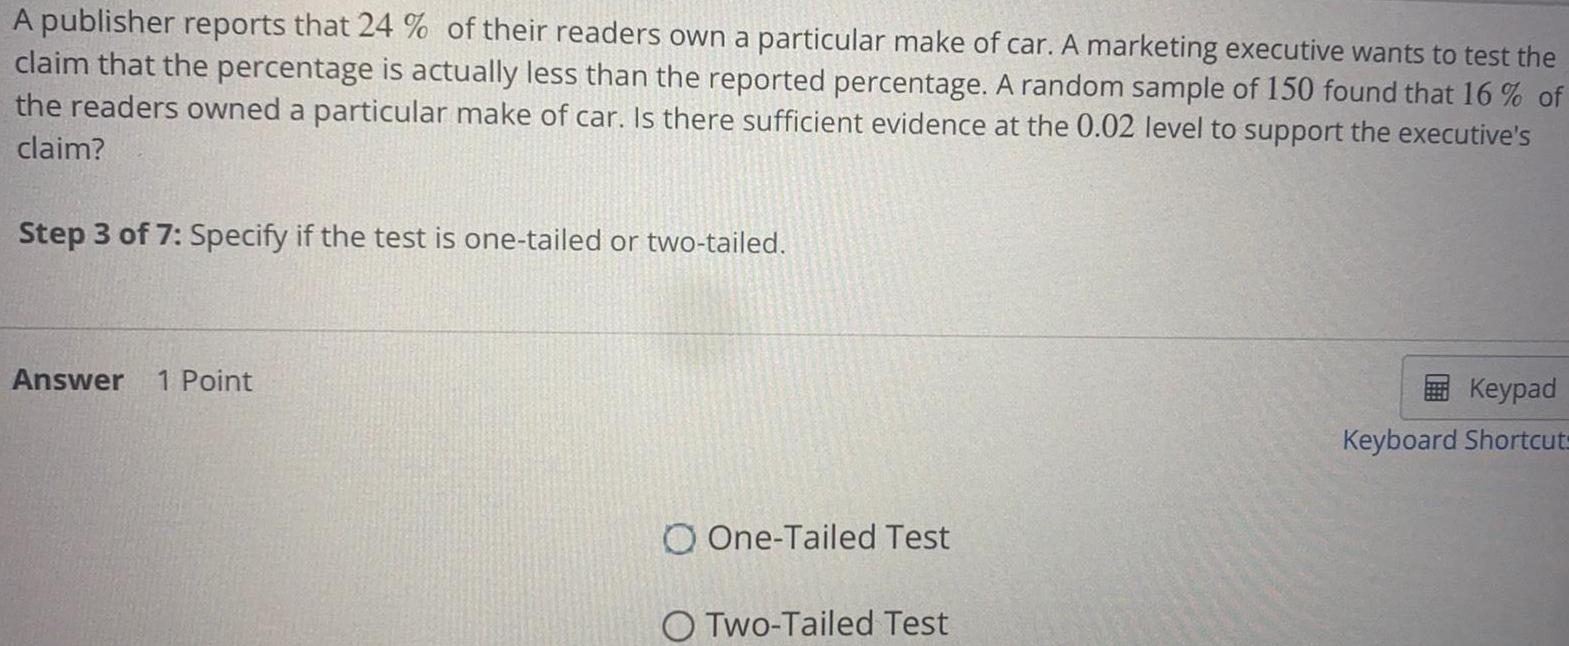
StatisticsA publisher reports that 24 % of their readers own a particular make of car. A marketing executive wants to test the
claim that the percentage is actually less than the reported percentage. A random sample of 150 found that 16% of
the readers owned a particular make of car. Is there sufficient evidence at the 0.02 level to support the executive's
claim?
Step 3 of 7: Specify if the test is one-tailed or two-tailed.
Answer 1 Point
One-Tailed Test
Two-Tailed Test
Math
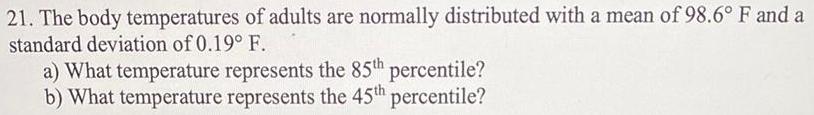
Statistics21. The body temperatures of adults are normally distributed with a mean of 98.6° F and a
standard deviation of 0.19° F.
a) What temperature represents the 85th percentile?
b) What temperature represents the 45th percentile?
Math
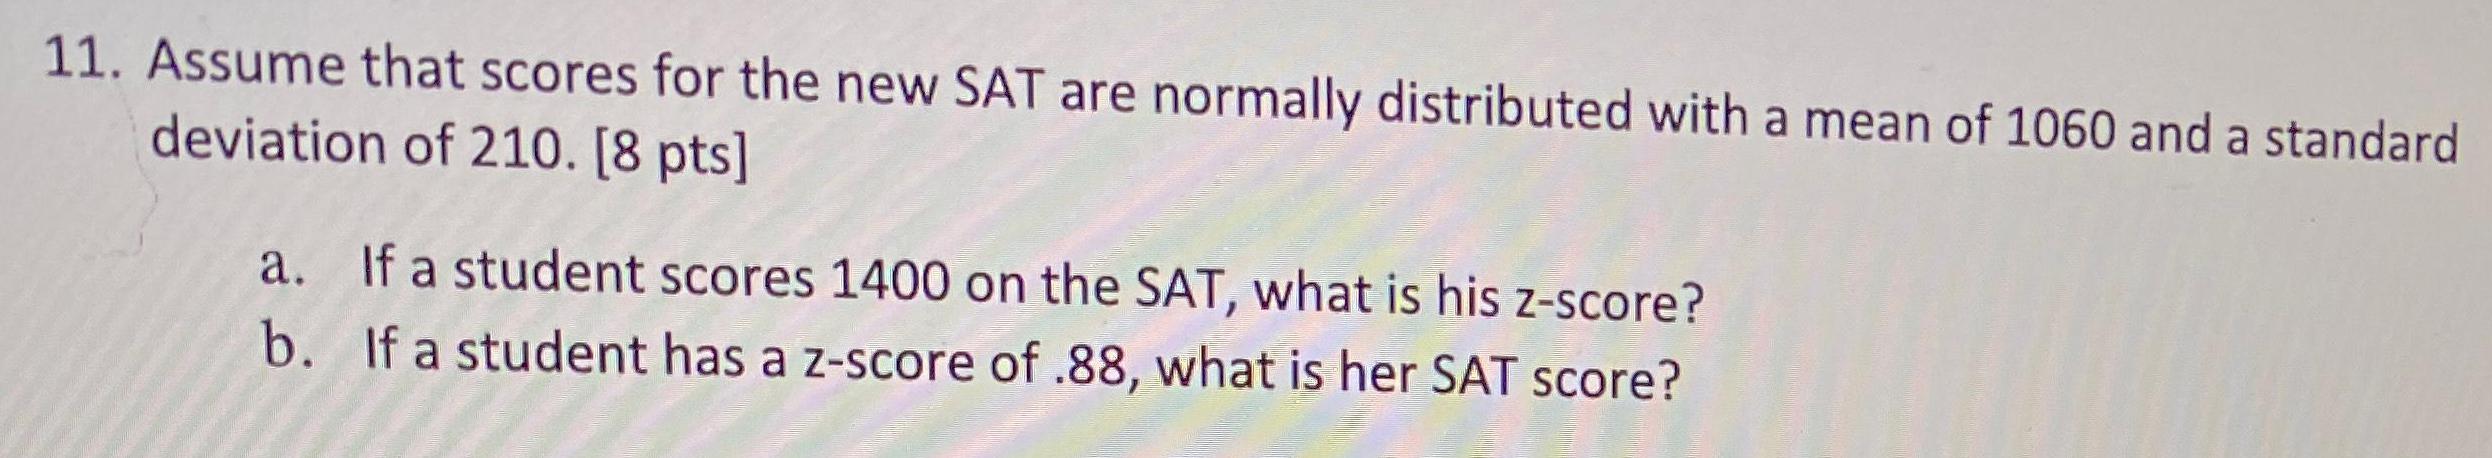
StatisticsAssume that scores for the new SAT are normally distributed with a mean of 1060 and a standard deviation of 210.
a. If a student scores 1400 on the SAT, what is his z-score?
b. If a student has a z-score of .88, what is her SAT score?
Math
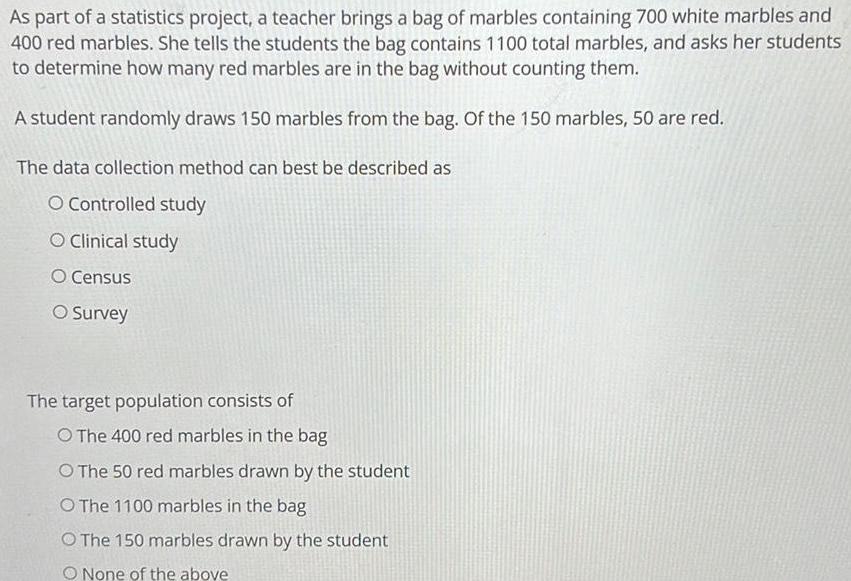
StatisticsAs part of a statistics project, a teacher brings a bag of marbles containing 700 white marbles and
400 red marbles. She tells the students the bag contains 1100 total marbles, and asks her students
to determine how many red marbles are in the bag without counting them.
A student randomly draws 150 marbles from the bag. Of the 150 marbles, 50 are red.
The data collection method can best be described as
Controlled study
Clinical study
Census
Survey
The target population consists of
The 400 red marbles in the bag
The 50 red marbles drawn by the student
The 1100 marbles in the bag
The 150 marbles drawn by the student
None of the above
Math
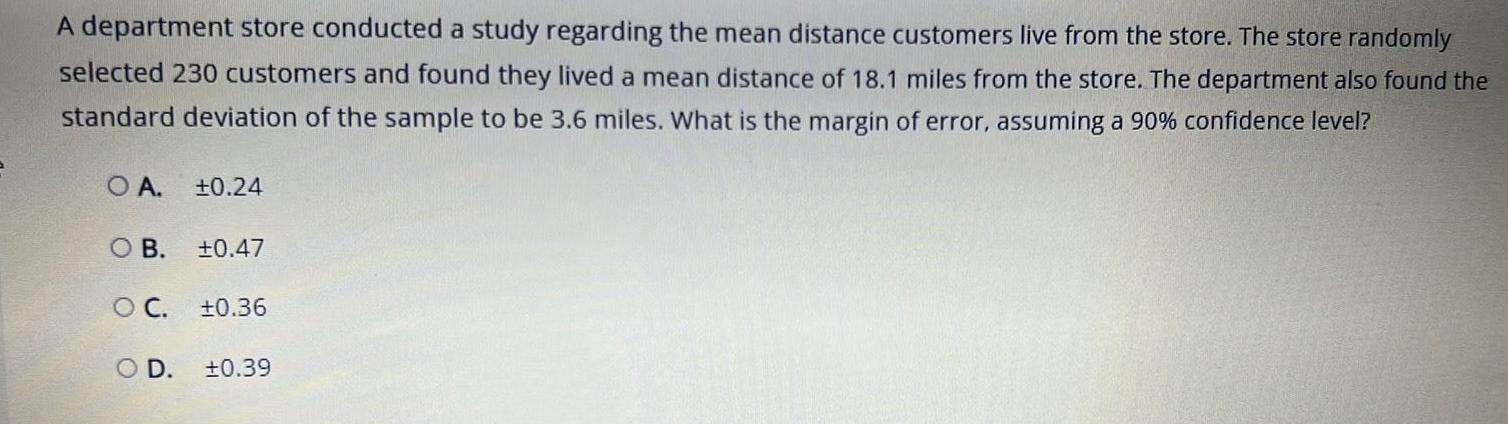
StatisticsA department store conducted a study regarding the mean distance customers live from the store. The store randomly
selected 230 customers and found they lived a mean distance of 18.1 miles from the store. The department also found the
standard deviation of the sample to be 3.6 miles. What is the margin of error, assuming a 90% confidence level?
A. +0.24
B. +0.47
C. ±0.36
D. ±0.39
Math
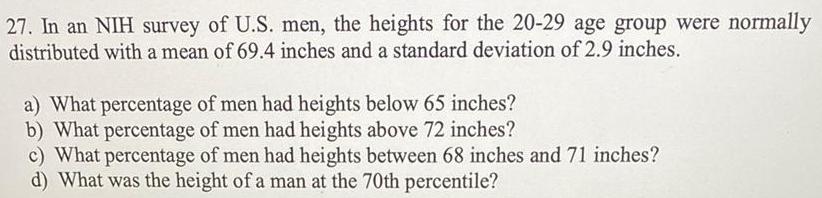
StatisticsIn an NIH survey of U.S. men, the heights for the 20-29 age group were normally
distributed with a mean of 69.4 inches and a standard deviation of 2.9 inches.
a) What percentage of men had heights below 65 inches?
b) What percentage of men had heights above 72 inches?
c) What percentage of men had heights between 68 inches and 71 inches?
d) What was the height of a man at the 70th percentile?
Math
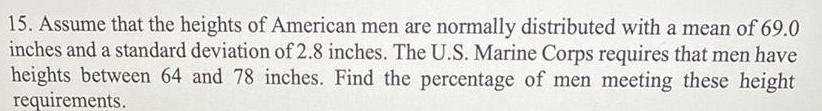
StatisticsAssume that the heights of American men are normally distributed with a mean of 69.0 inches and a standard deviation of 2.8 inches. The U.S. Marine Corps requires that men have heights between 64 and 78 inches. Find the percentage of men meeting these height requirements.
Math
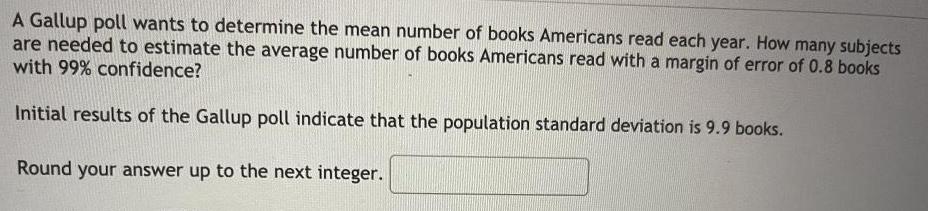
StatisticsA Gallup poll wants to determine the mean number of books Americans read each year. How many subjects are needed to estimate the average number of books Americans read with a margin of error of 0.8 books with 99% confidence?
Initial results of the Gallup poll indicate that the population standard deviation is 9.9 books.
Round your answer up to the next integer.
![A random sample of 28 professionals in a large city were surveyed about the length of their daily commute. The data (in minutes) are shown below. [12 pts]
20 35 42 52 65 20 60
22 20 41 25 28 27 50
49 24 37 23 24 32 44
47 58 30 32 48 55 58
a. Find the mean and standard deviation for these data.
b. Find the 5 number summary for these data.
c. Make a stem/leaf plot for this data using the first digit as the stem and the second digit as the leaves.](https://media.kunduz.com/media/sug-question/raw/61313575-1657323909.4319448.jpeg?w=256)
Math
StatisticsA random sample of 28 professionals in a large city were surveyed about the length of their daily commute. The data (in minutes) are shown below. [12 pts]
20 35 42 52 65 20 60
22 20 41 25 28 27 50
49 24 37 23 24 32 44
47 58 30 32 48 55 58
a. Find the mean and standard deviation for these data.
b. Find the 5 number summary for these data.
c. Make a stem/leaf plot for this data using the first digit as the stem and the second digit as the leaves.
Math
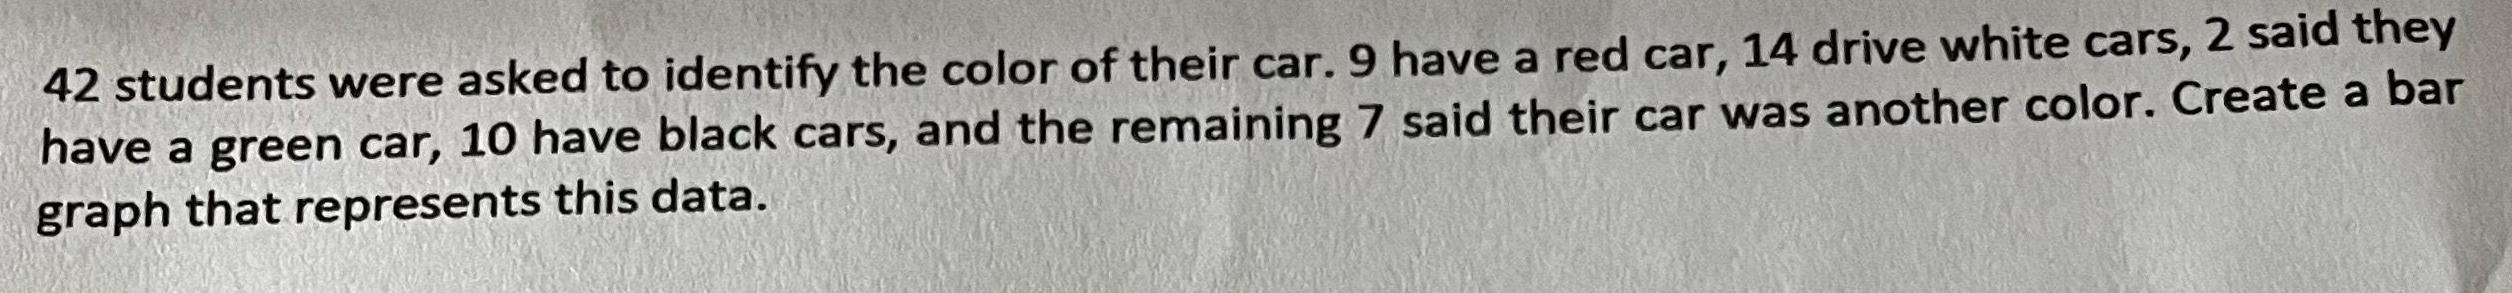
Statistics42 students were asked to identify the color of their car. 9 have a red car, 14 drive white cars, 2 said they have a green car, 10 have black cars, and the remaining 7 said their car was another color. Create a bar graph that represents this data.