Statistics Questions and Answers

Math
StatisticsTo test the effectiveness of a liquid supplement that is supposed to help forgetful people with the memory, 400 college students are recruited for a study and divided into two groups. Group A with 250 students receives the supplement, while group B with 150 students receives some colored water. Neither group is told what they received. After several weeks, they are given a memory test.
This study can best be described as
the placebo effect
a survey using quota sampling
a controlled placebo experiment
a census
a survey using simple random sampling

Math
StatisticsA researcher interested in Springfield citizens' shopping habits surveys a randomly selected group of 200 Walmart shoppers. 76% of those surveyed indicated that price was more important to them than where an item was produced. The researcher concluded that "about three quarters of the people in Springfield are more concerned with cost than where an item is made."
This conclusion might be invalid because:
there was no control group.
the size of the sample is too small.
the sample is not representative of the population.
76% is not exactly three quarters.
None of the above

Math
Statistics100 students were asked what types of pets they owned. 45 owned a dog, 38 owned a cat, 14 owned a bird, 21 owned a fish, and 38 did not have a pet. Would it be best to make a pie chart, line graph, or bar graph for this data? Why?

Math
StatisticsTo test the effect of a new exercise routine on muscle growth, a researcher sets up the following experiment: 60 volunteers subjects (40 men and 20 women) of average build are selected to participate in the study. Their body mass and muscle sizes (biceps, thighs, etc.) are measured. The researcher gives all the men a DVD with the new exercise routine, and the women a DVD with a standard routine, but only the researcher knows this.
The results of the experiment are likely to be invalid mostly because
the gender of the patient is a confounding variable in this experiment.
the subjects did not know if they were getting the real treatment.
the treatment group and control group were not the same size.
the subjects were volunteers.
None of the above

Math
StatisticsA study claims that the combination of vitamin C with vitamin E is more effective for preventing the flu than vitamin C alone. In the study, a group of researchers studied 1132 subjects. The subjects were randomly assigned to out of three study groups. The first group of 310 subjects were instructed to take 600 mg daily of vitamin C. The second group of 418 subjects were instructed to take 600 mg of vitamin C and 200 IU of vitamin E daily. The third group of 404 subjects were instructed to take 600 mg of vitamin C and 400 IU of vitamin E daily. The incidence of flu over a season was recorded. All subjects knew which treatment they were receiving.
In this study, which is the control group?
the 1132 subjects
the second group of 418 taking 200 IU of vitamin E
the third group of 404 taking 400 IU of vitamin E
the first group of 310 taking vitamin C alone
There is no control group.
This study is
blind, but not double-blind
not an experiment
not blind.
double-blind
none of the above

Math
StatisticsExamine the data for Groups A and Group B below. What statement about Group B is true? Make sure to calculate the mean and median of both Groups A and Group B to help you.
Group A 11 21 12 18 23
Group B 15 22 18 21 14
The mean of Group B is smaller than Group A, and the median is larger.
The mean of Group B is smaller than Group A, and the median is the same.
The mean of Group B is larger than Group A, and the median is larger.
The mean of Group B is larger than Group A, and the median is the same.
Explain or show your reasoning below for your choice.

Math
StatisticsSuppose the average player in the NBA is 78 inches tall, with a standard deviation of 2.7 inches, while the average player in the WNBA is 69 inches tall, with a standard deviation of 3.2 inches. Who is relatively taller based on their comparison to their profession, LeBron James (NBA) at 81 inches or Candace Parker (WNBA) at 76 inches?
A.) Candace is relatively taller because she has a larger z-score.
B.) LeBron is relatively taller because he has a larger z-score.
C.) LeBron is relatively taller because he has a smaller z-score.
D.) Candace is relatively taller because she has a smaller z-score.

Math
StatisticsThe following are all 5 quiz scores of a student in a statistics course. Each quiz was graded on a 10-point scale.
10, 5, 5, 10, 10
Send data to calculator
Assuming that these scores constitute an entire population, find the standard deviation of the population. Round your answer to two decimal places.
(If necessary, consult a list of formulas.)

Math
StatisticsAn economist wants to estimate the mean per capita income (in thousands of dollars) for a major city in California. Suppose that the mean income is found to be $20.7 for a random sample of 1301 people. Assume the population standard deviation is known to be $6. Construct the 98% confidence interval for the mean per capita income in thousands of dollars. Round your answers to one decimal place.

Math
StatisticsListed below are amounts of court income and salaries paid to the town justices for a certain town. All amounts are in thousands of dollars. Find the (a) explained variation, (b) unexplained variation, and (c) indicated prediction interval. There is sufficient evidence to support a claim of a linear correlation, so it is reasonable to use the regression equation when making predictions. For the prediction interval, use a 99% confidence level with a court income of $800,000.
Court Income $62 $399 $1591 $1104 $278 $252 $110 $152 $31
Justice Salary $34 $41 $98 $60 $50 $60 $28 $20 $19
b. Find the unexplained variation.

Math
StatisticsWhat does it mean to reduce variation between samples?
Reduce variation means that one sample will have similar characteristics to another sample.
Reduce variation means that whenever you gather a sample all the samples will have the exact same sample mean.
Since the population is always going to vary it is impossible to reduce variation between samples.
Reduce variation means that when you gather a sample mean or proportion the sample mean or proportion will consistently be to large.
This is a tricky one! Remember that reduce variation means when we take a sample we want the sample from group 1 to be similar to the sample from group 2. How can you apply this concept to reducing variation?
Math
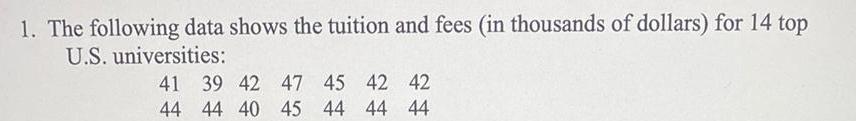
StatisticsThe following data shows the tuition and fees (in thousands of dollars) for 14 top
U.S. universities:
41 39 42 47 45 42 42
44 44 40 45 44 44 44

Math
StatisticsYou want to determine the average amount of time students at your high
school are spending a day exercising.
You send a survey out to 100 randomly selected juniors at Outer Banks
High School.
What is a possible error with the sampling method?

Math
StatisticsWhich of the following is true?
In an observational study the information gathered already exists.
In an observational study a treatment is imposed randomly on one group in order to
determine the response.

Math
StatisticsAssume that the test scores of 38 students in a math course are normally distributed with a mean of 90 and a standard deviation of 4. How many students scored above 89 on the test?

Math
StatisticsYou are saving up to buy a used car. You have no idea how much you will need to save.
You decide to send out a survey to a random sample of 6 seniors at your high school
who have purchased used cars. They give you the following prices:
$2000, $7000, $3500, $2,300, $5000, $4200
What is the sample mean?
μ = $3850
μ = $4000
x̄= $3850
x̄ = $4000

Math
StatisticsIn one study of chocolate on blood flow, 75 patients who acknowledged
being long time chocolate eaters had their blood flow levels compared
with those of 75 people who did not eat chocolate.
In a second study, 25 subjects were randomly chosen to receive chocolate
and 25 were chosen to receive a placebo.
Which of the following is true?
Both studies were observational studies.
The first study was an experiment, while the second one was an observational study.
Both studies were experiments.
The first study was an observational study, while the second one was an experiment.

Math
StatisticsDuring an experiment, the following times (in seconds) were recorded. Find the median.
2.15, 2.49, 2.62, 10.01, 2.77, 2.44, 2.67

Math
StatisticsThe mean age when smokers first start is 13 years old with a population standard deviation of 2 years. A researcher thinks that smoking age has significantly changed since the invention of ENDS-electronic
nicotine delivery systems. A survey of smokers of this generation was done to see if the mean age has
changed. The sample of 34 smokers found that their mean starting age was 12.1 years old. Do the data support the claim at the 1% significance level?

Math
StatisticsYou want to determine the average amount of time students at your high school are
spending a day exercising. You send a survey, to 100 randomly selected students at
Outer Banks High School.
What is the population?
All students in the junior class.
All Students at Outer Banks High School.
All high school students in the United States
100 randomly selected juniors.

Math
StatisticsThao earned the following scores on her six management exams last semester.
77, 82, 44, 88, 77, 89
Thao has a chance to replace her score of 44 by taking a "make-up" exam. What must she score on the make-up exam to get an overall average (mean) of 84?

Math
StatisticsEXPECTED ATTENDANCE - IF THE DAY IS SUNNY, 1000 PEOPLE WILL ATTEND THE BASEBALL GAME. IF THE DAY IS CLOUDY, ONLY 500 PEOPLE WILL ATTEND. IF IT RAINS, ONLY 100 PEOPLE WILL ATTEND. THE LOCAL METEOROLOGIST STATES THAT THE PROBABILITY OF A SUNNY DAY IS 0.4, OF A CLOUDY DAY IS 0.5, AND OF A RAINY DAY IS 0.1. FIND THE NUMBER OF PEOPLE THAT ARE EXPECTED TO ATTEND.

Math
StatisticsThe summary statistics for a certain set of points are:
n = 25, se = 6.04, Σ (x-x)² = 49.70 and b₁ = 3.05
Assume the conditions of the linear model hold. A^98% confidence interval for B₁ will be constructed.
How many degrees of freedom are there for the critical value?

Math
StatisticsUsing the given margin of error, confidence level, and likely range for the observed value of the sample proportion, obtain a sample size that will ensure a margin of error of at most the one specified (provided, of course, that the observed value of the sample proportion is further from 0.5 than the educated guess).
margin of error=0.015; confidence level = 95%; likely range = 0.15 to 0.35
The required sample size is n =.

Math
StatisticsIn a study of cell phone usage and brain hemispheric dominance, an Internet survey was e-mailed to 6977 subjects randomly selected from an online group involved
with ears. There were 1312 surveys returned. Use a 0.01 significance level to test the claim that the return rate is less than 20%. Use the P-value method and use
the normal distribution as an approximation to the binomial distribution.
Identify the null hypothesis and alternative hypothesis.
A. H₂ p=0.2
H₁ p>0.2
C. Ho p=02
H₁ p 0.2
E. Ho p=02
H₁ p<0.2
The test statistic is z= .
(Round to two decimal places as needed.)
The P-value is
(Round to three decimal places as needed.)
Because the P-value is
return rate is less than 20%.
the significance level,
O B. Ho: p=0.2
H₁: p=0.2
OD. Ho p>0.2
H₁: p=0.2
OF. Ho p<0.2
H₁: p=0.2
the null hypothesis. There is
evidence to support the claim that the

Math
StatisticsA researcher wants to test the claim that the average salary of tattoo artists is different from $48,890. He
selects a random sample of 16 of these artists and finds the (sample) mean to be $47,995, and he knows
the (population) standard deviation is $3164. Is there sufficient evidence to support the claim (that the
population mean is different from $48,890) at alpha=0.10?

Math
StatisticsClaim: Most adults would erase all of their personal information online if they could. A software firm survey of 532 randomly selected adults showed that 99.4% of
them would erase all of their personal information online if they could. Make a subjective estimate to decide whether the results are significantly low or significantly
high, then state a conclusion about the original claim.
▼significantly
The results
online if they could.
so there
.....
sufficient evidence to support the claim that most adults would erase all of their personal information

Math
StatisticsIs pancakes and eggs or hot oatmeal with bacon a more filling breakfast for teenagers?
Sixty student volunteers were randomly split into two groups and then randomly assigned their
breakfast.
.
One group is fed pancakes and eggs, while the other group is fed hot oatmeal and bacon.
Each student volunteer rates his/her breakfast on scale of 1-10 on how hungry they were an
hour later.
If the pancake and eggs had a significantly higher average score, which of the following is not true?
.
.
Because the teenagers were randomly chosen we can conclude that all students find pancakes and eggs to be
more filling after an hour than hot oatmeal and bacon.
O Since the treatments were randomly assigned we can conclude that students in the study find pancakes and
eggs to be more filling after an hour than hot oatmeal and bacon.
O Because there was no random sampling, the results only apply to the students in the experiment.
O The sample size was large enough to make conclusions for the students in the group.

Math
StatisticsA study at an amusement park found that, of 10,000 families at the park, 1670 had brought one child, 2110 had
brought two children, 2440 had brought three children, 1420 had brought four children, 1010 had brought five
children, 620 had brought six children, and 730 had not brought any children.
Find the expected number of children per family at the amusement park.
The expected number of children per family is 2.766
(Round to the nearest tenth as needed.)

Math
StatisticsTravel distance for employees at a large company is approximately normally distributed with a standard deviation of 9 km. If 33% of the employees travel no longer than 26.44 km to work, what is the mean travel distance for all the employees?
Report your answer accurate to at least 1 (one) decimal place.
Mean travel distance = km

Math
StatisticsTo get a C in history, Nandan must average 74 on four tests. Scores on the first three tests were 68, 78, and 62. What is the lowest score that Nandan can get on the
last test and still receive a C?
A. 14
B. 69
C. 88
OD. 71
..…..

Math
Statistics95%
(a) Construct a confidence interval for the difference in the proportions of patients needing pain medication between the old and new procedures.
Let P₁ denote the proportion of patients who had the old procedure needing pain medication. Use tables to find the critical value and round the answer to
at least three decimal places.
A 95% confidence interval for the difference in the proportions of patients needing pain medication between the old and
new procedures is 0.053<P1 P2 0.346
X

Math
StatisticsIn a certain survey, 500 people chose to respond to this question: "Should passwords be replaced with biometric security (fingerprints, etc)?" Among the
respondents, 51% said "yes." We want to test the claim that more than half of the population believes that passwords should be replaced with biometric security.
Complete parts (a) through (d) below.
a. Are any of the three requirements violated? Can a test about a population proportion using the normal approximation method be used?
O A. One of the conditions for a binomial distribution are not satisfied, so a test about a population proportion using the normal approximating method cannot be
used.
OB. All of the conditions for testing a claim about a population proportion using the normal approximation method are satisfied, so the method can be used.
OC. The sample observations are not a random sample, so a test about a population proportion using the normal approximating method cannot be used.
OD. The conditions np 25 and nq 25 are not satisfied, so a test about a population proportion using the normal approximation method cannot be used.

Math
StatisticsTwenty different statistics students are randomly selected. For each of them, their body temperature (°C) is measured and their head circumference (cm) is
measured.
a. For this sample of paired data, what does r represent, and what does p represent?
b. Without doing any research or calculations, estimate the value of r.
c. Does r change if body temperatures are converted to Fahrenheit degrees?
a. Choose the correct answer below.
*****
OA. r is a statistic that represents the value of the linear correlation coefficient computed from the paired sample data, and p is a parameter that represents the
value of the linear correlation coefficient that would be computed by using all of the paired data in the population of all statistics students.
OB. r is a parameter that represents the value of the linear correlation coefficient that would be computed by using all of the paired data in the population of all
statistics students, and p is a statistic that represents the value of the linear correlation coefficient computed from the paired sample data.
OC. r is a statistic that represents the proportion of the variation in head circumference that can be explained by variation in body temperature, and p is a
parameter that represents the value of the linear correlation coefficient that would be computed by using all of the paired data in the population of all statistics
students.
OD. r is a statistic that represents the value of the linear correlation coefficient computed from the paired sample data, and p is a parameter that represents the
proportion of the variation in head circumference that can be explained by variation in body temperature.

Math
StatisticsType numbers in the boxes. 10 points A group of 40 college students from a certain liberal arts college were randomly sampled and asked about the number of alcoholic drinks they have in a typical week. The purpose of this study was to compare the drinking habits of the students at the college to the drinking habits of college students in general. In particular, the dean of students, who initiated this study, would like to check whether the mean number of alcoholic drinks that students at his college in a typical week differs from the mean of U.S. college students in general, which is estimated to be 4.73.
The group of 40 students in the study reported an average of 4.23 drinks per with a standard deviation of 3.85 drinks.
Find the p-value for the hypothesis test.
The p-value should be rounded to 4-decimal places.

Math
StatisticsSelect one answer.
10 points
groups;
A researcher wants to determine if preschool attendance is associated with high school
graduation for low-income students. She randomly assigns low-income children to two
one group will attend preschool program, the second group will not attend preschool. The researcher plans to follow
the children in the study for 20 years and observe whether or not they graduate from high school.
Which of the following is the response variable in this study?
A. O The length of time it takes a subject to graduate high school
B. O Whether or not a subject graduates high school
C. O Whether or not a subject attends preschool
D. O The income status of the children

Math
Statistics1. In an auditorium, there are 22 seats in the first row and 28 seats in the second row. The number of seats in a
row continues to increase by 6 with each additional row.
(a) Write an iterative rule to model the sequence formed by the number of seats in each row. Show your
work.
(b) Use the rule to determine which row has 100 seats. Show your work.

Math
StatisticsFinding the sample size: Polls are to be conducted in two cities to determine the difference in the proportions of residents who believe that the economy will
improve over the next year. A 98% confidence interval will be constructed for the difference between the proportions. If the sample sizes are to be equal in the
two cities, how large should each sample be so that the margin of error will be no more than 0.09 Round up your answer to the nearest whole number.

Math
StatisticsPretzels: In order to judge the effectiveness of an advertising campaign for a certain brand of pretzel, a company obtained a simple random sample of 100
convenience store receipts the week before the ad campaign began, and found that 21 of them showed a purchase of the pretzels. Another simple random
30
sample of 80 receipts was taken the week after the ad campaign, and of them showed a pretzel purchase.
Part: 0/2
Part 1 of 2
(a) Construct a 99.9% confidence interval for the difference between the proportions of customers purchasing pretzels before and after the ad campaign.
Let P₁ denote the proportion of customers purchasing pretzels before the ad campaign. Use tables to find the critical value and round the answer to at
least three decimal places.
A 99.9% confident that the difference between the proportions of customers purchasing pretzels before and after the ad
campaign is <P₁ P₂ <0.
X
3

Math
StatisticsIn one study, it was found that the correlation coefficient between two variables is 0.97.
Which statement is true?
There is strong positive association between the variables.
There is a weak negative association between the variables.
There is a weak positive association between the variables.
There is a strong negative association between the variables.

Math
StatisticsThe size P of a certain insect population at time t (in days) obeys the function P(t) = 900 e 0.07t
(a) Determine the number of insects at t=0 days.
(b) What is the growth rate of the insect population?
(c) What is the population after 10 days?
(d) When will the insect population reach 1350?
(e) When will the insect population double?

Math
StatisticsAn airline has determined that the average weight of a traveler's suitcase is 39.7 pounds, with a standard deviation of
5.2 pounds.
Assuming a normal distribution of suitcase weights, what percentage of travelers' suitcases weigh less than 44.9 pounds?
A. About 97% of the suitcases weigh less than 44.9 pounds.
B. About 34% of the suitcases weigh less than 44.9 pounds.
C. About 84% of the suitcases weigh less than 44.9 pounds.
D. About 68% of the suitcases weigh less than 44.9 pounds.

Math
StatisticsMatt is saving to buy a new motorcycle. If he deposits $50 at the end of each month in an account that pays an annual interest rate of 5.5%, how much will he have
in 30 months? Assume that the compounding is being done monthly.
Matt will have $57 in 30 months.
(Round to the nearest cent as needed.)

Math
StatisticsThe 6 participants in a 200-meter dash had the following finishing times (in seconds).
28, 26, 28, 24, 27, 29
Send data to calculator
Assuming that these times constitute an entire population, find the standard deviation of the population. Round your answer to two decimal places.
(If necessary, consult a list of formulas.)
1
X
?

Math
StatisticsThe weight of cabbage is normally distributed. A random sample of 25 cabbages has
a mean of 17.31 ounces and a standard deviation of 1.62 ounces. Using a 0.10 of
significance test the claim that the mean weight is less than 18 ounces.
DO NOT Reject Ho
Using a 0.10 level of significance, there is evidence to say the mean weight of
cabbage is greater than 18 ounces.
No Solution
Reject Ho
Using a 0.10 level of significance, there is evidence to say the mean weight of
cabbage is less than 18 ounces.

Math
StatisticsKen earned a A-in his 5-cr English class, a B in a 4-cr physics class, a B+ in a 3-cr Spanish class, and an A in his 3-cr sociology class. What is his GPA for the term? Round to the nearest hundredth.

Math
StatisticsA data set contains information on the grams of fat and number of calories in 27 different fast foods. The correlation coefficient between fat content and calories is determined to be -0.43.
Calculate the p-value for the test of significance.
Math
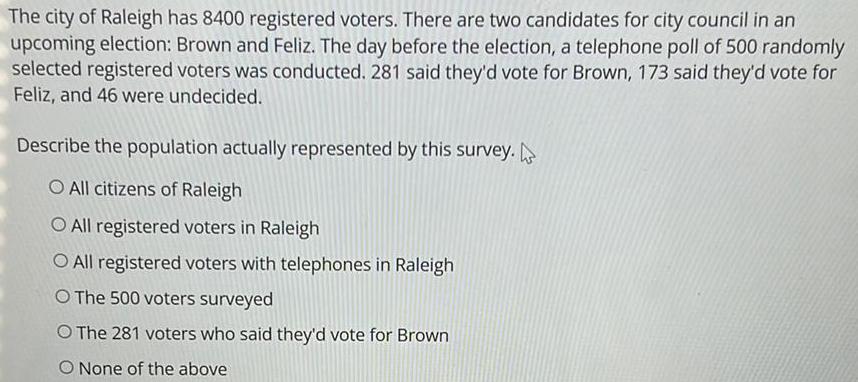
StatisticsThe city of Raleigh has 8400 registered voters. There are two candidates for city council in an
upcoming election: Brown and Feliz. The day before the election, a telephone poll of 500 randomly selected registered voters was conducted. 281 said they'd vote for Brown, 173 said they'd vote for
Feliz, and 46 were undecided.
Describe the population actually represented by this survey.
O All citizens of Raleigh
O All registered voters in Raleigh
O All registered voters with telephones in Raleigh
O The 500 voters surveyed
O The 281 voters who said they'd vote for Brown
O None of the above

Math
StatisticsIn a recent issue of IEEE Spectrum, the lengths of several engineering conferences were announced. Four conferences lasted 4 days, thirteen lasted 6 days, six lasted 3 days, four lasted 10 days, and ten lasted 8 days.
Find the mean length of an engineering conference. Round your answer to the nearest tenth, if necessary.
days
Find the median length of an engineering conference.
days

Math
StatisticsA class of 22 students has taken an exam, and the mean of their scores is 76.5. One student takes the exam late, and scores 92. After including the new score, what is the mean score for all 23 exams? Round to the nearest hundredth. bayon so rich testo obom