Statistics Questions and Answers

Math
StatisticsA bus company is doing research to determine if it can save money by switching from gasoline-powered buses to electric-powered buses. The company randomly selects records of gasoline usage from 30 days and calculates that the buses use a mean 22 gallons of gas each day with a standard deviation of 1.8 gallons. The gas station the buses use charges $2.95 for a gallon of gas. The company also knows it would cost $62 to charge the buses enough to be able to run for one day.
Use a 95% confidence interval to recommend a strategic decision for the bus company.
The bus company should switch to the electric buses because 22 gallons of gas costs more than $62.
The bus company should switch to the electric buses because the least amount of mean gas per day in the
confidence interval costs more than $62.
The bus company should not switch to the electric buses because the least amount of mean gas per day
in the confidence interval costs less than $62.
The bus company should not switch to the electric buses because the greatest amount of mean gas per
day in the confidence interval costs less than $62.

Math
StatisticsA poll of 1146 U.S. adults found that 972 U.S. adults,
or 84.817% regularly used Facebook as a news
source.
Find the margin of error and confidence interval for
the percentage of U.S. adults who regularly use
Facebook as a news source, at the 90% level of
confidence. Express all answers as percentages
rounded to 2 decimal places. Do not write the
percent sign.
Margin of Error (as a percentage):
Confidence Interval:
% to
%
Now find the margin of error and confidence interval
for the percentage of U.S. adults who regularly use
Facebook as a news source, at the 95% level of
confidence.
Margin of Error (as a percentage):
Confidence Interval:
% to
%

Math
StatisticsAccording to an insurance company, the
probability that a woman will survive one
year is
0.992, and the probability that she will die
in one year is 0.008. If she buys a $10,000
one-year term policy for $100,
what is the company's expected gain or
loss?
What can the company expect?
A. Gain of $20.00
B. Loss of $20.00
C. No gain or loss

Math
StatisticsThe following is a list of 12 measurements.
35, -24, -7, -1, -93, 49, 15, 40, 29, 46, 92, 3
Suppose that these 12 measurements are respectively labeled x₁, x₂, ..., x₁2. (Thus, 35 is labeled x₁, −24 is labeled x2, and so on.) Compute the following
38 +12Σi=1 Xi

Math
StatisticsYou work for a marketing firm that has a large client
in the automobile industry. You have been asked to
estimate the proportion of households in Chicago
that have two or more vehicles. You have been
assigned to gather a random sample that could be
used to estimate this proportion to within a 0.04
margin of error at a 90% level of confidence.
a) With no prior research, what sample size should
you gather in order to obtain a 0.04 margin of error?
Round your answer up to the nearest whole number.
n =___households

Math
StatisticsLast year it was recorded that among the 2,896 students in the school district, 1,325 have visited the school nurse. You believe that the proportion of students who visited the school nurse this year has changed, and decide to test this using a 0.1 level of significance. Of a sample of 300 students in a school district, 153 have visited the school nurse. Match the variable to its value.
1. P
2. Po
3. n
0.458
300
0.51

Math
StatisticsFill in the blanks in the statement below.
The__represents the expected proportion of intervals that will contain the parameter if a large number of different samples of size n is obtained. It is denote___

Math
StatisticsThe recommended number of hours of sleep per night is 8 hours, but everybody "knows" that the average college student sleeps less than 7 hours. The number of hours slept last night by 10 randomly selected college students is listed below. Complete the following hypothesis test: H: μ = 7, H₂: μ< 7, a = 0.05.
6.9 6.6 6.8 6.5 7.5 6.5 7.9 5.2 5.4 6.6
(a) Find t. (Give your answer correct to two decimal places.)
(1) Find the p-value. (Give your answer correct to four decimal places.)

Math
StatisticsThe owner of a local chain of grocery stores is always trying to minimize the time it takes her customers to check out. In the past, she has conducted many studies of the checkout times, and they have displayed a normal distribution with a mean time of 12.8 minutes. and a standard deviation of 2.6 minutes. She has implemented a new schedule for cashiers in hopes of reducing the mean checkout time. A random sample of 33 customers visiting her store this week resulted in a mean of 11.8 minutes. Does she have sufficient evidence to claim the mean checkout time this week was less than 12.8 minutes? Use α = 0.02.
(a) Find z. (Round your answer to two decimal places.)
(ii) Find the p-value. (Round your answer to four decimal places.)

Math
StatisticsIf the claim of researchers is that the mean score is more than 92, what would be the correct alternate hypothesis for it?
Mean score is less than 92.
Mean score is more than 92.
Mean score is equal to 92.
Mean score is different from 92.

Math
Statistics(a) What is the probability that a randomly selected pregnancy lasts less than 258 days?
The probability that a randomly selected pregnancy lasts less than 258 days is approximately 0.3085.
(Round to four decimal places as needed.)
Interpret this probability. Select the correct choice below and fill in the answer box within your choice.
(Round to the nearest integer as needed.)
pregnancies to last more than 258 days.
If 100 pregnant individuals were selected independently from this population, we would expect
B. If 100 pregnant individuals were selected independently from this population, we would expect 31 pregnancies to last less than 258 days.
pregnancies to last exactly 258 days.
C. If 100 pregnant individuals were selected independently from this population, we would expect

Math
Statisticsa. Find the critical value(s).
Select the correct choice below and fill in the answer box(es) within your choice.(Round to two decimal places as needed.)
A. There are two critical values; the lower critical value is and the upper critical value is
B. There is one critical value; the critical value is

Math
StatisticsA baseball team had a batting average of 0.245 with a standard deviation of 0.02. What is the probability that a player had a batting average between 0.245 and 0.305? Use the 68-95-99.7 normal distribution curve.

Math
StatisticsAnother baseball team had a batting average of 0.290 with a standard deviation of 0.04. What is the probability that a
player on that team had a batting average between 0.330 and .410? Use the 68-95-99.7 normal distribution curve.

Math
StatisticsIn a mid-size company, the distribution of the
number of phone calls answered each day by each of
the 12 receptionists is bell-shaped and has a mean of
38 and a standard deviation of 5. Using the empirical
rule (as presented in the book), what is the approximate percentage of daily phone calls numbering between 28 and 48?
Do not enter the percent symbol.
ans = %
![The function f(x) is continuous over the interval [−2, 5] and has a critical point at x = 1. If f" is negative on this
interval, which of the following is true?
f has an absolute minimum at x = 1
f has an absolute maximum at x = 1
f has a relative minimum, but not an absolute minimum at x = 1
f has a relative maximum, but not an absolute maximum at x 1](https://media.kunduz.com/media/sug-question/raw/69620837-1660112425.2685049.jpeg?w=256)
Math
StatisticsThe function f(x) is continuous over the interval [−2, 5] and has a critical point at x = 1. If f" is negative on this
interval, which of the following is true?
f has an absolute minimum at x = 1
f has an absolute maximum at x = 1
f has a relative minimum, but not an absolute minimum at x = 1
f has a relative maximum, but not an absolute maximum at x 1

Math
StatisticsIn the upcoming election for governor, the most recent poll, based on 900 respondents, predicts that the incumbent will be reelected with 55 percent of the votes. For the sake of argument, assume that 51 percent of the actual voters in the state support the incumbent governor (p= .51). Calculate the probability of observing a sample proportion of voters .55 or higher supporting the incumbent governor.
.0166
.0247
.0082
.9918

Math
StatisticsIn a recent year, the Better Business Bureau settled 75% of complaints they received. (Source: USA Today, March 2, 2009) You have been hired by the Bureau to investigate complaints this year involving computer stores. You plan to select a random sample of complaints to estimate the proportion of complaints the Bureau is able to settle. Assume the population proportion of complaints settled for the computer stores is the 0.75, as mentioned above. Suppose your sample size is 257. What is the probability that the sample proportion will be at least 4 percent more than the population proportion?

Math
StatisticsUse the table of critical values of the Pearson correlation coefficient to determine whether the correlation coefficient is statistically significant at the
specified level of significance for the given sample size. Write the critical value to the nearest thousandth.
r = 0.599.a = 0.05, n = 12

Math
StatisticsWhat is one potential problem with this simulation?
In order to run this simulation you would need to plot the data in a sampling distribution to see where the average shoe size was located.
This is not an appropriate situation in which to run a simulation. The best thing to do is to collect all of the data from the school.
The only shoe sizes that are represented are sizes 5-8. There are many males that have shoe sizes between 8 and 10. This is not a correct representation of the population.
This simulation is run correctly. They are randomly generating 50 numbers to represent the shoe sizes of males in the school.

Math
StatisticsUSE THE NORMAL CURVE TABLE TO DETERMINE THE PERCENT OF DATA SPECIFIED.
A) BETWEEN z = -1.34 AND z = 2.24
B) GREATER THAN z = -1.90
C) TO THE RIGHT OF 1.78
D) TO THE LEFT OF 1.62
E) BETWEEN z = -1.53 AND z = -1.82

Math
StatisticsA statistician uses Chebyshev's Theorem to estimate that at least 65 % of a population lies between the values 1 and 17. Use this information to find the values of the population mean, μ, and the population standard deviation o.
a) μ
b) o =

Math
StatisticsScores on a standardized test are normally distributed, perfectly symmetric and mound shaped, with a mean of 100 and a standard deviation of 20. If these scores are converted to standard normal z scores, which of the following statements will be correct?
The mean of the standardized z-scores will equal 100.
Both the mean and median score will equal 0.
The mean of the standardized z-scores will equal 5.
The mean will equal 0, but the median cannot be determined.

Math
StatisticsWrite the hypothesis.
1) A recent study claimed that more than 15% of junior high students are overweight. In a sample of 160 students,
18 were found to be overweight. At a = 0.05, test the claim.

Math
StatisticsAPPLICANCE WARRANTY-THE WARRANTY ON THE MOTOR OF A DISHWASHER IS
8 YEARS. IF THE BREAKDOWN TIMES OF THIS MOTOR ARE NORMALLY DISTRIBUTED, WITH A MEAN OF 10.2 YEARS AND A STANDARD DEVIAITON OF 1.8 YEARS, FIND THE PERCENT OF MOTORS THAT CAN BE EXPECTED TO REQUIRE REPAIR OR REPLACEMENT UNDER WARRANTY.

Math
StatisticsBody Mass Index: In a survey of adults with diabetes, the average body mass index (BMI) in a sample of
0.3. The average BMI in a sample of 1559men was 30.50 with a standard deviation of 0.6,
Part: 0/2
Part 1 of 2
99% confidence interval for the difference in the mean BMI between women and men with diabetes is <44-42₂ <0. 31.30 with a standard deviation of 99%
Construct confidence interval for the difference in the mean BMI between women and men with diabetes. Let H denote the mean BMI for women
with diabetes. Use tables to find the critical value and round the answers to at least two decimal places.
![For a data set of the pulse rates for a sample of adult females, the lowest pulse rate is 38 beats per minute, the mean of the listed pulse rates is x = 72.0 beats per minute, and their standard deviation is s = 19.1 beats per minute.
a. What is the difference between the pulse rate of 38 beats per minute and the mean pulse rate of the females?
b. How many standard deviations is that [the difference found in part (a)]?
c. Convert the pulse rate of 38 beats per minutes to a z score.
d. If we consider pulse rates that convert to z scores between -2 and 2 to be neither significantly low nor significantly high, is the pulse rate of 38 beats per minute significant?](https://media.kunduz.com/media/sug-question/raw/57004973-1659978343.8015022.jpeg?w=256)
Math
StatisticsFor a data set of the pulse rates for a sample of adult females, the lowest pulse rate is 38 beats per minute, the mean of the listed pulse rates is x = 72.0 beats per minute, and their standard deviation is s = 19.1 beats per minute.
a. What is the difference between the pulse rate of 38 beats per minute and the mean pulse rate of the females?
b. How many standard deviations is that [the difference found in part (a)]?
c. Convert the pulse rate of 38 beats per minutes to a z score.
d. If we consider pulse rates that convert to z scores between -2 and 2 to be neither significantly low nor significantly high, is the pulse rate of 38 beats per minute significant?

Math
Statistics7.40 Testing a random number generator. Statistical software has a "random number
generator" that is supposed to produce numbers uniformly distributed between 0 and
1. If this is true, the numbers generated come from a population with = 0.5. A command to generate 100 random numbers gives outcomes with mean = 0.531 and s = 0.294. Because the sample is reasonably large, take the population standard deviation also to be o = 0.294. Do we have evidence that the mean of all numbers produced by this software is not 0.5?

Math
StatisticsFurnace repair bills are normally distributed with a mean of 269 dollars and a standard deviation of 20 dollars. If 64 of these repair bills are randomly selected, find the
probability that they have a mean cost between 269 dollars and 271 dollars.
0.7881
0.2881
0.5517
0.2119

Math
StatisticsConsider a population of size N = 9, 800 with a mean of μ = 161 and standard deviation of a = 17. Compute the following z-values for either the population distribution or the sampling distributions of with given sample size. Round solutions to two decimal places, if necessary. Suppose a random single observations is selected from the population. Calculate the z-value that corresponds to x = 165. Suppose a random single observations is selected from the population. Calculate the z-value that corresponds
to x = 157.

Math
StatisticsA student at a junior college conducted a survey of 20 randomly selected full-time students to determine the relation between the number of hours of video game playing each week, x, and grade-point average, y. She found that a linear relation exists between the two variables. The least-squares regression line that describes this relation is y = -0.0507x+2.9232.
(a) Predict the grade-point average of a student who plays video games 8 hours per week. The predicted grade-point average is (Round to the nearest hundredth as needed.)


Math
StatisticsA town that had 4000 people at the beginning of the year 2000 has been decreasing by 3.1% per year.
(a) What is the 1-year percent change in the city's population?
(b) Whenever 1 year passes, the population becomes what percent of its previous value? (That is, the "new" population is what percent of the "old" population whenever 1 year passes?)
(c) What is the 1-year growth factor for the population of the city?
(d) Write a function g that determines the population of the city (in number of people) in terms of the number of years t since the beginning of 2000.
g(t)=

Math
StatisticsSamples of size n = 900 are randomly selected from the population of numbers (O through 9) produced by a random-number generator, and the proportion of numbers 2 5 is found for each sample. What is the distribution of the sample proportions?
skewed to the right
normal (approximately)
skewed to the left
not enough information provided

Math
StatisticsGiven a sample size n, how will the distribution of the sample mean behave?
unable to discern from this information
like the original distribution
like the normal distribution
like the uniform distribution

Math
StatisticsSamples of size n = 90 are randomly selected from the population of numbers (0 through 9) produced by a random-number generator, and the variance is found for each sample. What is the distribution of the sample variances?
skewed to the left
normal (approximately)
skewed to the right
not enough information provided

Math
StatisticsYou owe $190 on your credit card. The minimum payment is $20.00 and the interest rate on the credit card is 1.8%. What is the interest charged?

Math - Others
StatisticsScientists researching crickets have observed that the rate at which a certain species chirps may be related to their surrounding temperature. The table below contains chirping rates of crickets for various temperatures.
Temperature (°F) 55 60 65 70 75 80 85 90
Chirping Rate (chirps per minute) 21 46 79 91 123 140 173 198
Find the equation of a linear regression model that is appropriate for this data.
a. y = 5x - 252
b. y = -252x + 5
c. y = 5x – 220
d. y = -220x + 5

Math - Others
StatisticsThe data below shows the height of a Ferris wheel at different points
in time.
x (time in m) 0 3 6 9 12
y (height in m) 10 50 92 50 10
Using the regression model, y= -41 sin(.53x – 117.86) + 51, find the residual for 9 minutes.
O-.7
O 38.7
O 88.7
O 50.7

Math
StatisticsA population of values has a normal distribution with μ=152.1 and σ= 6.7. You intend to draw a random sample of size n = 25.
First calculate z, round it to two (2) decimal places, then use the rounded z-score to determine the required probability accurate to four (4) decimal places.
1. Find the probability that a single randomly selected value is less than 155.5.
P(x < 155.5) =
2. Find the probability that a sample of size n = 25 is randomly selected with a mean less than 155.5.
P(x < 155.5) =

Math
StatisticsIn a study of the cost of speeding tickets across the nation, the cost is reported to be Normally distributed with a mean of $152. A local newspaper believes that the cost of speeding tickets in her county is higher. She takes a SRS of 35 speeding tickets and finds a mean cost of $158 with a sample standard deviation of $15. Select the correct p-value that would be used for conducting an hypothesis test to determine if the mean cost of speeding tickets in her county is higher than the national average. 0.0119
0.0062
0.0090
0.0098
0.0015
0.0028

Math
StatisticsThe use of a tremendously large sample does not solve the question of quality for an estimator. What problems do you anticipate with very large samples? (Select all that ap
increase in standard error
cost of sampling
difficulty in obtaining a very large sample
Oless outlier data
none of these

Math
StatisticsUsing a calculator or statistical software, find the linear regression line for the data in the table below. Enter your answer in the form y = mx +b, with m and b both rounded to two decimal places.
x 3 4 5 6 7 8 9 10 11
y 6.17 5.77 4.97 7.21 5.89 9.74 9.3 8 8.88

Math
StatisticsThe manager of a DVD rental store analyzed the number of DVD rentals (y) to the number of weeks the DVD had been available (x) and found a strong negative correlation. What
does this mean?
As the number of weeks the DVD has been available increases, the number of rentals of that DVD increases.
As the number of weeks the DVD has been available increases, the number of rentals of that DVD decreases.
No customers rent old DVDs.
When a DVD is new, it causes people to rent it.
Math
StatisticsIf 15% of adults in a certain country work from home what is the probability that fewer than 30 out of a random sample of 250 adults will work from home? (Round your answer to 3 decimal places)
Math
StatisticsA researcher studying public opinion of proposed Social Security changes obtains a simple random sample of 50 adult Americans and asks them whether or not they
support the proposed changes. To say that the distribution of the sample proportion of adults who respond yes, is approximately normal, how many more adult
Americans does the researcher need to sample in the following cases?
(a) 15% of all adult Americans support the changes
(b) 20% of all adult Americans support the changes
(a) The researcher must ask___more American adults. (Round up to the nearest integer.)
Math
StatisticsA student satisfaction survey was completed with respect to the middle school
cafeteria. Two methods were discussed. Decide which method is better and why.
Method A: A survey of 65 students randomly selected from a list of all students in
the school was conducted. Sixty percent said they are satisfied with the food in the
cafeteria.
Method B: 40 students in two seventh-grade math classes were surveyed and 70%
stated they were satisfied with the food in the cafeteria.
Math
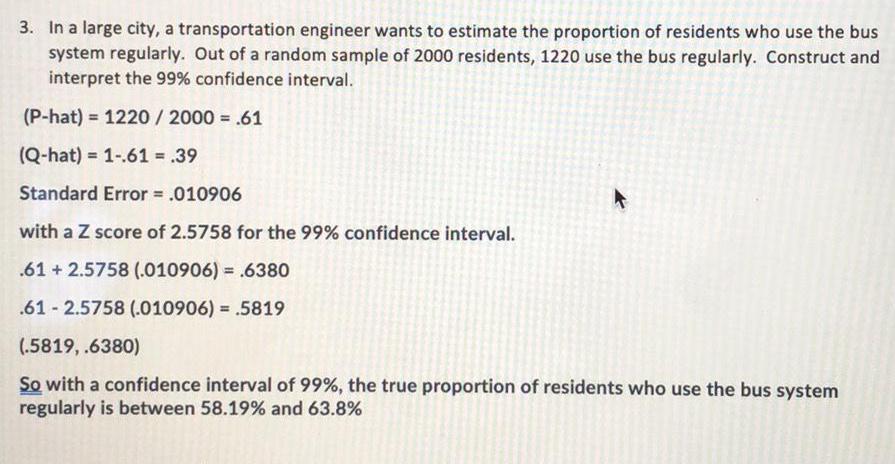
StatisticsIn a large city, a transportation engineer wants to estimate the proportion of residents who use the bus system regularly. Out of a random sample of 2000 residents, 1220 use the bus regularly. Construct and interpret the 99% confidence interval.
(P-hat) = 1220 / 2000 = .61
(Q-hat) 1-.61 = .39
Standard Error = .010906
with a Z score of 2.5758 for the 99% confidence interval.
.61 +2.5758 (.010906) = .6380
.612.5758 (.010906) = .5819
(.5819, .6380)
So with a confidence interval of 99%, the true proportion of residents who use the bus system regularly is between 58.19% and 63.8%
Math
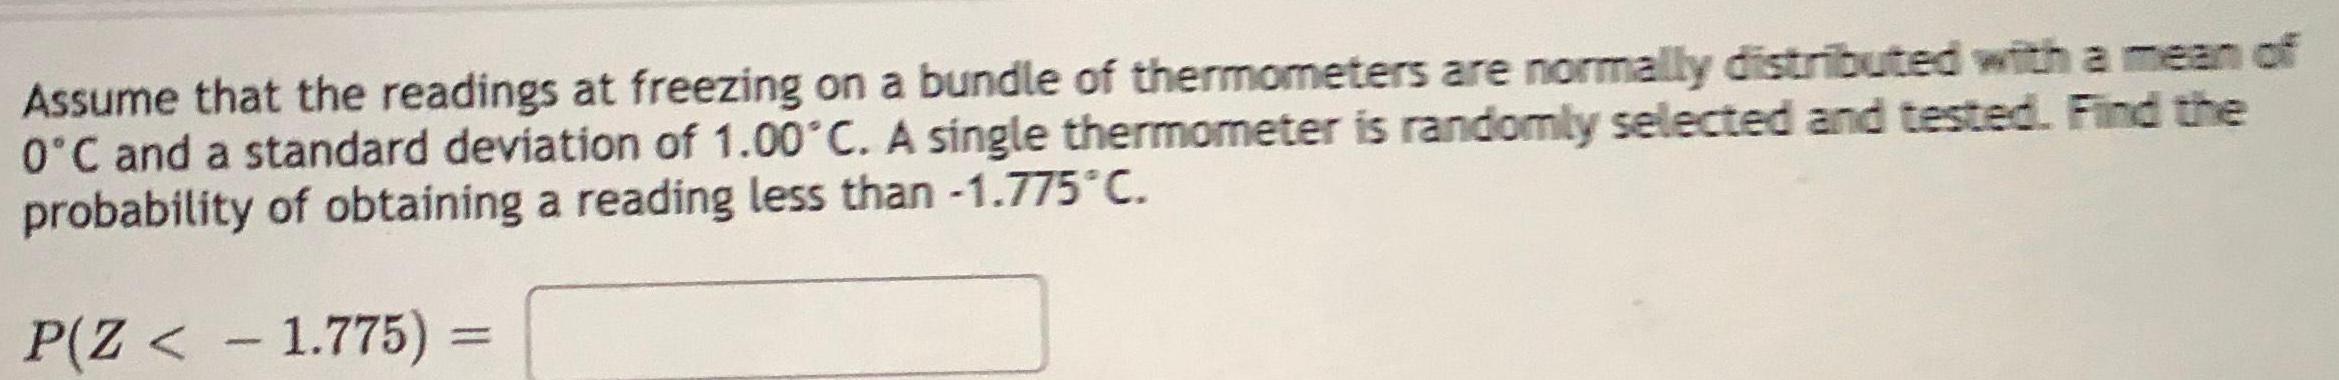
StatisticsAssume that the readings at freezing on a bundle of thermometers are normally distributed with a mean of 0°C and a standard deviation of 1.00°C. A single thermometer is randomly selected and tested. Find the probability of obtaining a reading less than -1.775°C.
P(Z < -1.775) =
Math
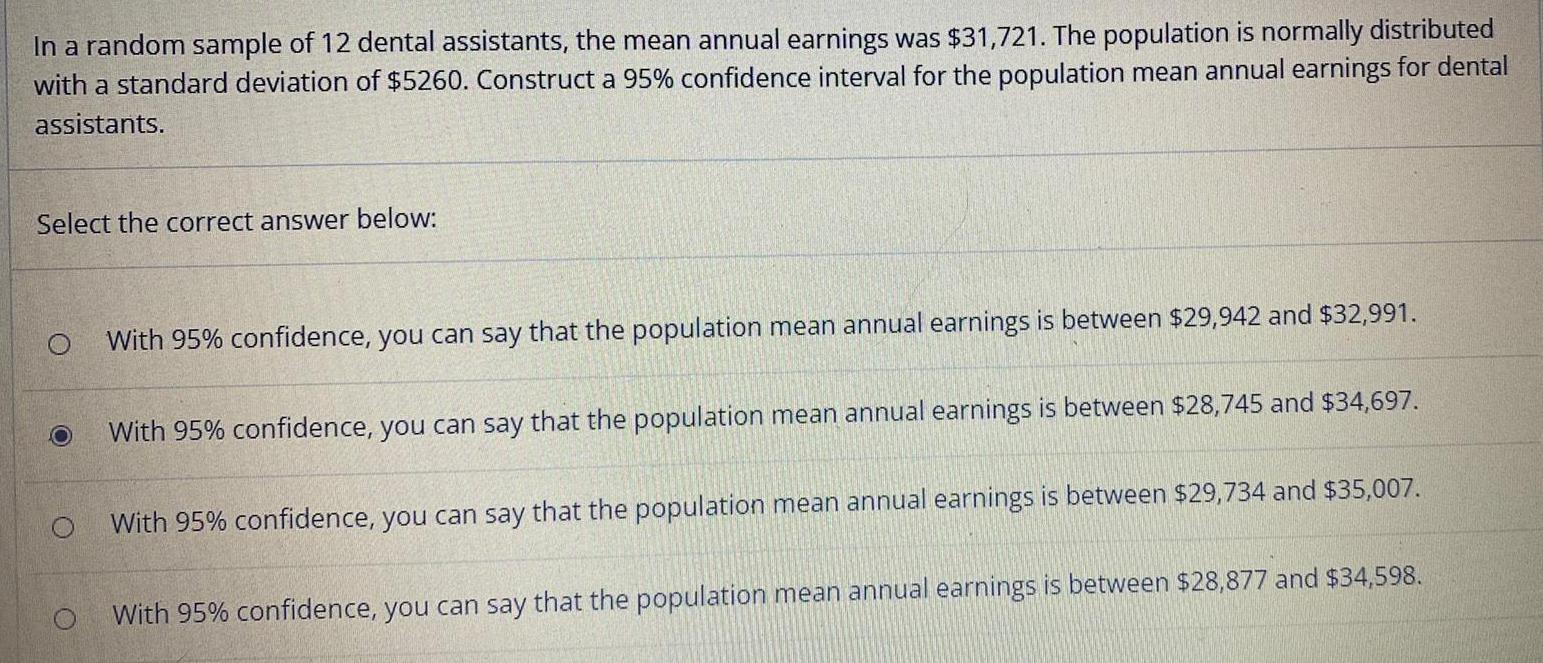
StatisticsIn a random sample of 12 dental assistants, the mean annual earnings was $31,721. The population is normally distributed with a standard deviation of $5260. Construct a 95% confidence interval for the population mean annual earnings for dental assistants.
Select the correct answer below:
With 95% confidence, you can say that the population mean annual earnings is between $29,942 and $32,991.
With 95% confidence, you can say that the population mean annual earnings is between $28,745 and $34,697.
With 95% confidence, you can say that the population mean annual earnings is between $29,734 and $35,007.
With 95% confidence, you can say that the population mean annual earnings is between $28,877 and $34,598.