Statistics Questions and Answers
Math
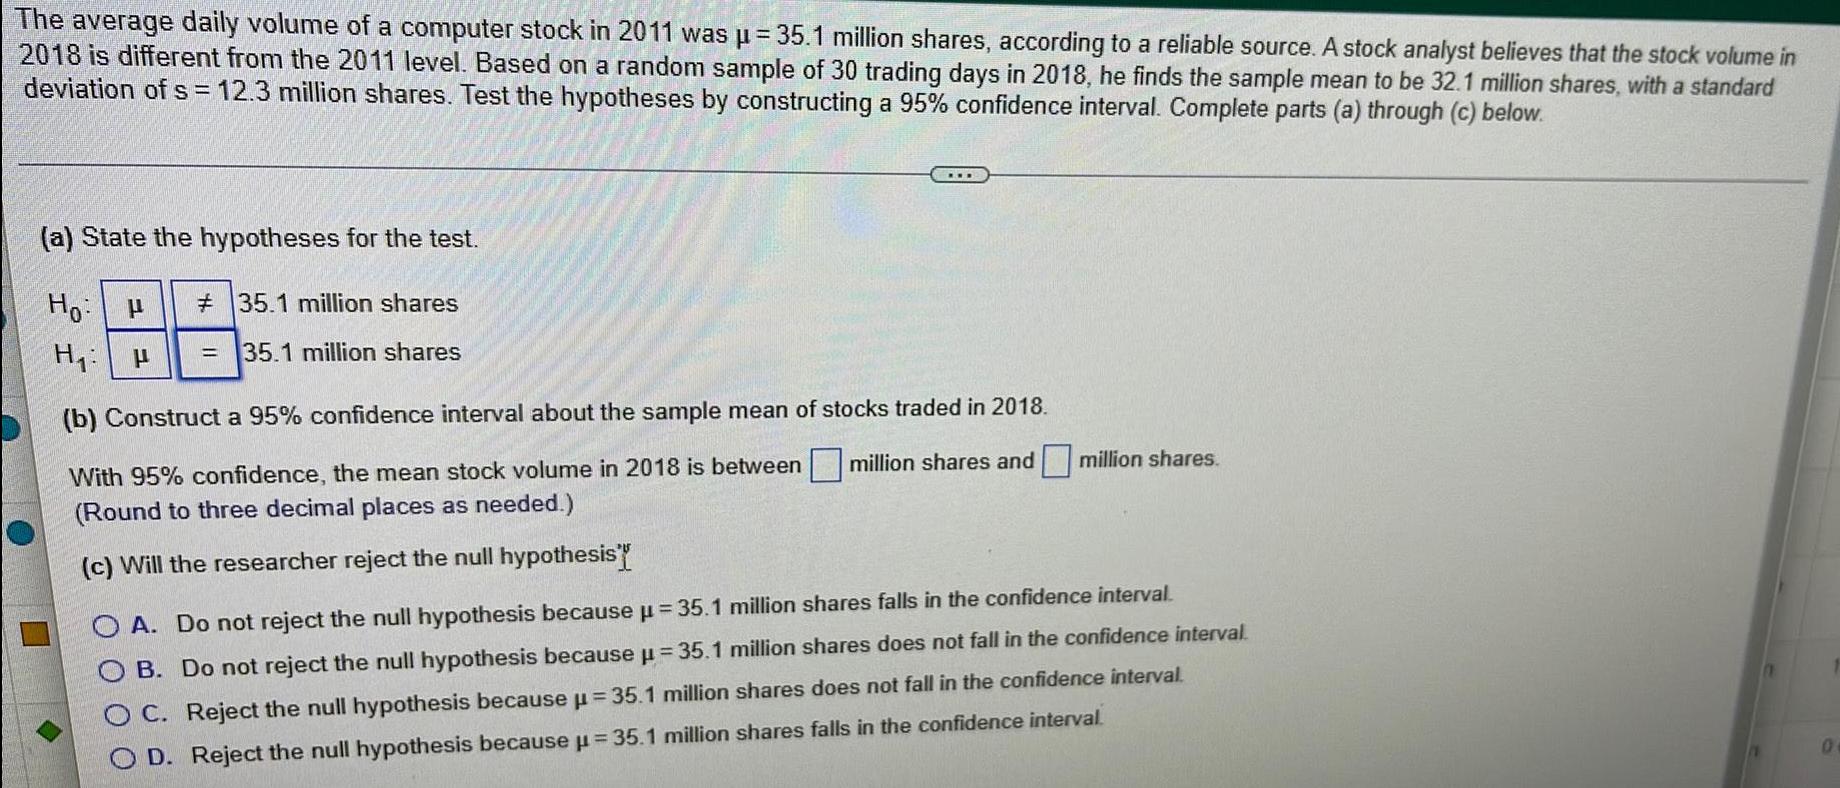
StatisticsThe average daily volume of a computer stock in 2011 was μ = 35.1 million shares, according to a reliable source. A stock analyst believes that the stock volume in
2018 is different from the 2011 level. Based on a random sample of 30 trading days in 2018, he finds the sample mean to be 32.1 million shares, with a standard
deviation of s = 12.3 million shares. Test the hypotheses by constructing a 95% confidence interval. Complete parts (a) through (c) below.
(a) State the hypotheses for the test.
Ho: µ ≠ 35.1 million shares
H₁: µ = 35.1 million shares
(b) Construct a 95% confidence interval about the sample mean of stocks traded in 2018. million shares and million shares.
With 95% confidence, the mean stock volume in 2018 is between
(Round to three decimal places as needed.)
(c) Will the researcher reject the null hypothesis
A. Do not reject the null hypothesis because μ = 35.1 million shares falls in the confidence interval.
B. Do not reject the null hypothesis because μ = 35.1 million shares does not fall in the confidence interval.
C. Reject the null hypothesis because μ = 35.1 million shares does not fall in the confidence interval.
D. Reject the null hypothesis because μ = 35.1 million shares falls in the confidence interval
Math
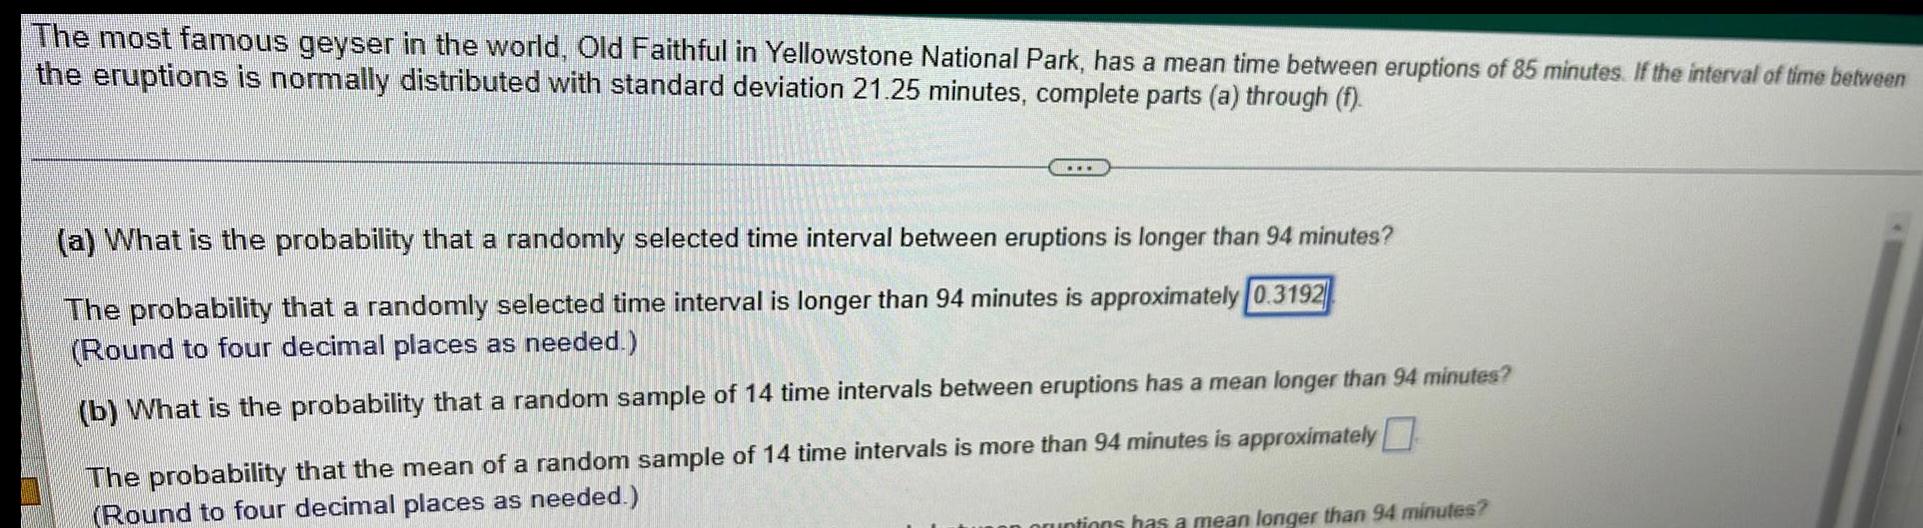
StatisticsThe most famous geyser in the world, Old Faithful in Yellowstone National Park, has a mean time between eruptions of 85 minutes. If the interval of time between the eruptions is normally distributed with standard deviation 21.25 minutes, complete parts (a) through (f).
(a) What is the probability that a randomly selected time interval between eruptions is longer than 94 minutes?
The probability that a randomly selected time interval is longer than 94 minutes is approximately 0.3192
(Round to four decimal places as needed.)
(b) What is the probability that a random sample of 14 time intervals between eruptions has a mean longer than 94 minutes?
The probability that the mean of a random sample of 14 time intervals is more than 94 minutes is approximately noruptions has a mean longer than 94 minutes?
Math
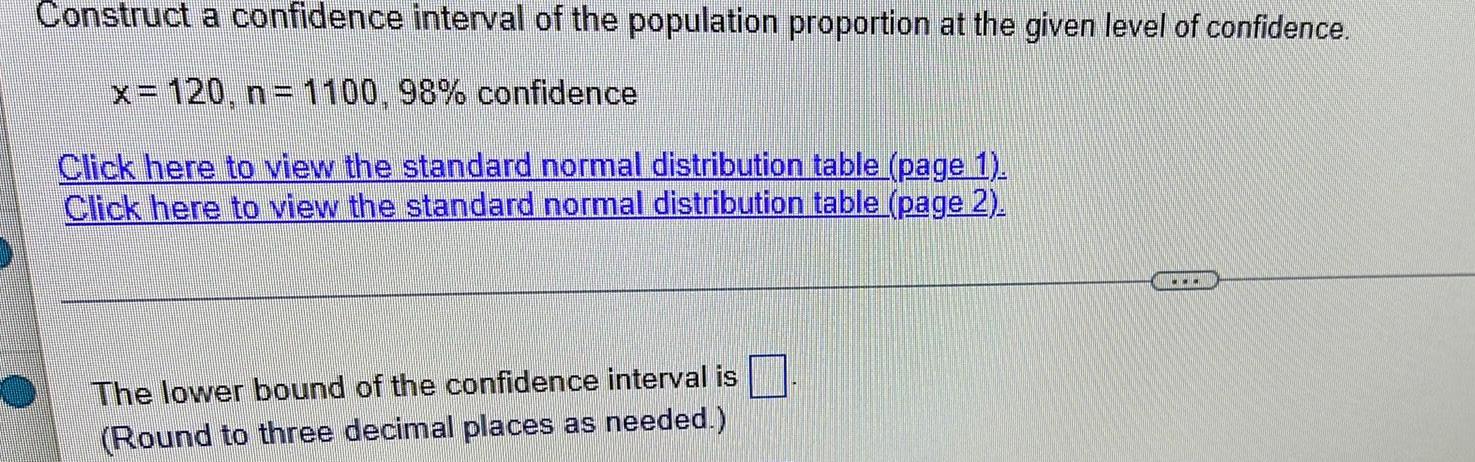
StatisticsConstruct a confidence interval of the population proportion at the given level of confidence.
x= 120, n= 1100, 98% confidence
The lower bound of the confidence interval is
Math
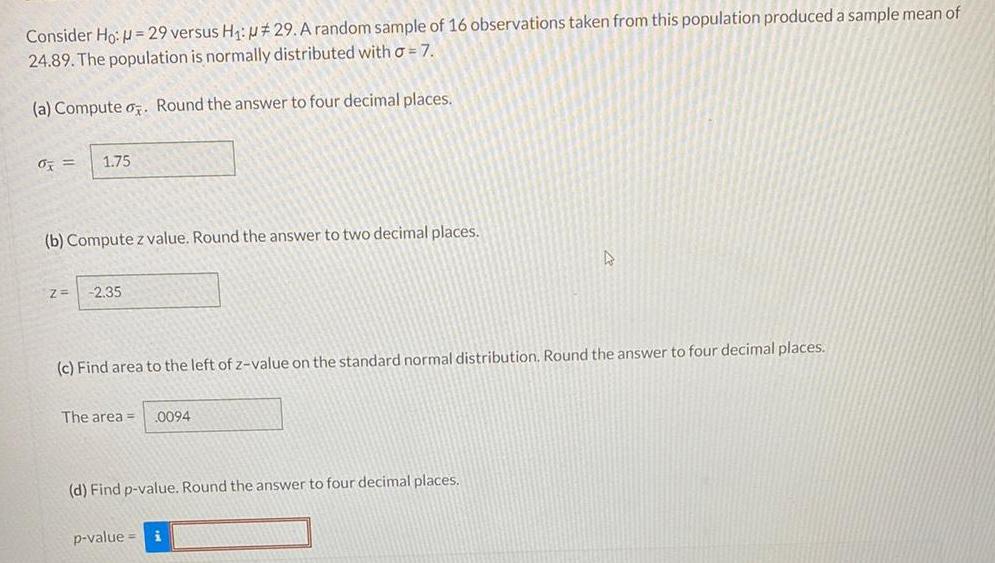
StatisticsConsider Ho: = 29 versus H₁: #29. A random sample of 16 observations taken from this population produced a sample mean of 24.89. The population is normally distributed with a = 7.
(a) Compute . Round the answer to four decimal places.
% = 1.75
(b) Compute z value. Round the answer to two decimal places.
(c) Find area to the left of z-value on the standard normal distribution. Round the answer to four decimal places.
(d) Find p-value. Round the answer to four decimal places.
Math
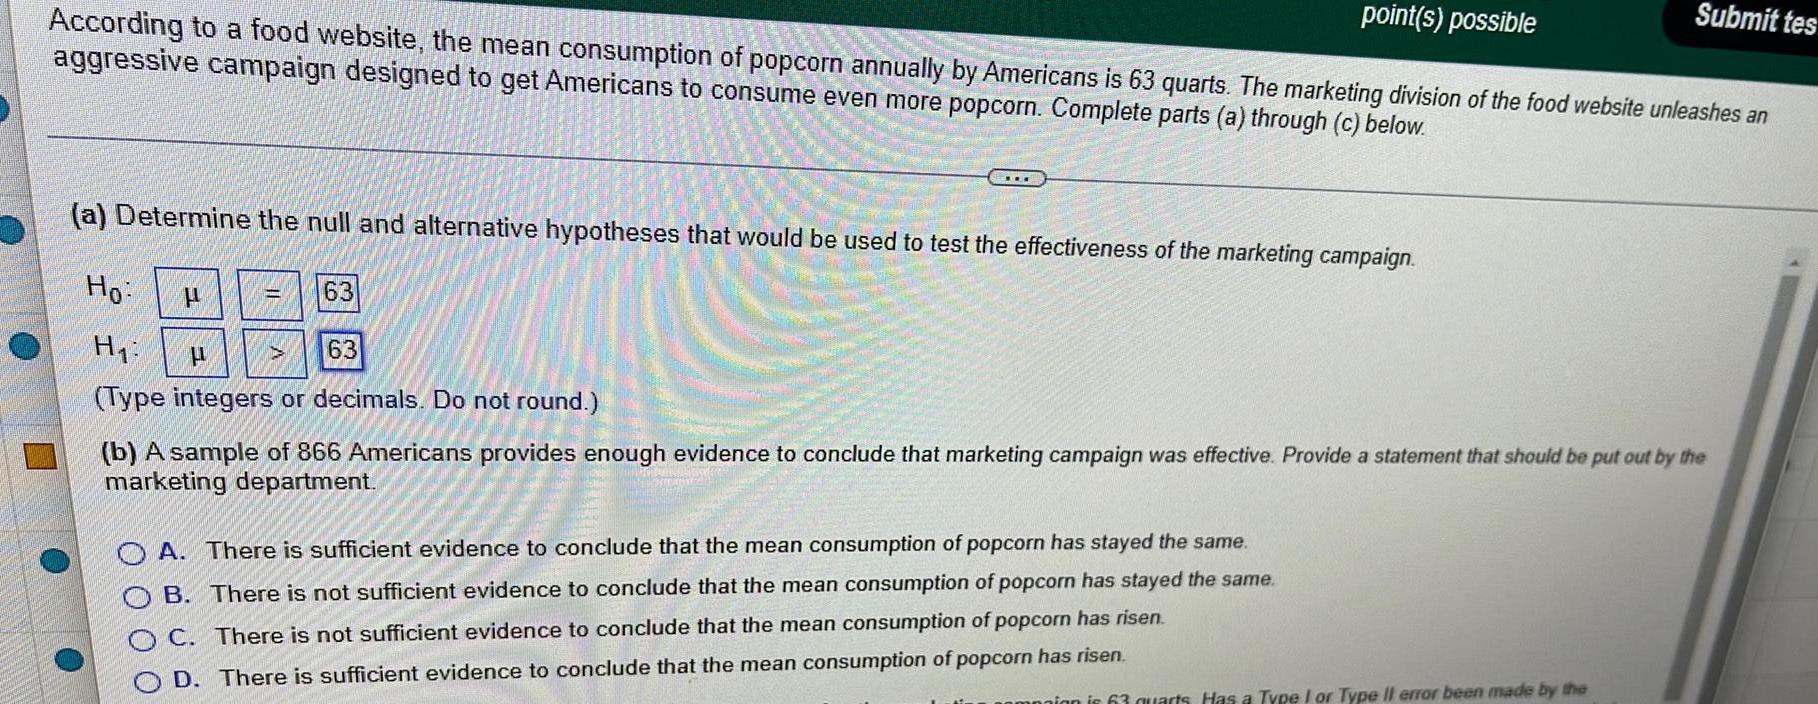
StatisticsAccording to a food website, the mean consumption of popcorn annually by Americans is 63 quarts. The marketing division of the food website unleashes an
aggressive campaign designed to get Americans to consume even more popcorn. Complete parts (a) through (c) below.
(a) Determine the null and alternative hypotheses that would be used to test the effectiveness of the marketing campaign.
(b) A sample of 866 Americans provides enough evidence to conclude that marketing campaign was effective. Provide a statement that should be put out by the
marketing department.
A. There is sufficient evidence to conclude that the mean consumption of popcorn has stayed the same.
B. There is not sufficient evidence to conclude that the mean consumption of popcorn has stayed the same.
OC. There is not sufficient evidence to conclude that the mean consumption of popcorn has risen.
D. There is sufficient evidence to conclude that the mean consumption of popcorn has risen.
Math
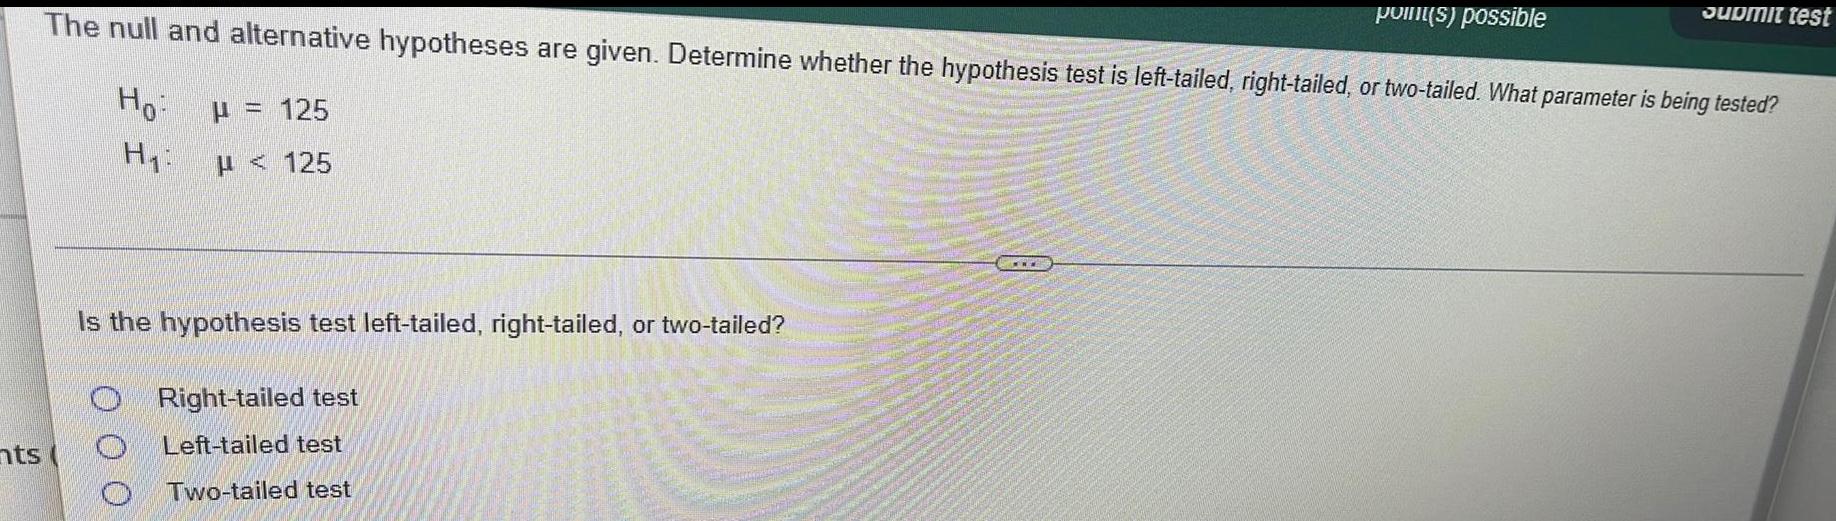
StatisticsIs the hypothesis test left-tailed, right-tailed, or two-tailed?
The null and alternative hypotheses are given. Determine whether the hypothesis test is left-tailed, right-tailed, or two-tailed. What parameter is being tested?
Ho μ = 125
H₁: μ < 125
Right-tailed test
Left-tailed test
Two-tailed test
Submit test
Math
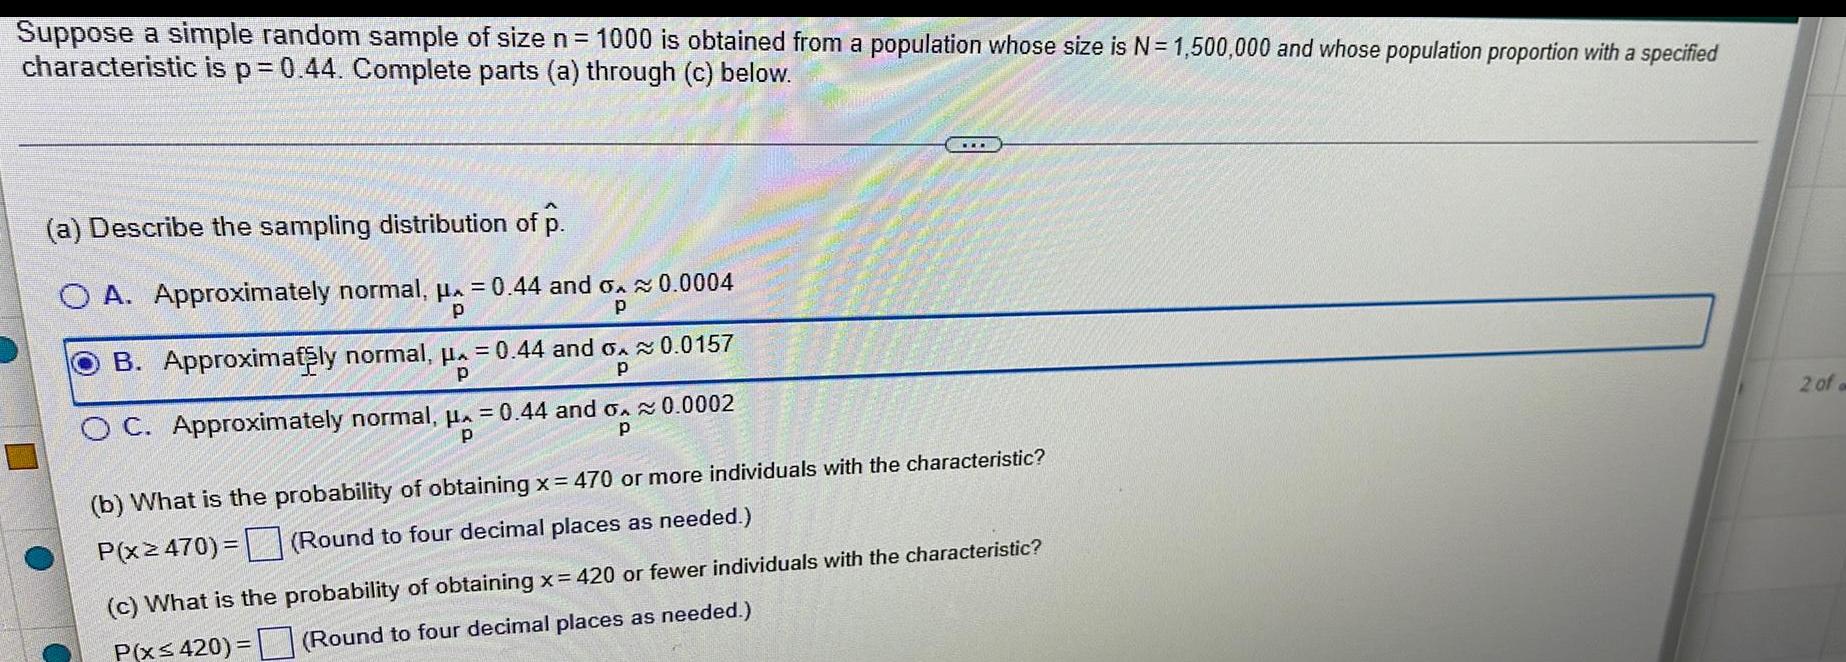
StatisticsSuppose a simple random sample of size n = 1000 is obtained from a population whose size is N= 1,500,000 and whose population proportion with a specified
characteristic is p = 0.44. Complete parts (a) through (c) below.
(a) Describe the sampling distribution of p.
A. Approximately normal, μ = 0.44 and o≈ 0.0004
B. Approximately normal, μ = 0.44 and ≈ 0.0157
C. Approximately normal, μ = 0.44 and o.≈ 0.0002
(b) What is the probability of obtaining x = 470 or more individuals with the characteristic?
Math
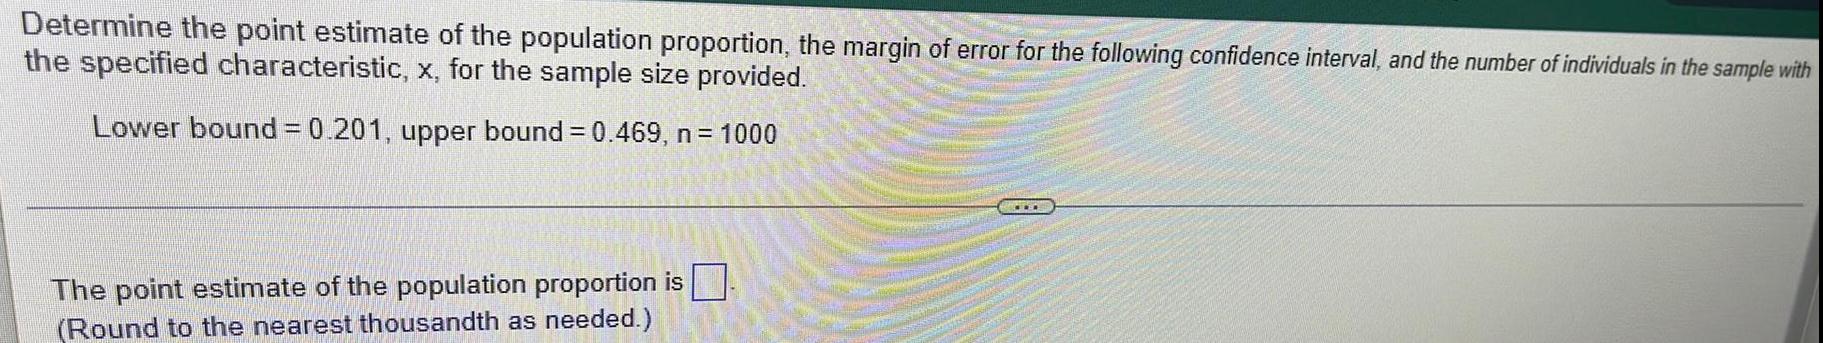
StatisticsDetermine the point estimate of the population proportion, the margin of error for the following confidence interval, and the number of individuals in the sample with the specified characteristic, x, for the sample size provided. Lower bound = 0.201, upper bound = 0.469, n = 1000
Math
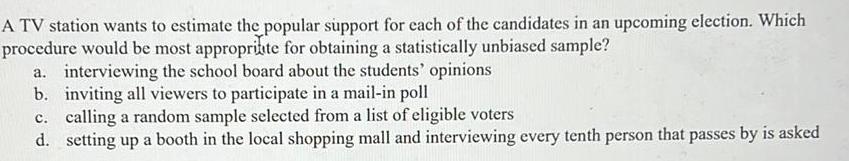
StatisticsA TV station wants to estimate the popular support for each of the candidates in an upcoming election. Which procedure would be most appropriate for obtaining a statistically unbiased sample?
a. interviewing the school board about the students' opinions
b. inviting all viewers to participate in a mail-in poll
c. calling a random sample selected from a list of eligible voters
d. setting up a booth in the local shopping mall and interviewing every tenth person that passes by is asked
Math
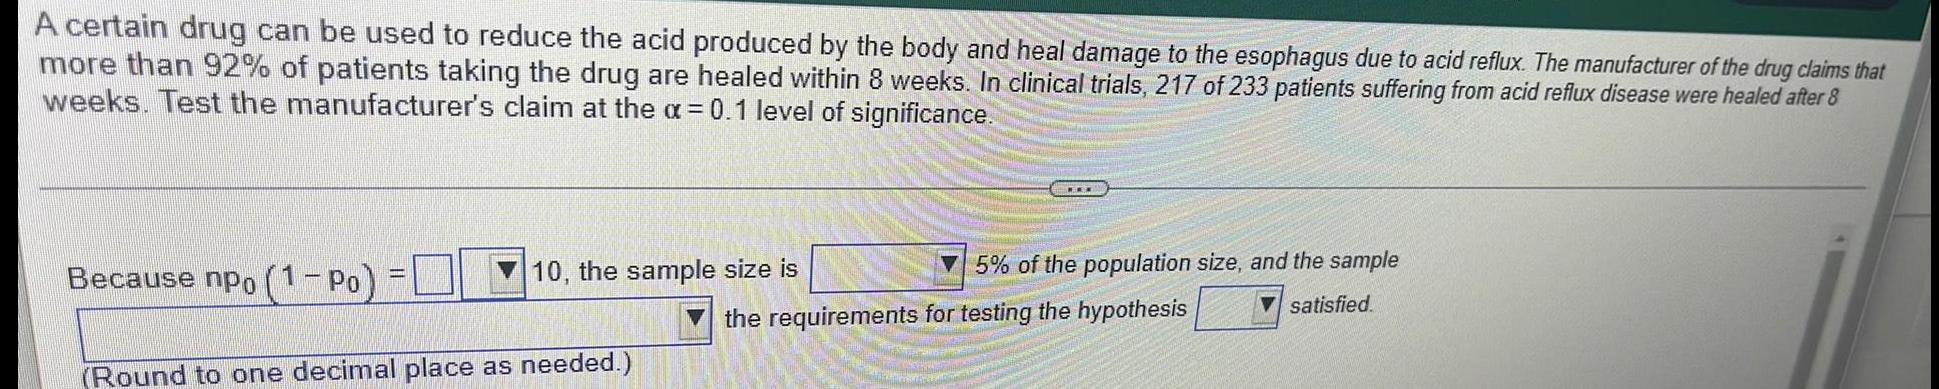
StatisticsA certain drug can be used to reduce the acid produced by the body and heal damage to the esophagus due to acid reflux. The manufacturer of the drug claims that more than 92% of patients taking the drug are healed within 8 weeks. In clinical trials, 217 of 233 patients suffering from acid reflux disease were healed after 8 weeks. Test the manufacturer's claim at the α = 0.1 level of significance.
Math
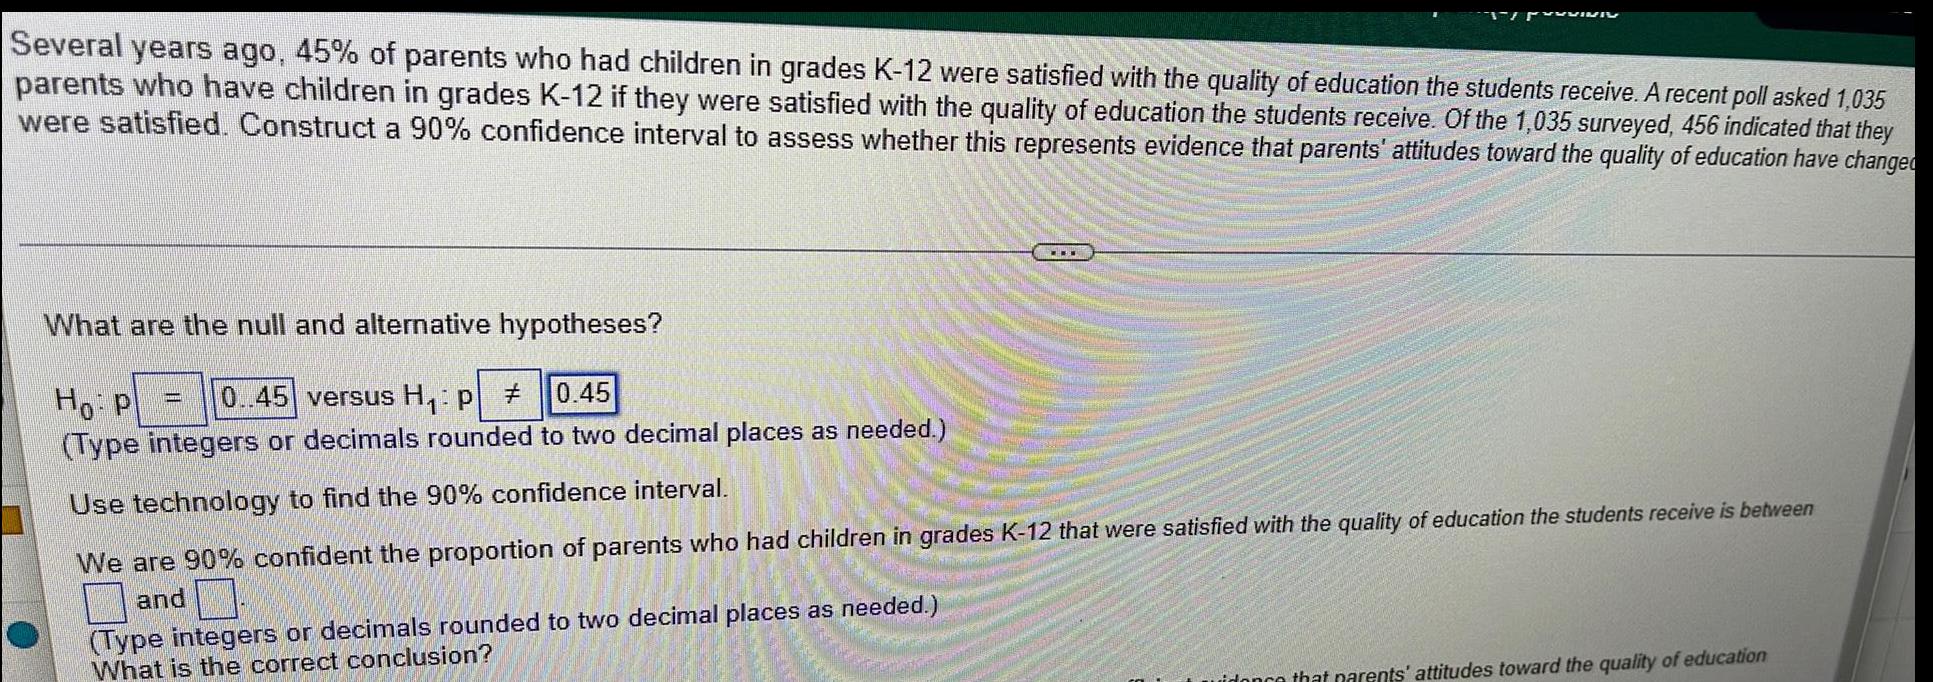
StatisticsSeveral years ago, 45% of parents who had children in grades K-12 were satisfied with the quality of education the students receive. A recent poll asked 1,035 parents who have children in grades K-12 if they were satisfied with the quality of education the students receive. Of the 1,035 surveyed, 456 indicated that they were satisfied. Construct a 90% confidence interval to assess whether this represents evidence that parents' attitudes toward the quality of education have changed What are the null and alternative hypotheses? Use technology to find the 90% confidence interval. What is the correct conclusion? We are 90% confident the proportion of parents who had children in grades K-12 that were satisfied with the quality of education the students receive is between idence that parents' attitudes toward the quality of education
Math
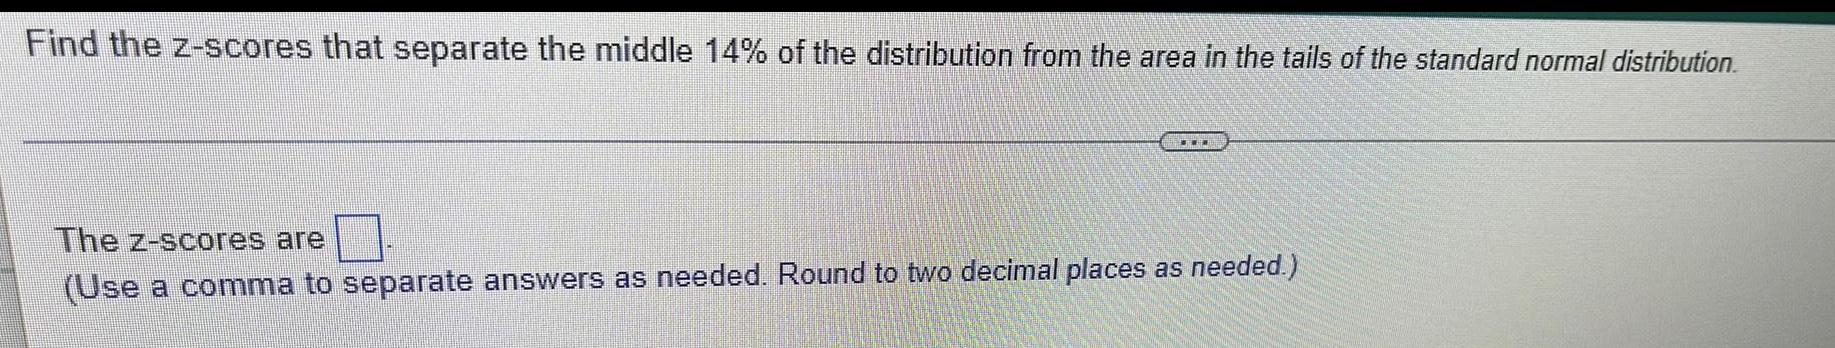
StatisticsFind the z-scores that separate the middle 14% of the distribution from the area in the tails of the standard normal distribution.
Math
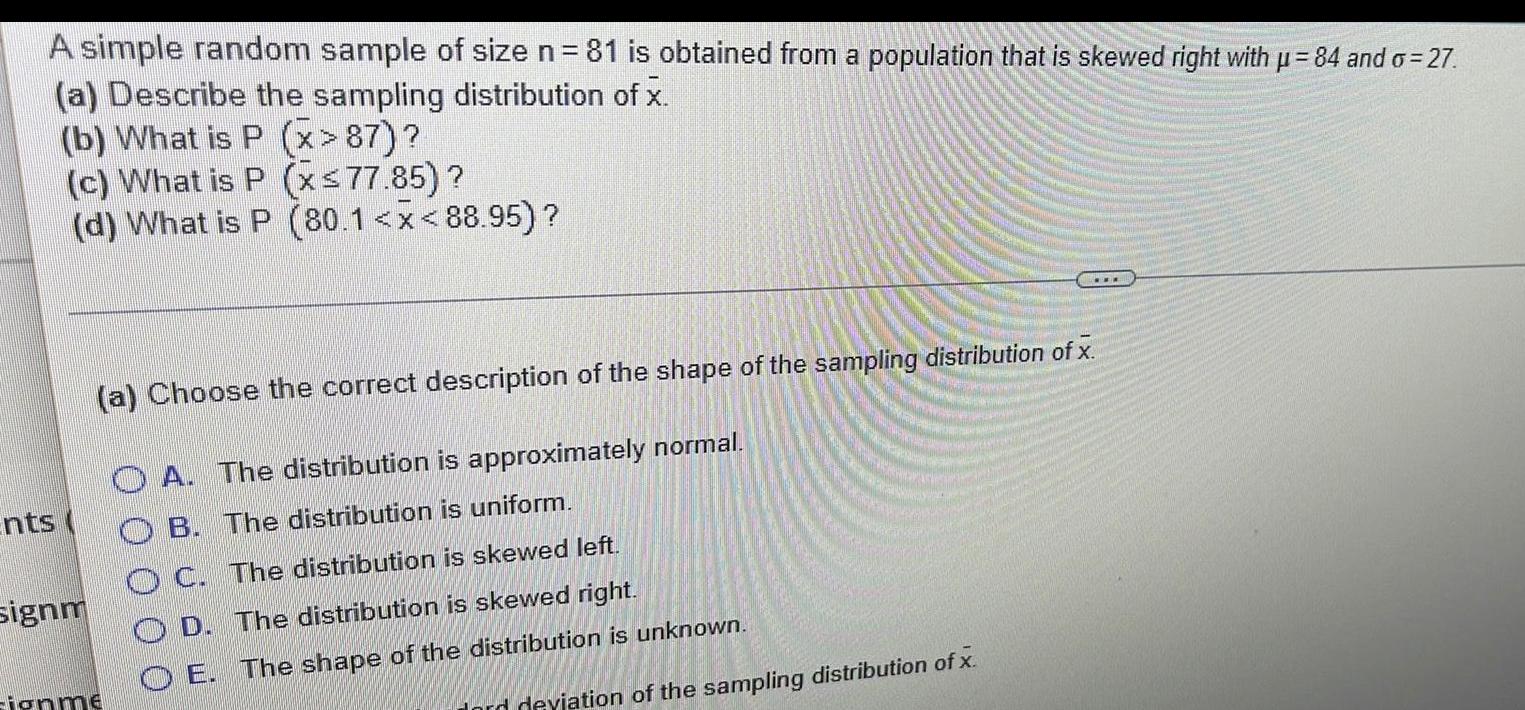
StatisticsA simple random sample of size n = 81 is obtained from a population that is skewed right with µ-84 and σ = 27.
(a) Describe the sampling distribution of x.
(b) What is P (x>87)?
(c) What is P (x≤77.85) ?
(d) What is P (80.1<x<88.95)?
(a) Choose the correct description of the shape of the sampling distribution of x.
A. The distribution is approximately normal.
B. The distribution is uniform.
C. The distribution is skewed left.
D. The distribution is skewed right.
Math
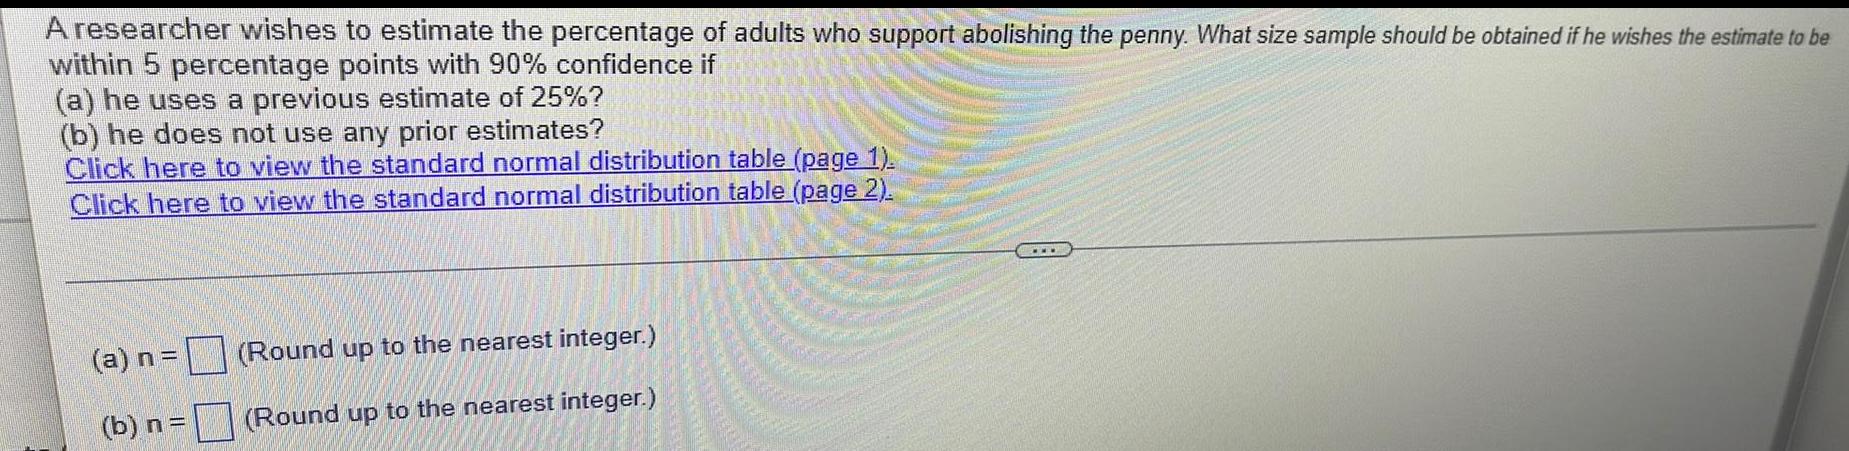
StatisticsA researcher wishes to estimate the percentage of adults who support abolishing the penny. What size sample should be obtained if he wishes the estimate to be
within 5 percentage points with 90% confidence if
(a) he uses a previous estimate of 25%?
(b) he does not use any prior estimates?
Click here to view the standard normal distribution table (page 1).
Click here to view the standard normal distribution table (page 2).
(a) n =
(b) n =
(Round up to the nearest integer.)
(Round up to the nearest integer.)
Math
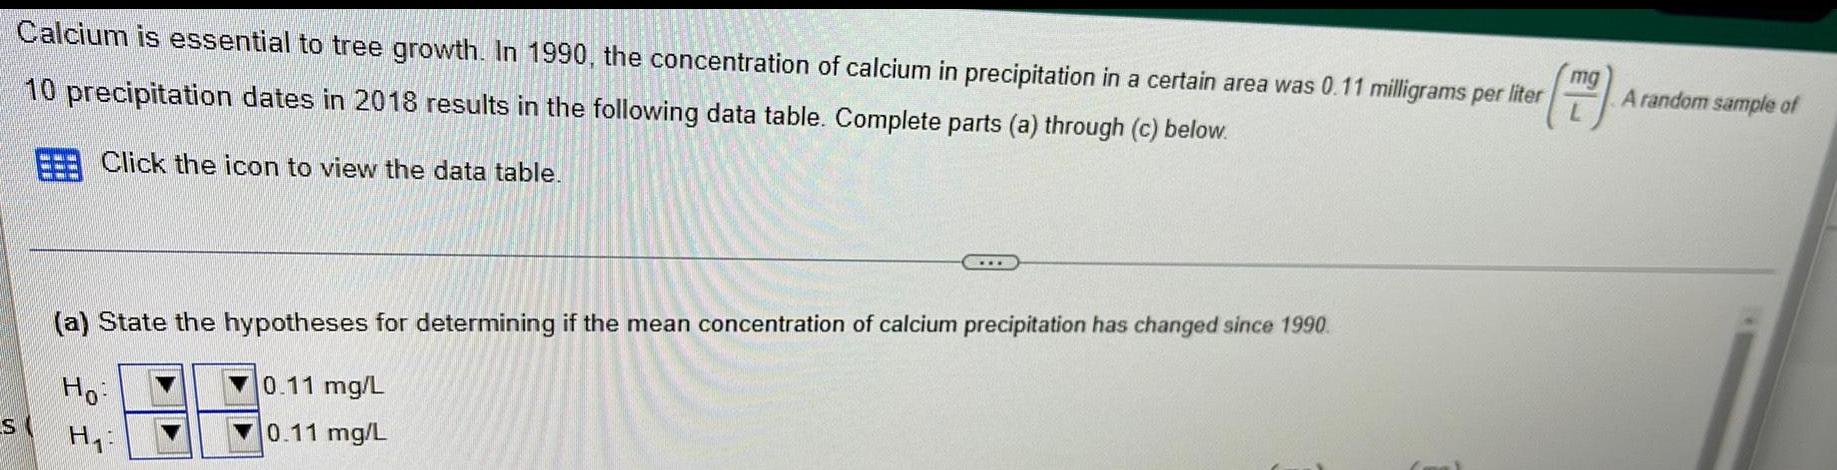
StatisticsCalcium is essential to tree growth. In 1990, the concentration of calcium in precipitation in a certain area was 0.11 milligrams per liter 10 precipitation dates in 2018 results in the following data table. Complete parts (a) through (c) below.
Click the icon to view the data table.
(a) State the hypotheses for determining if the mean concentration of calcium precipitation has changed since 1990.
0.11 mg/L
0.11 mg/L
Ho
H₁:
A random sample of
Math
StatisticsS
point(s) possible
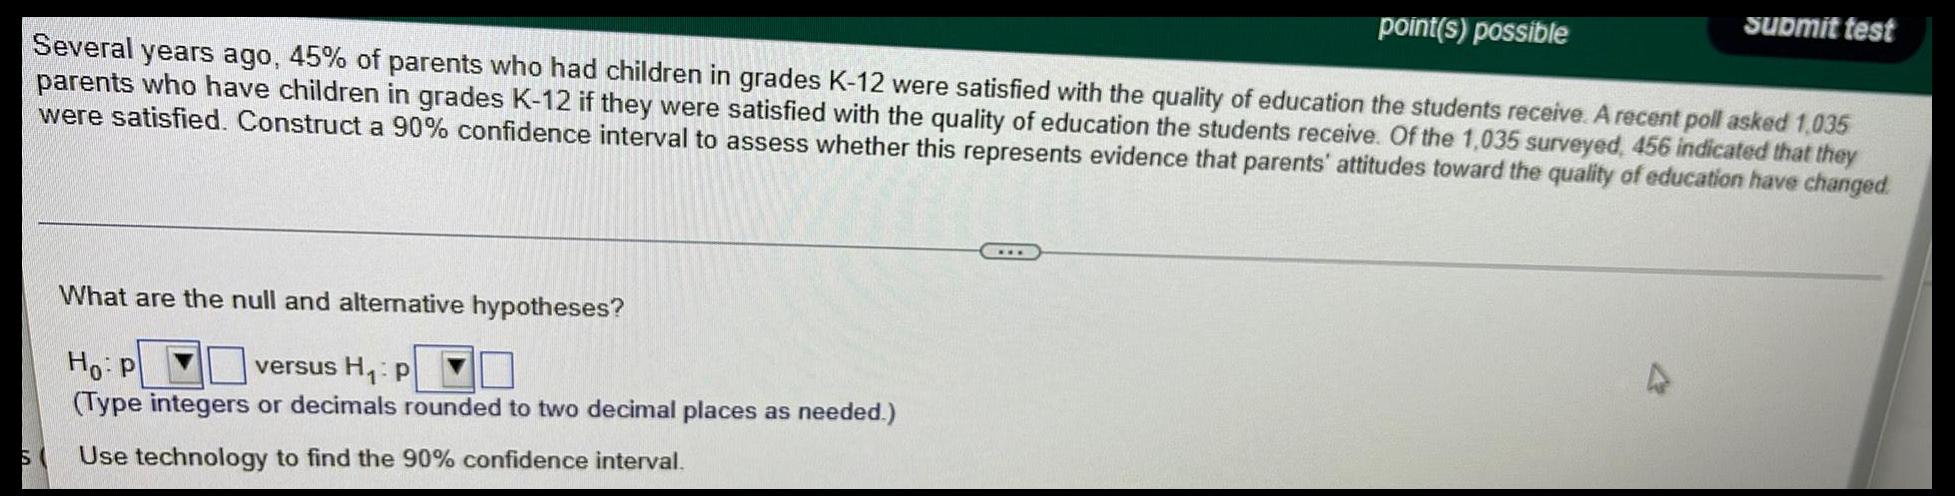
Several years ago, 45% of parents who had children in grades K-12 were satisfied with the quality of education the students receive. A recent poll asked 1,035
parents who have children in grades K-12 if they were satisfied with the quality of education the students receive. Of the 1,035 surveyed, 456 indicated that they
were satisfied. Construct a 90% confidence interval to assess whether this represents evidence that parents' attitudes toward the quality of education have changed.
What are the null and alternative hypotheses?
Ho: P
versus H₁: p
(Type integers or decimals rounded to two decimal places as needed.)
Use technology to find the 90% confidence interval.
submit test
Math
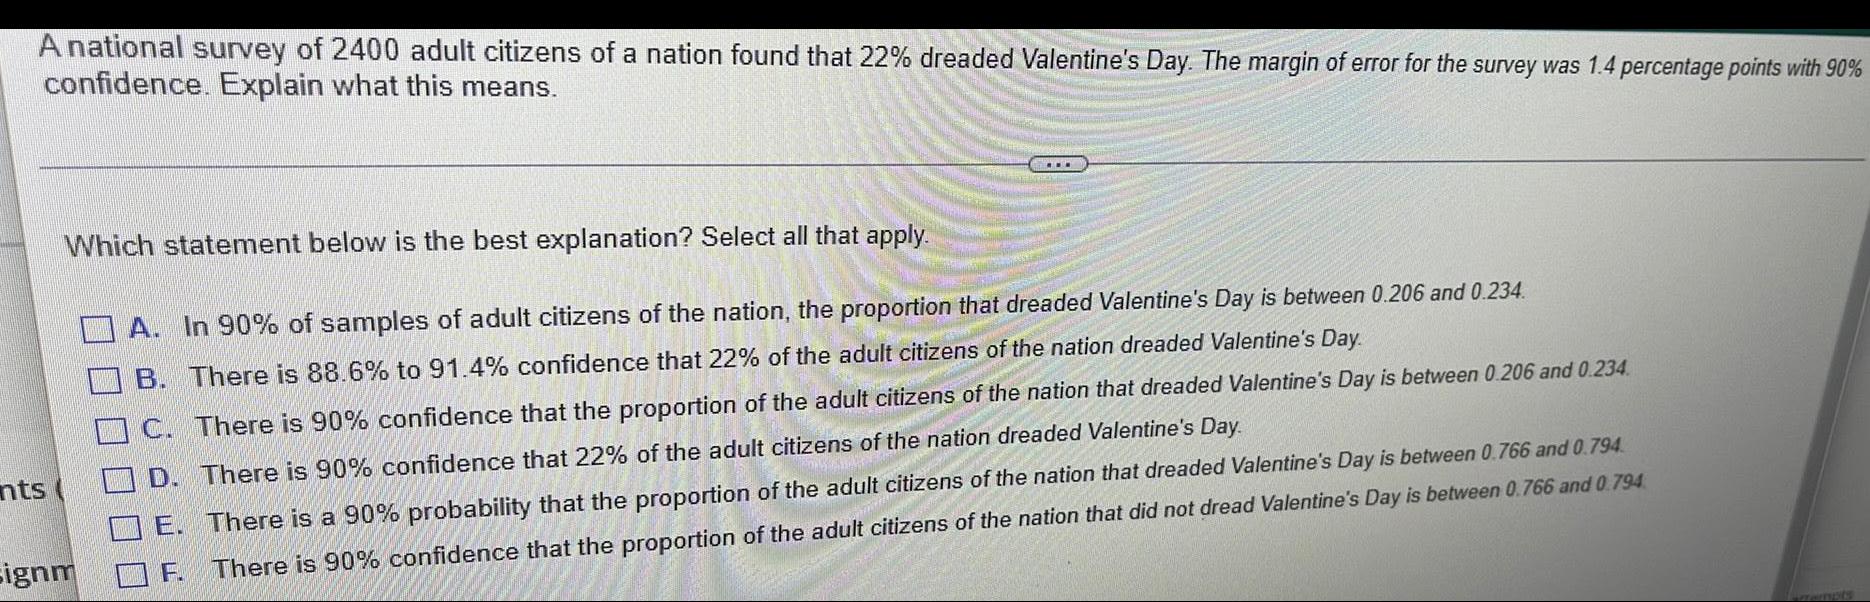
StatisticsA national survey of 2400 adult citizens of a nation found that 22% dreaded Valentine's Day. The margin of error for the survey was 1.4 percentage points with 90%
confidence. Explain what this means.
Which statement below is the best explanation? Select all that apply.
A. In 90% of samples of adult citizens of the nation, the proportion that dreaded Valentine's Day is between 0.206 and 0.234.
B. There is 88.6% to 91.4% confidence that 22% of the adult citizens of the nation dreaded Valentine's Day.
C. There is 90% confidence that the proportion of the adult citizens of the nation that dreaded Valentine's Day is between 0.206 and 0.234.
D. There is 90% confidence that 22% of the adult citizens of the nation dreaded Valentine's Day.
E. There is a 90% probability that the proportion of the adult citizens of the nation that dreaded Valentine's Day is between 0.766 and 0.794.
F. There is 90% confidence that the proportion of the adult citizens of the nation that did not dread Valentine's Day is between 0.766 and 0.794.
signm
Math
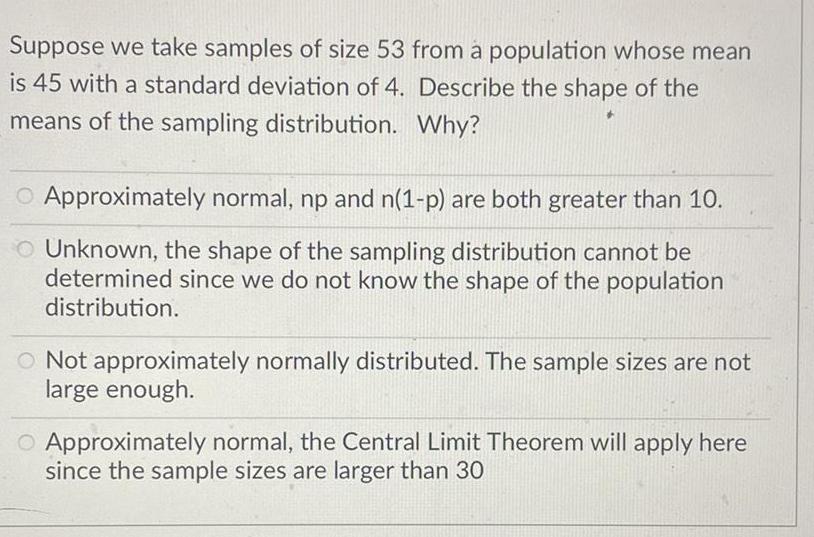
StatisticsSuppose we take samples of size 53 from a population whose mean
is 45 with a standard deviation of 4. Describe the shape of the
means of the sampling distribution. Why?
Approximately normal, np and n(1-p) are both greater than 10.
Unknown, the shape of the sampling distribution cannot be
determined since we do not know the shape of the population
distribution.
Not approximately normally distributed. The sample sizes are not
large enough.
Approximately normal, the Central Limit Theorem will apply here
since the sample sizes are larger than 30
Math
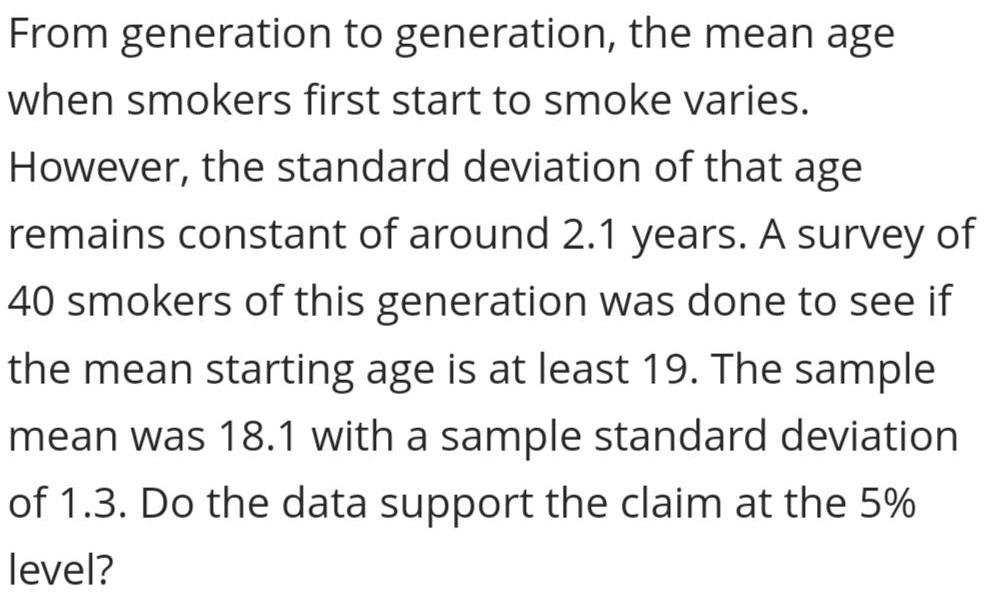
StatisticsFrom generation to generation, the mean age
when smokers first start to smoke varies.
However, the standard deviation of that age
remains constant of around 2.1 years. A survey of
40 smokers of this generation was done to see if
the mean starting age is at least 19. The sample
mean was 18.1 with a sample standard deviation
of 1.3. Do the data support the claim at the 5%
level?
Math
StatisticsSampling distributions of sample means that come from non-normal
populations are approximately normal if the sample size is large
enough.
True
False
Math
StatisticsAccording to a poll in 2016, about 10%, percent of Americans said
they were "very afraid" of spiders. Suppose that we took random
samples of 35 people from this population and computed the
proportion of people in each sample who were very afraid of spiders.
Which of the following distributions is the best approximation of the
sampling distribution of the proportion of people who were very
afraid of spiders?
approximately normal
not approximately normally distributed
skewed left
skewed right
Math
StatisticsIt is claimed that the average man can lift 120lbs when working out
in the gym. Suppose that we take random samples of 12 men and
calculate the mean weight they can lift.
What will be the shape of the sampling distribution
skewed left
skewed right
not enough information
normal
Math
StatisticsSuppose you survey 100 of the 2000 students in your school and find the mean age to be 14.5 years old. The 14.5 represents a
parameter
standard devation
proportion
statistic
Math
StatisticsThe Central Limit Theorem states that means will be normally distributed, even if the population isn't, if you take a sample size greater than or equal to
100
30
40
10
Math
StatisticsThe symbol p, (phat) stands for
Confidence Interval
Sample Proportion
Population Proportion
Z score
Math
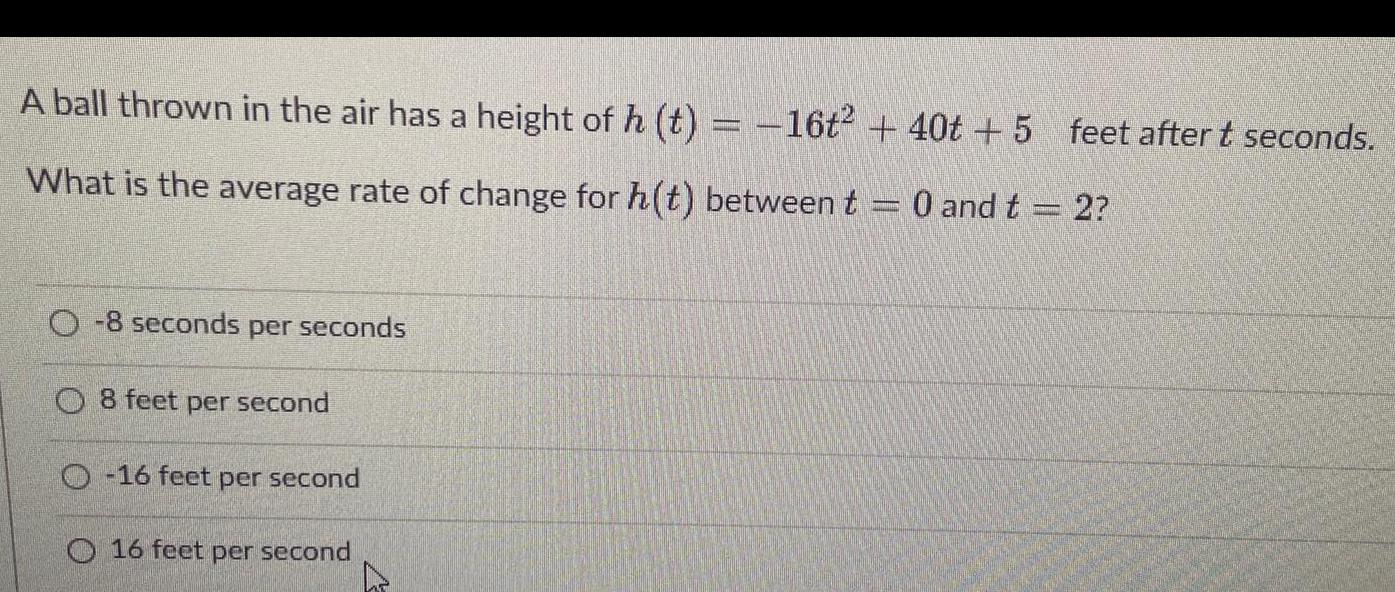
StatisticsA ball thrown in the air has a height of h (t) = -16t2 + 40t + 5 feet after t seconds.
What is the average rate of change for h(t) between t = 0 and t = 2?
-8 seconds per seconds
8 feet per second
-16 feet per second
16 feet per second
Math
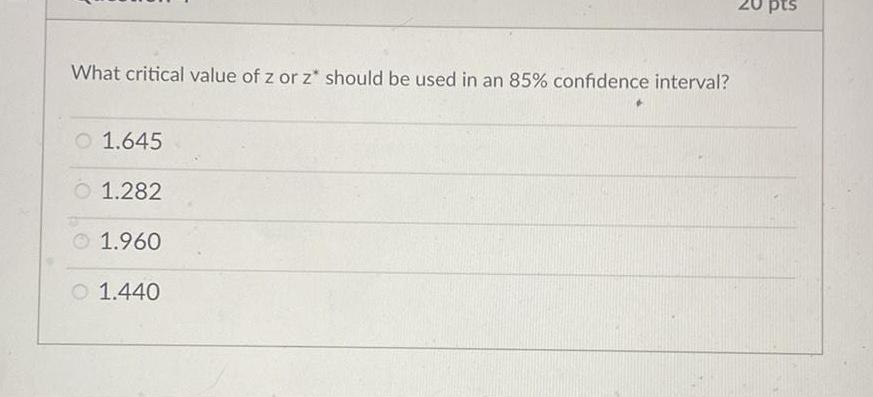
StatisticsWhat critical value of z or z* should be used in an 85% confidence interval?
1.645
1.282
1.960
1.440
Math
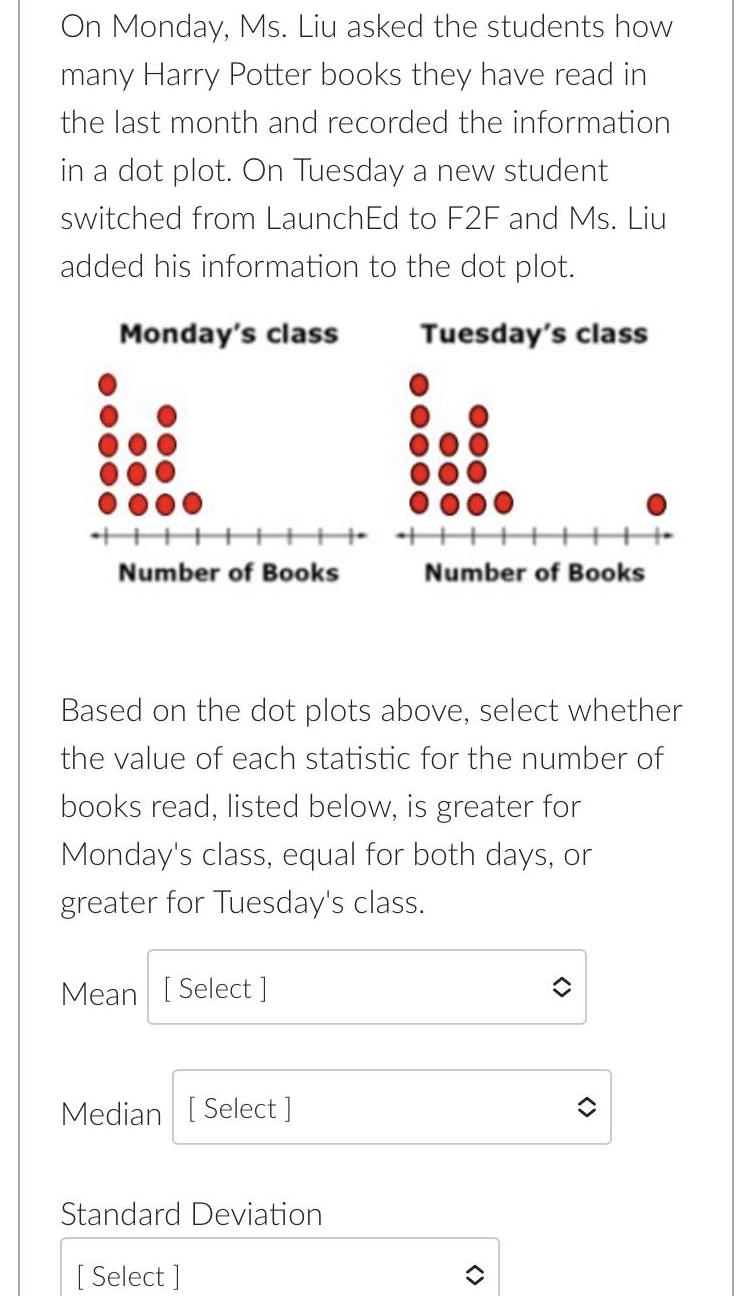
StatisticsOn Monday, Ms. Liu asked the students how many Harry Potter books they have read in the last month and recorded the information in a dot plot. On Tuesday a new student switched from Launch Ed to F2F and Ms. Liu added his information to the dot plot.
Based on the dot plots above, select whether the value of each statistic for the number of books read, listed below, is greater for Monday's class, equal for both days, or greater for Tuesday's class.
Median
Standard Deviation
Mean
Math
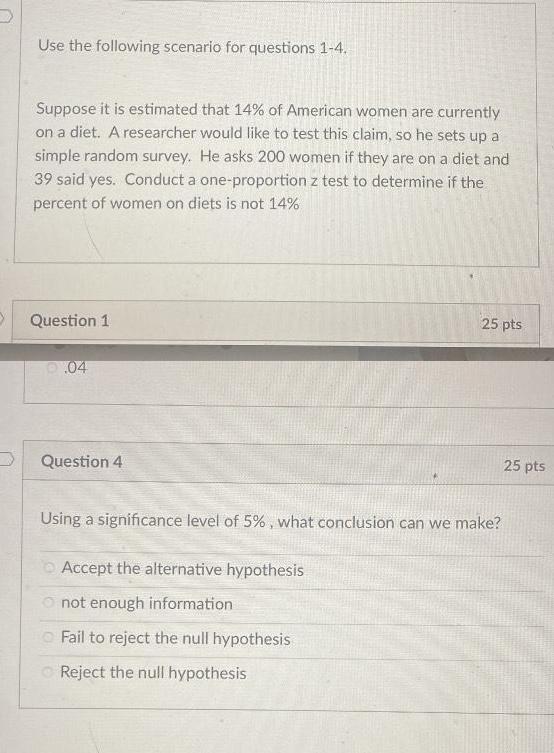
StatisticsUse the following scenario for questions 1-4. Suppose it is estimated that 14% of American women are currently on a diet. A researcher would like to test this claim, so he sets up a
simple random survey. He asks 200 women if they are on a diet and 39 said yes. Conduct a one-proportion z test to determine if the percent of women on diets is not 14%
Using a significance level of 5%, what conclusion can we make?
Accept the alternative hypothesis
not enough information
Fail to reject the null hypothesis
Reject the null hypothesis
Math
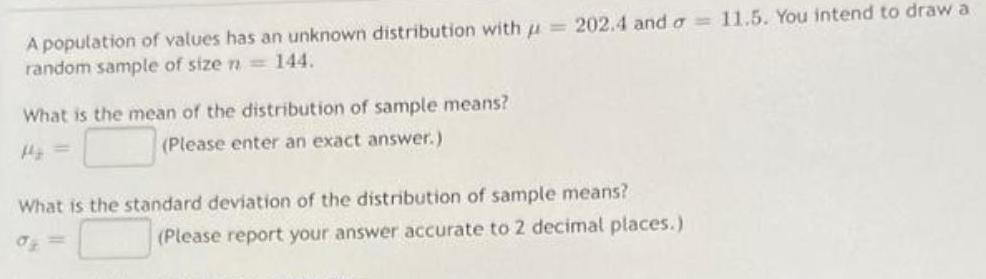
StatisticsA population of values has an unknown distribution with µ= 202.4 and σ = 11.5. You intend to draw a random sample of size n=144.
What is the mean of the distribution of sample means?
(Please enter an exact answer.)
What is the standard deviation of the distribution of sample means?
(Please report your answer accurate to 2 decimal places.)
Math
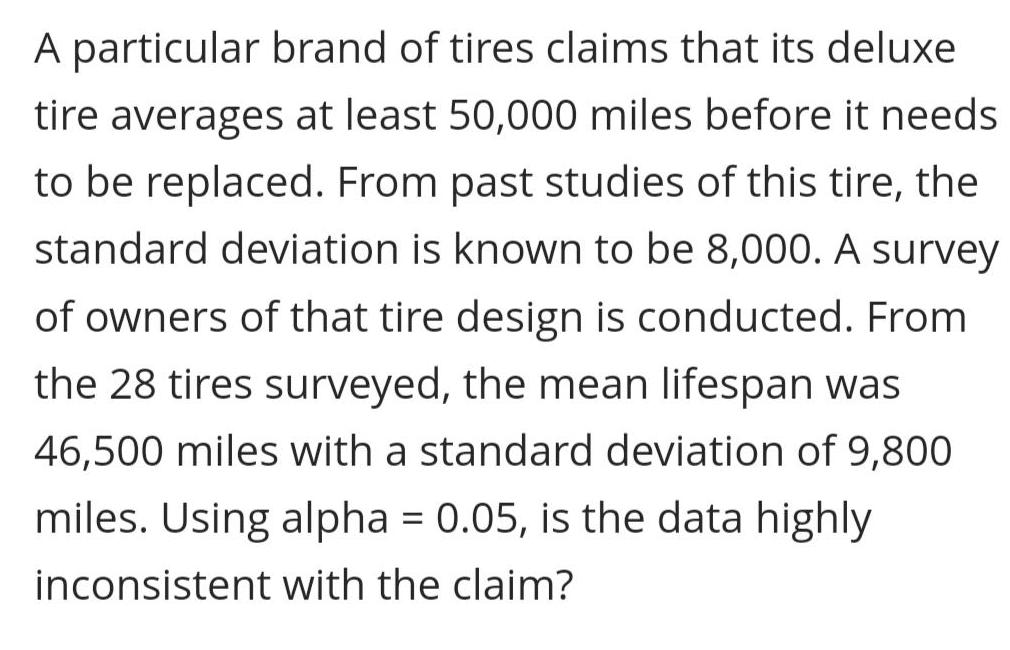
StatisticsA particular brand of tires claims that its deluxe tire averages at least 50,000 miles before it needs to be replaced. From past studies of this tire, the standard deviation is known to be 8,000. A survey of owners of that tire design is conducted. From the 28 tires surveyed, the mean lifespan was 46,500 miles with a standard deviation of 9,800 miles. Using alpha = 0.05, is the data highly inconsistent with the claim?
Math
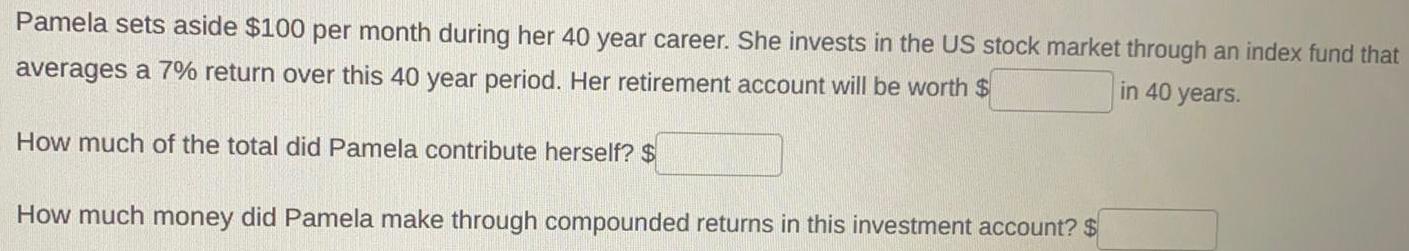
StatisticsPamela sets aside $100 per month during her 40 year career. She invests in the US stock market through an index fund that in 40 years. averages a 7% return over this 40 year period. Her retirement account will be worth $
How much of the total did Pamela contribute herself? $
How much money did Pamela make through compounded returns in this investment account? $
Math
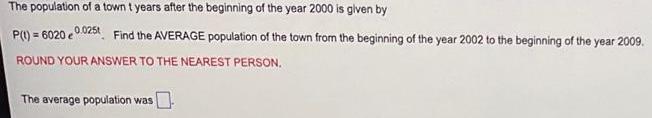
StatisticsThe population of a town t years after the beginning of the year 2000 is given by
P(t)= 6020 e 0.025t. Find the AVERAGE population of the town from the beginning of the year 2002 to the beginning of the year 2009.
ROUND YOUR ANSWER TO THE NEAREST PERSON.
The average population was
Math
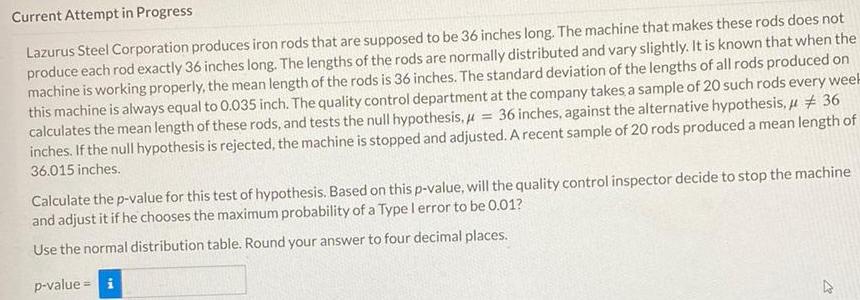
StatisticsCurrent Attempt in Progress Lazurus Steel Corporation produces iron rods that are supposed to be 36 inches long. The machine that makes these rods does not produce each rod exactly 36 inches long. The lengths of the rods are normally distributed and vary slightly. It is known that when the machine is working properly, the mean length of the rods is 36 inches. The standard deviation of the lengths of all rods produced on this machine is always equal to 0.035 inch. The quality control department at the company takes a sample of 20 such rods every week = 36 inches, against the alternative hypothesis," # 36 calculates the mean length of these rods, and tests the null hypothesis." inches. If the null hypothesis is rejected, the machine is stopped and adjusted. A recent sample of 20 rods produced a mean length of 36.015 inches. Calculate the p-value for this test of hypothesis. Based on this p-value, will the quality control inspector decide to stop the machine and adjust it if he chooses the maximum probability of a Type I error to be 0.01? Use the normal distribution table. Round your answer to four decimal places. p-value = i
Math
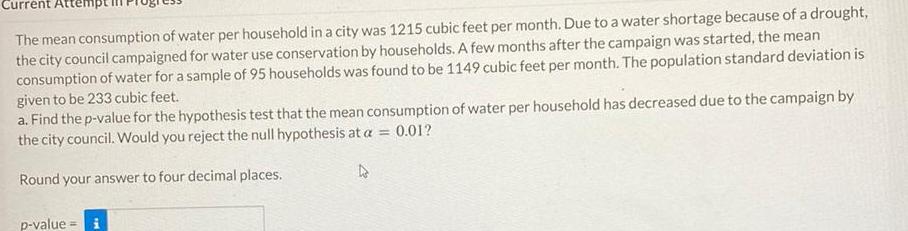
StatisticsThe mean consumption of water per household in a city was 1215 cubic feet per month. Due to a water shortage because of a drought, the city council campaigned for water use conservation by households. A few months after the campaign was started, the mean consumption of water for a sample of 95 households was found to be 1149 cubic feet per month. The population standard deviation is given to be 233 cubic feet.
a. Find the p-value for the hypothesis test that the mean consumption of water per household has decreased due to the campaign by the city council. Would you reject the null hypothesis at a = 0.01? Round your answer to four decimal places.
p-value =
Math
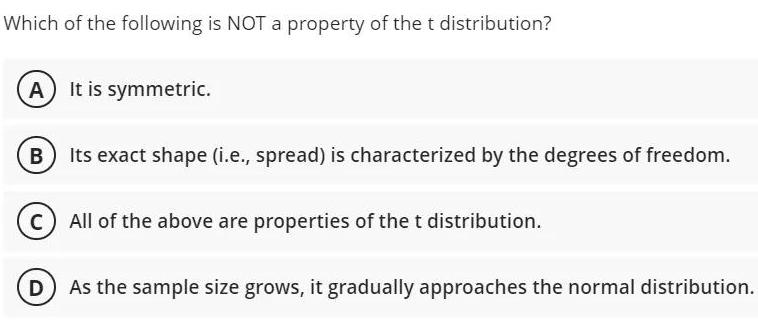
StatisticsWhich of the following is NOT a property of the t distribution?
A) It is symmetric.
B Its exact shape (i.e., spread) is characterized by the degrees of freedom.
C) All of the above are properties of the t distribution.
D As the sample size grows, it gradually approaches the normal distribution.
Math
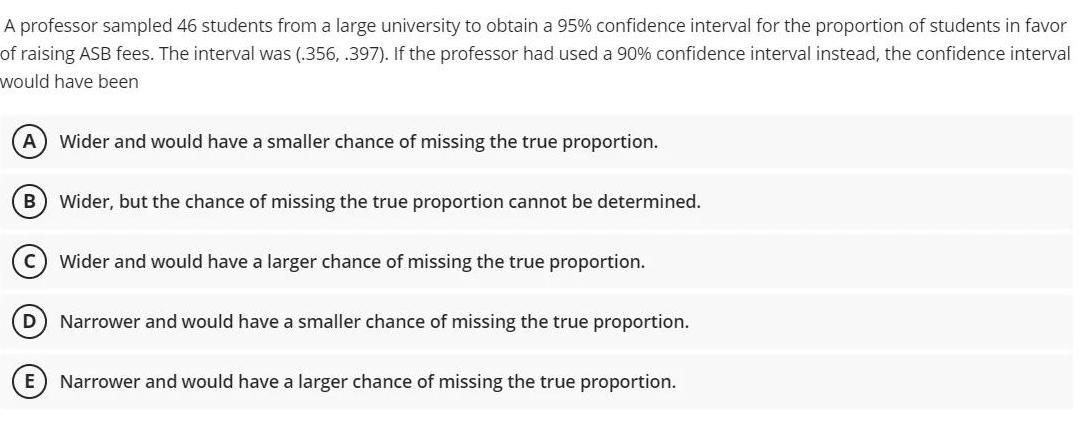
StatisticsA professor sampled 46 students from a large university to obtain a 95% confidence interval for the proportion of students in favor of raising ASB fees. The interval was (.356, .397). If the professor had used a 90% confidence interval instead, the confidence interval would have been
A Wider and would have a smaller chance of missing the true proportion.
B Wider, but the chance of missing the true proportion cannot be determined.
C Wider and would have a larger chance of missing the true proportion.
D Narrower and would have a smaller chance of missing the true proportion.
E Narrower and would have a larger chance of missing the true proportion.
Math
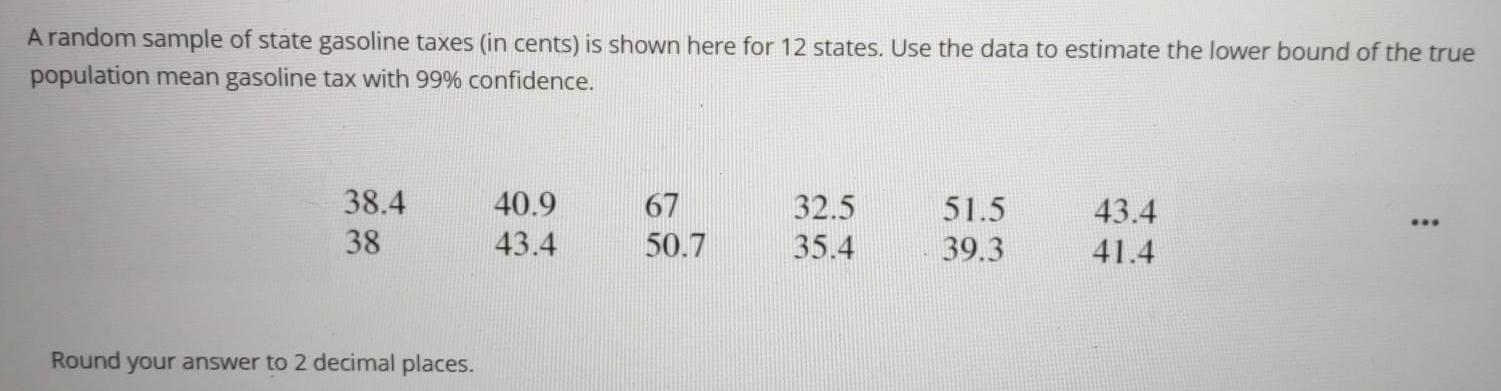
StatisticsA random sample of state gasoline taxes (in cents) is shown here for 12 states. Use the data to estimate the lower bound of the true population mean gasoline tax with 99% confidence.
38.4 40.9 67 32.5 51.5 43.4
...
38 43.4 50.7 35.4 39.3 41.4
Round your answer to 2 decimal places.
Math
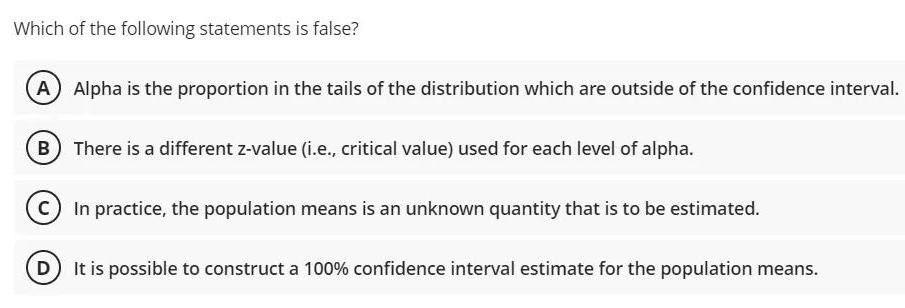
StatisticsWhich of the following statements is false?
A Alpha is the proportion in the tails of the distribution which are outside of the confidence interval.
B) There is a different z-value (i.e., critical value) used for each level of alpha.
c) In practice, the population means is an unknown quantity that is to be estimated.
D) It is possible to construct a 100% confidence interval estimate for the population means.
Math
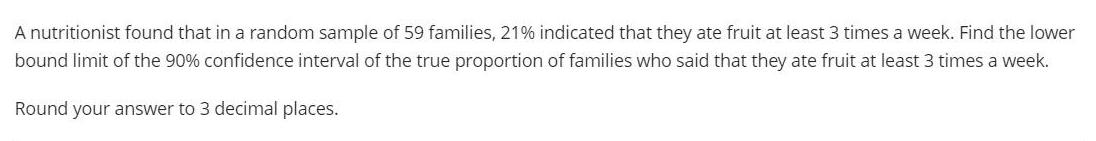
StatisticsA nutritionist found that in a random sample of 59 families, 21% indicated that they ate fruit at least 3 times a week. Find the lower bound limit of the 90% confidence interval of the true proportion of families who said that they ate fruit at least 3 times a week.
Math
StatisticsIn a survey of 1000 U.S. adults, 700 think police officers should be
required to wear body cameras while on duty. Construct 99% confidence
interval for the population proportion.
Math
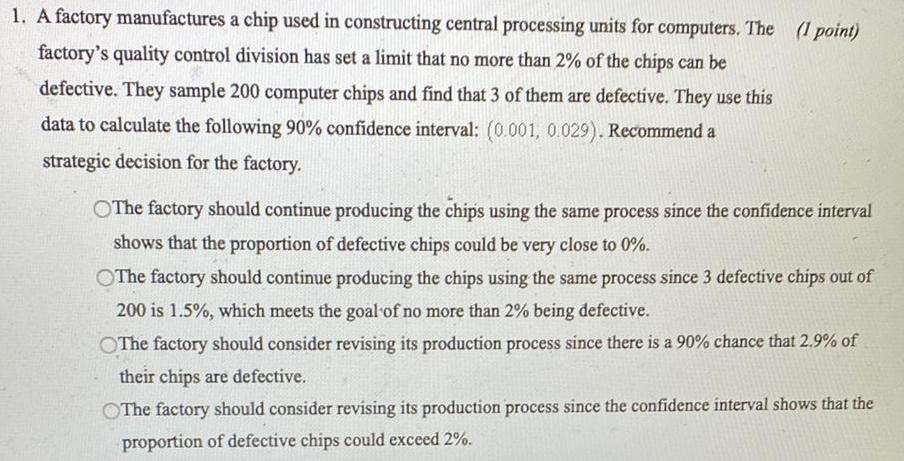
StatisticsA factory manufactures a chip used in constructing central processing units for computers. The factory's quality control division has set a limit that no more than 2% of the chips can be defective. They sample 200 computer chips and find that 3 of them are defective. They use this data to calculate the following 90% confidence interval: (0.001, 0.029). Recommend a
strategic decision for the factory.
A. The factory should continue producing the chips using the same process since the confidence interval
shows that the proportion of defective chips could be very close to 0%.
B. The factory should continue producing the chips using the same process since 3 defective chips out of
200 is 1.5%, which meets the goal of no more than 2% being defective.
C. The factory should consider revising its production process since there is a 90% chance that 2.9% of their chips are defective.
D. The factory should consider revising its production process since the confidence interval shows that the proportion of defective chips could exceed 2%.
Math
StatisticsRed Blood Cell Count A simple random sample of 40 adults males is obtained, and the red blood cell count (in cells per microliter) is measured for each of them, with these results: n=40, x= 4.932 million cells per microliter, s=0.504 million cells per microliter ( from Data Set 1 "Body Data" in Appendix B). Use a 0.01 significance level to test the claim that the sample is from a population with a mean less than 5.4 million cells per microliter, which is often used as the upper limit of the range of normal values. Does the result suggest that each of the 40 males has red blood cell count below 5.4 million cells pern microliter.
Math
StatisticsA recent study of 25 randomly selected employees of a company showed that the mean of the distance they traveled to work was 14.71 miles. The standard deviation of the sample mean was 2.62 miles. Find the upper bound 95% confidence interval of the true mean.
Math
StatisticsFrederick is creating a plan to conduct a randomized survey. He will be asking guests at a baseball stadium to rate their experience. At which location should he take the survey to ensure randomization?
the section of seats directly behind home plate
the hot dog stand
the stadiums front gate
the gift shop
Math
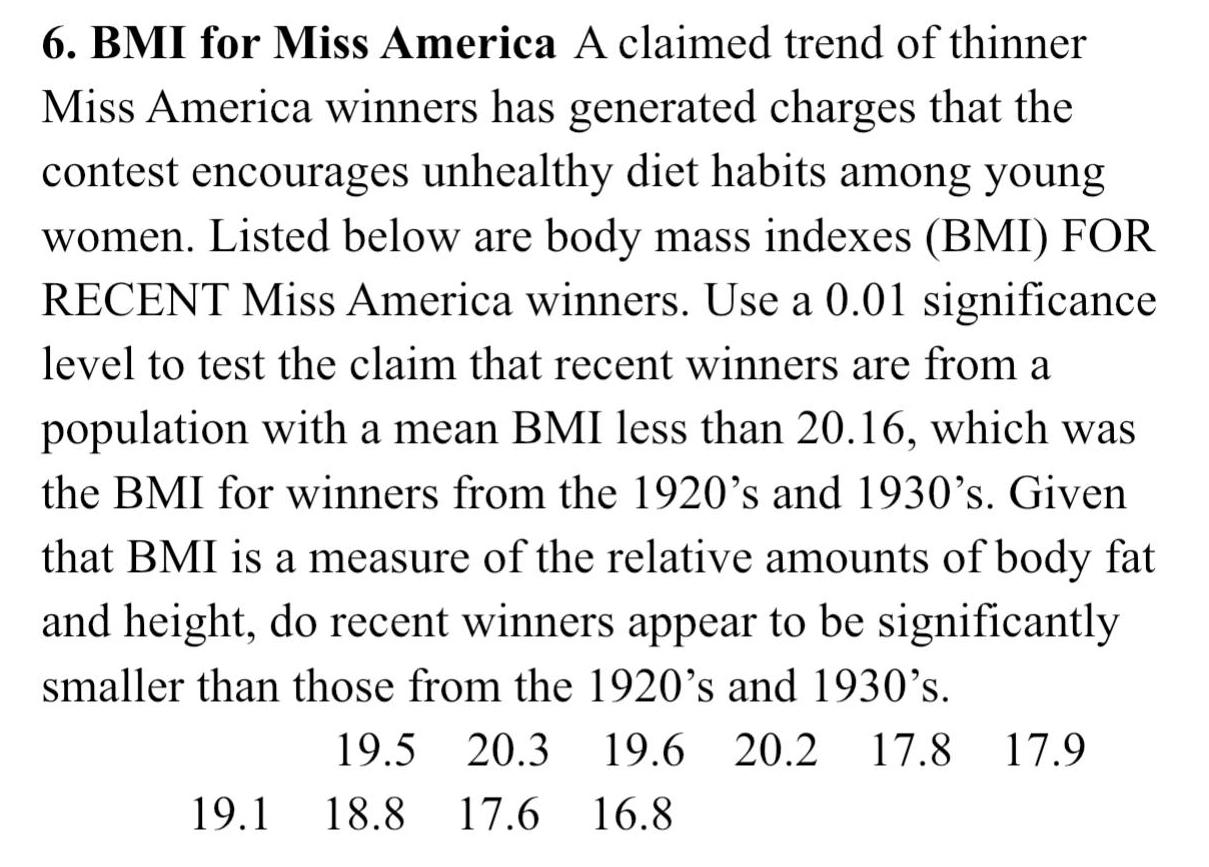
Statistics6. BMI for Miss America A claimed trend of thinner
Miss America winners has generated charges that the
contest encourages unhealthy diet habits among young
women. Listed below are body mass indexes (BMI) FOR
RECENT Miss America winners. Use a 0.01 significance
level to test the claim that recent winners are from a
population with a mean BMI less than 20.16, which was
the BMI for winners from the 1920's and 1930's. Given
that BMI is a measure of the relative amounts of body fat
and height, do recent winners appear to be significantly
smaller than those from the 1920's and 1930's.
19.5 20.3 19.6 20.2 17.8 17.9 18.8 17.6 16.8 19.1

Math
StatisticsA group of 625 students has a mean age of 15.8 years with a standard deviation of 0.6 years. The ages are normally distributed. What is the probability that a randomly selected student is older than 16.5 years old?
Math
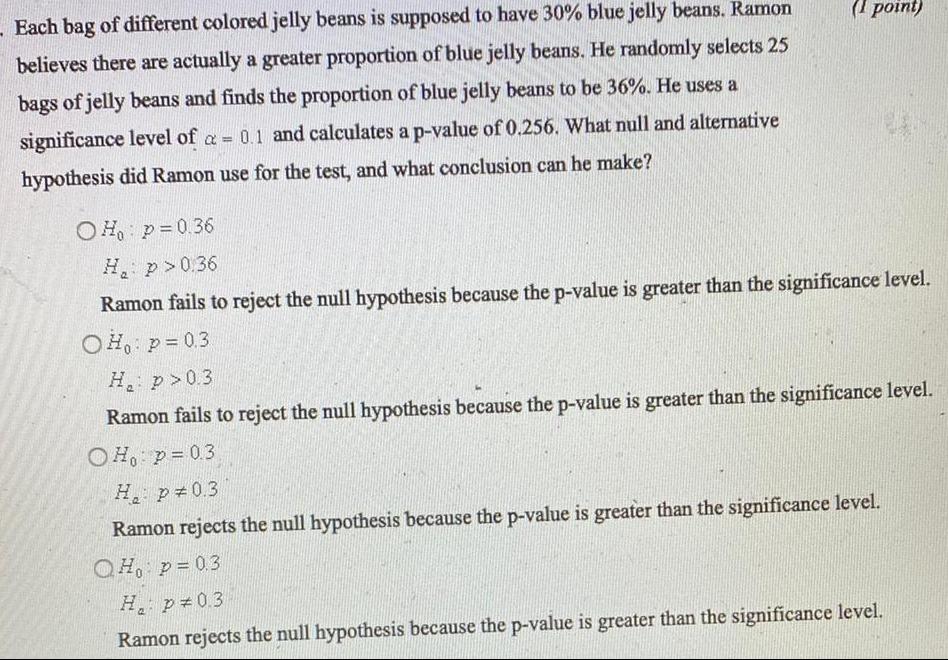
StatisticsEach bag of different colored jelly beans is supposed to have 30% blue jelly beans. Ramon believes there are actually a greater proportion of blue jelly beans. He randomly selects 25 bags of jelly beans and finds the proportion of blue jelly beans to be 36%. He uses a significance level of a = 0.1 and calculates a p-value of 0.256. What null and alternative hypothesis did Ramon use for the test, and what conclusion can he make?
(1 point)
H0: p=0.36
He p > 0.36
Ramon fails to reject the null hypothesis because the p-value is greater than the significance level.
H0: p=0.3
He p > 0.3
Ramon fails to reject the null hypothesis because the p-value is greater than the significance level.
H0: p=0.3
He P=0.3
Ramon rejects the null hypothesis because the p-value is greater than the significance level.
H0 p = 0.3
He: p=0.3
Ramon rejects the null hypothesis because the p-value is greater than the significance level.
Math
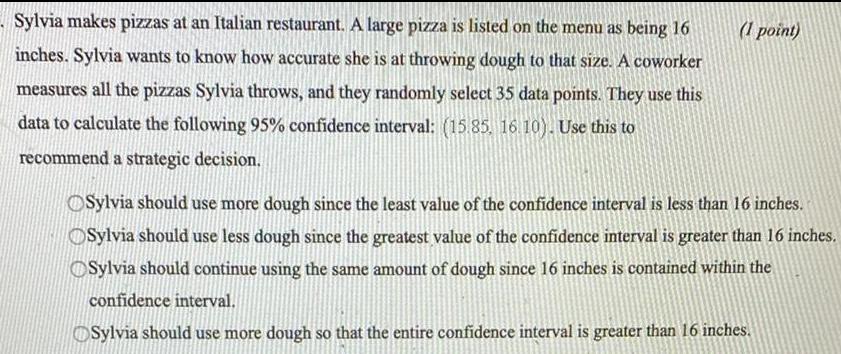
StatisticsSylvia makes pizzas at an Italian restaurant. A large pizza is listed on the menu as being 16 inches. Sylvia wants to know how accurate she is at throwing dough to that size. A coworker measures all the pizzas Sylvia throws, and they randomly select 35 data points. They use this data to calculate the following 95% confidence interval: (15.85, 16.10). Use this to recommend a strategic decision.
Sylvia should use more dough since the least value of the confidence interval is less than 16 inches.
Sylvia should use less dough since the greatest value of the confidence interval is greater than 16 inches.
Sylvia should continue using the same amount of dough since 16 inches is contained within the
confidence interval.
Sylvia should use more dough so that the entire confidence interval is greater than 16 inches.

Math
StatisticsConsider a population with u-58.5 and o-5.7 is taken. Find the standard deviation of the sampling distribution of the sample
means with a sample size of 76.