Statistics Questions and Answers
Math
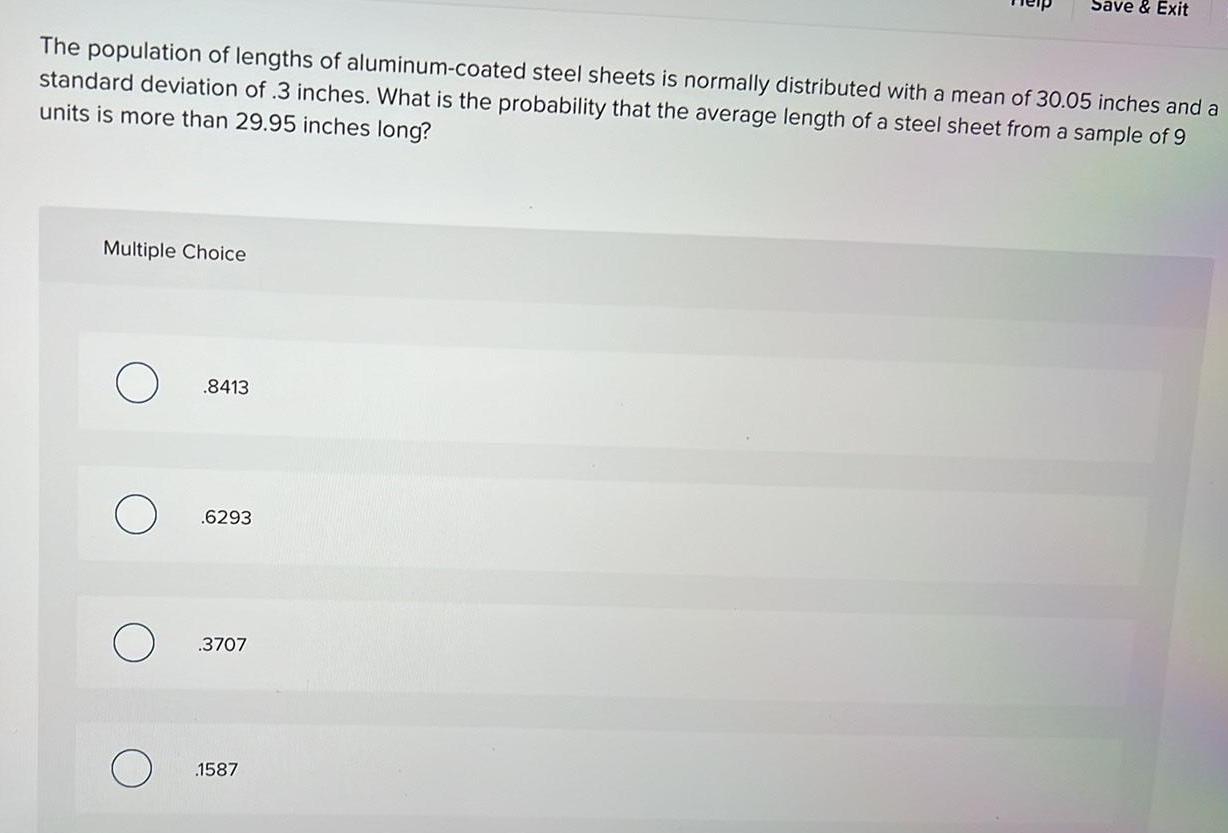
StatisticsThe population of lengths of aluminum-coated steel sheets is normally distributed with a mean of 30.05 inches and a standard deviation of .3 inches. What is the probability that the average length of a steel sheet from a sample of 9 units is more than 29.95 inches long?
Multiple Choice
.8413
.6293
.3707
.1587

Math
StatisticsThe 1999 article about the CA lottery in the paper San Luis Obispo Tribune gave the following information on the age distribution of adults: 35% are between the ages of 18 and 34; 51% are between the ages of 35 and 64; and 14% are 65 and older. The article also gave information on the age distribution of those who purchase lottery tickets: People ages 18-34 purchase 36 tickets; people 35-64 purchase 130 tickets; and people 65 and older purchase 34 tickets. Suppose the data resulted from a random sample of 200 lottery ticket purchasers. Based on this sample, is it reasonable to conclude that the proportions stated in the article are accurate at 5% level of significance? Please be sure to give the value of the test statistic, P- value, and null rejection region.

Math
StatisticsGRADING ON A NORMAL CURVE-MR. SANDERSON MARKS HIS CLASS ON A
NORMAL CURVE. THOSE WITH Z-SCORES ABOVE 1.8 WILL RECEIVE AN A, THOSE
BETWEEN 1.8 AND 1.1 WILL RECEIVE A B, THOSE BETWEEN 1.1 AND -1.2 WILL
RECEIVE A C, THOSE BETWEEN -1.2 AND -1.9 WILL RECEIVE A D, AND THOSE
UNDER -1.9 WILL RECEIVE AN F. FIND THE PERCENT OF GRADES THAT WILL BE A,
B, C, D, AND F.

Math
StatisticsThe data in the accompanying bar graph are from a random sample of 806 adults. The graph shows four proposals to reduce gun violence in a country and the percentage of
surveyed adults who favored each of these proposals. Complete parts (a) and (b) below.
a. Find the margin of error for this survey.
The margin of error is ±%.
(Do not round until the final answer. Then round to the nearest tenth as needed.)
b. Write a statement about the percentage of adults in the country's population who favor to restrict ammunition purchases to reduce gun violence.
There is 95% confidence that between% and% of all adults in the country favor to restrict.
(Use ascending order. Round the nearest tenth as needed.)

Math
StatisticsAccording to the National Institute on Drug Abuse, a U.S. government agency, 17.3% of 8th graders in 2010 had used marijuana at some point in their lives. A school official hopes to show the percentage is lower in his district, testing H0: p = 0.173 versus Ha: p < 0.173.
The health department for the district uses anonymous random sampling and finds that 10% of 80 eighth graders surveyed had used marijuana.
Is the sample size condition for conducting a hypothesis test for a population proportion satisfied?
A. Yes, because (80)(.173) and (80) (1 - 0.173) are both at least 10. This means we can use the normal
distribution to model the distribution of sample proportions.
B. No, because (80)(.10) is less than 10. Because of this the sample size is too small to use the normal
distribution to model the distribution of sample proportions.
C. Yes, because the sample is random. It represents the 8th graders in the district.
D. No, because 80 students is not enough to be representative of the students in the school district.

Math
StatisticsIf the mean, median, and mode for a given population are all equal and the relative frequency curve has matching tails to the right and left, then we would describe the shape of the distribution of the population as
Multiple Choice
bimodal
skewed to the right
symmetrical
skewed to the left

Math
StatisticsConfidence interval precision: We know that narrower confidence intervals give us a more precise estimate of the true population proportion. Which of the following could we do to produce higher precision in our estimates of the population proportion?
We can select a higher confidence level and increase the sample size.
We can select a lower confidence level and increase the sample size.
We can select a lower confidence level and decrease the sample size.
We can select a higher confidence level and decrease the sample size.
![In a poll, 900 adults in a region were asked about their online vs. in-store clothes shopping. One finding was that 24% of respondents never clothes-shop online. Find and interpret a 95% confidence interval for the proportion of all adults in the region who never clothes-shop online. [Round to three decimal places]](https://media.kunduz.com/media/sug-question/raw/61931407-1659085550.3030946.jpeg?w=256)
Math
StatisticsIn a poll, 900 adults in a region were asked about their online vs. in-store clothes shopping. One finding was that 24% of respondents never clothes-shop online. Find and interpret a 95% confidence interval for the proportion of all adults in the region who never clothes-shop online. [Round to three decimal places]

Math
StatisticsA bank manager wants to know the average amount of time customers of the bank have to wait in line. The average waiting time for a sample of 35 customers was 3.5 minutes. What is the population?
a) all customers of the bank
b) the 35 customers studied
c) 3.5 minutes
d) the average waiting time for all customers

Math
StatisticsLoretta, who turns eighty this year, has just learned about blood pressure problems in the elderly and is interested in how her blood pressure compares to those of her peers. Specifically, she is interested in her systolic blood pressure, which can be problematic among the elderly. She has uncovered an article in a scientific journal that reports that the mean systolic blood pressure measurement for women over seventy-five is 133.3 mmHg, with a standard deviation of 5.1 mmHg.
Assume that the article reported correct information. Complete the following statements about the distribution of systolic blood pressure measurements for women over seventy-five.
(a) According to Chebyshev's theorem, at least of the measurements lie between 123.1 mmHg and 143.5 mmHg. of the
(b) According to Chebyshev's theorem, at least 56% of the measurements lie between mmHg and mmHg. (Round your answer to 1 decimal place.) ?

Math
StatisticsThe number of potholes in any given 1 mile stretch of freeway pavement in Pennsylvania has a bell- shaped distribution. This distribution has a mean of 50 and a standard deviation of 10. Using the empirical rule, what is the approximate percentage of 1-mile long roadways with potholes numbering between 30 and 80?
Do not enter the percent symbol.
ans %

Math
StatisticsAn investor bought stock for $20,000. Fourteen years later, the stock was sold for $40,000. If interest is compounded continuously, what annual nominal rate of interest did the original $20,000 investment earn?
The annual nominal rate of interest earned is%.
(Round to two decimal places as needed.)

Math
StatisticsShort-term classes: Does taking a class in a short-term format (8 weeks instead of 16 weeks) increase a student's likelihood of passing the course? For a particular course, the pass rate for the 16-week format is 59%. A team of faculty examine student data from 40 randomly selected accelerated classes and determine that the pass rate is 78%.
Which of the following are the appropriate null and alternative hypotheses for this research question?
A. O Ho: P = 0.59; Ha: p = 0.59
B. O Ho: P = 0.59; Ha: p > 0.59
C. O Ho: p = 0.78; Ha: p = 0.78
D. O Ho: p = 0.78; Ha: p > 0.59

Math
StatisticsLet x represent the number of hours Trenton spends studying algebra, and let y represent the number of hours he spends studying history. For parts (a)
- (e), write an inequality to represent the given statement.
(a) Trenton has a total of at most 6 hr to study for both algebra and history combined.
An inequality that represents this statement is

Math
StatisticsEach year, Giselle plants and grows tomatoes in her backyard garden. Her plants typically produce a total of around 300 tomatoes during the season. However, each week approximately 4 tomatoes are not usable due to destruction by local wildlife.
Write an equation to represent the average number of usable tomatoes, t, produced per week over the course of wweeks in
the growing season.
A. t = 300/w-4w
B. t = 300/4w
C. t= 300-4w/w
D. t= 300+4w/w

Math
StatisticsOnline photos: A poll surveyed 1802 internet users and found that 843, of them had posted a photo or video online. Can you conclude that less than half of internet users have posted photos or videos online? Use the a 0.05 level of significance and the critical value method.
State the null and alternate hypotheses.
Ho:
H₁:
The hypothesis test is

Math
StatisticsThe mean weight of male nurses working at a local hospital is less than 172 lbs. Express the null and alternative hypotheses in symbolic form for this claim.
Ho: µ
H₁: µ
Use the following codes to enter the following symbols:
> enter >=
<enter <=
enter !=

Math
StatisticsHurricane damage: In August and September 2005, Hurricanes Katrina and Rita caused extraordinary flooding in New Orleans, Louisiana. Many homes were severely damaged or destroyed, and of those that survived, many required extensive cleaning. It was thought that cleaning of flood-damaged homes might present a health hazard due to the large amounts of mold present in many of the homes. In a sample of 362 residents of Orleans Parish who had participated in cleaning of one or more homes, 74 had experienced symptoms of wheezing, and in a sample of 182 residents who had not participated in cleaning, 21 reported wheezing symptoms (numbers read from a graph). Can you conclude that the proportion of residents with wheezing symptoms is greater among those who participated in the cleaning of flood-damaged homes? Let P1 denote the proportion of residents with wheezing symptoms who had cleaned flood-damaged. homes, and let P2 be the population proportion with wheezing symptoms who did not participate in the cleaning of flood-damaged homes. Use the a= 0.05 level of significance and the critical value method.
State the null and alternate hypotheses.
Ho:
H₁:
This hypothesis test is a

Math
StatisticsThere are over 3 million students enrolled in community colleges in the U.S. A total of 443,818 students at 699 community colleges completed the Community College Survey of Student Engagement (CCSSE) between 2009 and 2011. About half (50%) of students reported that they "often" or "very often" prepare two or more drafts of a
paper before turning it in.
True or false? The 50% is a statistic representing a sample of 443,818 community college students.
False
True

Math
StatisticsUse the confidence level and sample data to find the margin of error E. Round your answer to the same number of decimal places as the sample mean unless otherwise noted.
Replacement times for washing machines: 90% confidence; n=31, x= 10.4 years, σ = 2.4 years 0.1 yr
0.7 yr
3.1 yr
0.6 yr

Math
Statistics1. The table shows the number of turtles hatched at a zoo each year since 2003.
a. Find the line of best fit.
Predict the number of turtles to be hatched in 2011.

Math
StatisticsDetermine the point estimate of the population mean x̄ and margin of error (E) for each confident interval.
Lower Bound: 15
Upper Bound: 35
(x)=25, E=15
(x)=10, E=25
(x)=25, E=10
(x)=15, E=10

Math
StatisticsThe tread life of a particular brand of tire is a random variable best described by a normal distribution with a mean of 60,000 miles and a standard deviation of 1200 miles. What is the probability a certain tire of this brand will last between 57,480 miles and 57,840 miles?
0.4649
0.0180
0.4920
0.9813

Math
StatisticsCuring diabetes: Vertical banded gastroplasty is a surgical procedure that reduces the volume of the stomach in order to produce weight loss. In a recent study, 82 patients with Type 2 diabetes underwent this procedure, and 59 of them experienced a recovery from diabetes. Does this study provide convincing evidence that less than 77% of those with diabetes who undergo this surgery will recover from diabetes? Use the α= 0.10 level of significance and the critical value method.
State the appropriate null and alternate hypotheses.
Ho:
H₁:
This hypothesis test is a (Choose one) test.

Math
StatisticsA psychologist would like to estimate the proportion of Americans that say "the future of the nation is a significant source of stress for me." To help form an estimate, the psychologist randomly selected 922 Americans and found that 59.6% of the sample agreed with the statement "the future of the nation is a significant source of stress for me." Using a 96% confidence level, determine the margin of error, E, and a confidence interval for the true proportion of all Americans that say the "the future of the nation is a significant source of stress for me." Report the confidence interval using interval notation. Round solutions to four decimal places, if necessary. The margin of error is given by E = A 96% confidence interval is given by

Math
StatisticsThe correlation coefficient of a set of data is 0.91. Select all of the statements that are true. The positive correlation coefficient tells us that there is an outlier. The two variables involved have a very strong positive correlation. The correlation coefficient implies that as the independent variable increases, the dependent variable increases. Because the correlation coefficient is positive, there is no causation. The correlation coefficient implies causation.

Math
Statisticsb) At age 35, Alberto stops making monthly payments into his annuity, but he takes the money he accumulated in his annuity and invests it into a savings account with an interest rate of 8% compounded monthly. Using the compounded interest formula A = p(1 + )" determine the amount Alberto has in n.t his savings account 30 years later when he retires at age 65,

Math
StatisticsWhich of the following is the first step of the four essential steps in designing an observational study or experiment in statistics? Formulate a question that can be answered with data that is collected. Interpret the results to draw a conclusion. Ensure that all treatments are randomly assigned to the subjects. Make a design on how the data will be collected.

Math
StatisticsIn the following hypothetical scenarios, classify each of the specified numbers as a parameter or a statistic.
There are nine justices currently serving in the United States Supreme Court, and 44% of them were appointed after the year 2000. The 44% here is a
In a 2015 Gallup poll of 1025 adults living in the United States, 53% said they trust the judicial branch of the federal government. The 53% here is a
A survey of hospital records in 120 hospitals throughout the world shows the mean height of 180 cm for adult males. The mean height of 180 cm is a
The 59 players on the roster of a championship football team have a mean weight of 248.6 pounds with a standard deviation of 44.6 pounds. The 44.6 pounds is a

Math
StatisticsBusiness Weekly conducted a survey of recent graduates from the top MBA programs. On the basis of the survey, assume that 55% of the recent graduates annual salary exceeds $55000. Suppose you take a simple random sample of 85 recent graduates. Note: round all z scores to 2 decimal places and all other numbers to 4 decimal places.
Find the probability that more than 45% of the 85 recent graduates have an annual salary exceeding
$55000. 0.0268
Beyond representative sampling, what assumptions are needed to satisfy the requirements for this problem?
X binomial and both np and nq at least 5
X~ normal or n ≥ 30
X~ normal and n ≥ 30
X~ binomial and at least 5 successes and failures

Math
StatisticsA sample of size 7-50 is drawn from a normal population whose standard deviation is a-7.1. The sample mean is x=48.52.
(a) Construct a 99.9% confidence interval for H. Round the answer to at least two decimal places.
A 99.9% confidence interval for the mean is 0<μ<
(b) If the population were not approximately normal, would the confidence interval constructed in part (a) be valid? Explain.
The confidence Interval constructed in part (a) (Choose one) be valid since the sample size (Choose one) ▼ large.
Math
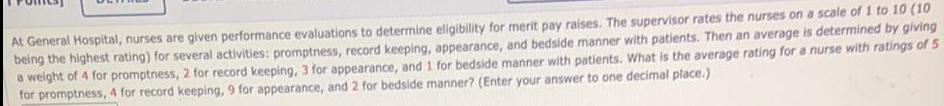
StatisticsAt General Hospital, nurses are given performance evaluations to determine eligibility for merit pay raises. The supervisor rates the nurses on a scale of 1 to 10 (10
being the highest rating) for several activities: promptness, record keeping, appearance, and bedside manner with patients. Then an average is determined by giving
a weight of 4 for promptness, 2 for record keeping, 3 for appearance, and 1 for bedside manner with patients. What is the average rating for a nurse with ratings of 5
for promptness, 4 for record keeping, 9 for appearance, and 2 for bedside manner? (Enter your answer to one decimal place.)

Math
StatisticsExpress the confidence interval (0.065,0.109) in the form of p-E <p<p+E.
<p< (Type integers or decimals.)

Math
StatisticsCompany XYZ know that replacement times for the quartz time pieces it produces are normally distributed with a mean of 16.4 years and a standard deviation of 2.1 years.
Find the probability that a randomly selected quartz time piece will have a replacement time less than 12.4 years?
P(X< 12.4 years) =
Enter your answer accurate to 4 decimal places. Answers obtained using exact z-scores or z-scores rounded to 3 decimal places are accepted.
If the company wants to provide a warranty so that only 2.9% of the quartz time pieces will be replaced before the
warranty expires, what is the time length of the warranty?
warranty _____ years
Enter your answer as a number accurate to 1 decimal place. Answers obtained using exact z-scores or z-scores rounded to 3 decimal places are accepted.
Math
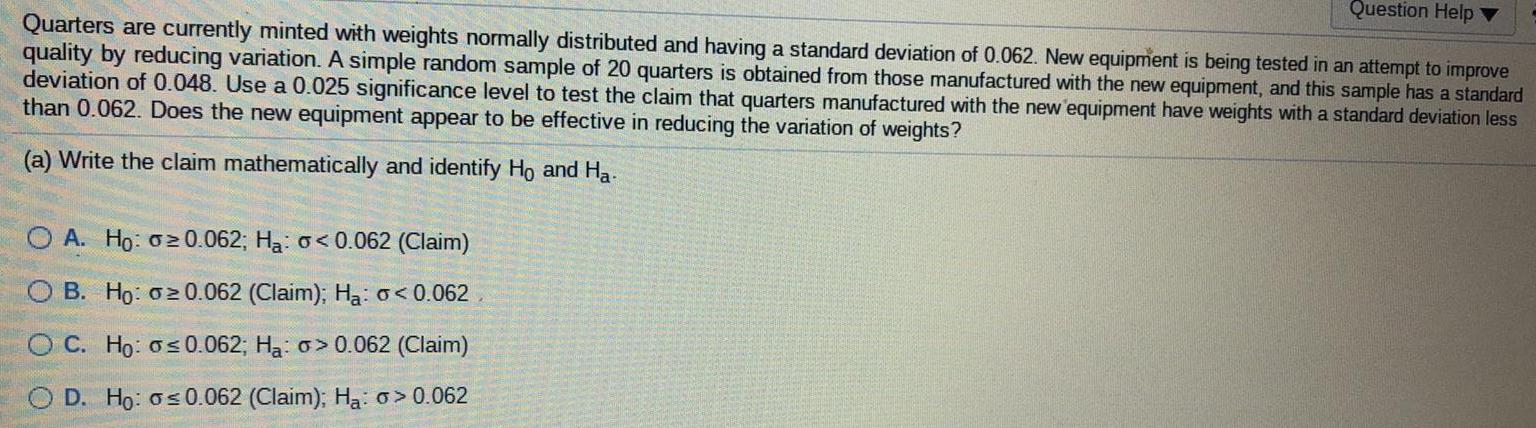
StatisticsQuarters are currently minted with weights normally distributed and having a standard deviation of 0.062. New equipment is being tested in an attempt to improve
quality by reducing variation. A simple random sample of 20 quarters is obtained from those manufactured with the new equipment, and this sample has a standard
deviation of 0.048. Use a 0.025 significance level to test the claim that quarters manufactured with the new equipment have weights with a standard deviation less
than 0.062. Does the new equipment appear to be effective in reducing the variation of weights?
(a) Write the claim mathematically and identify Ho and Ha-
A. Ho: 20.062; Ha: o<0.062 (Claim)
B. Ho: 20.062 (Claim); Ha: 0 <0.062
C.Ho: o≤ 0.062; Ha: o> 0.062 (Claim)
D. Ho: o≤ 0.062 (Claim); Ha: o> 0.062
Math
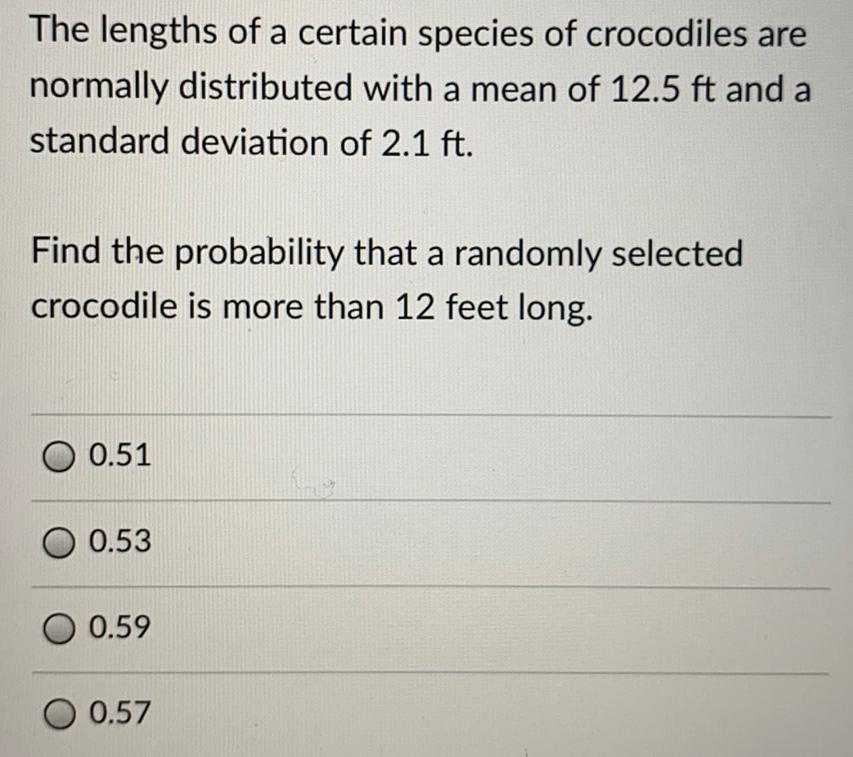
StatisticsThe lengths of a certain species of crocodiles are
normally distributed with a mean of 12.5 ft and a
standard deviation of 2.1 ft.
Find the probability that a randomly selected
crocodile is more than 12 feet long.
0.51
0.53
0.59
0.57
Math
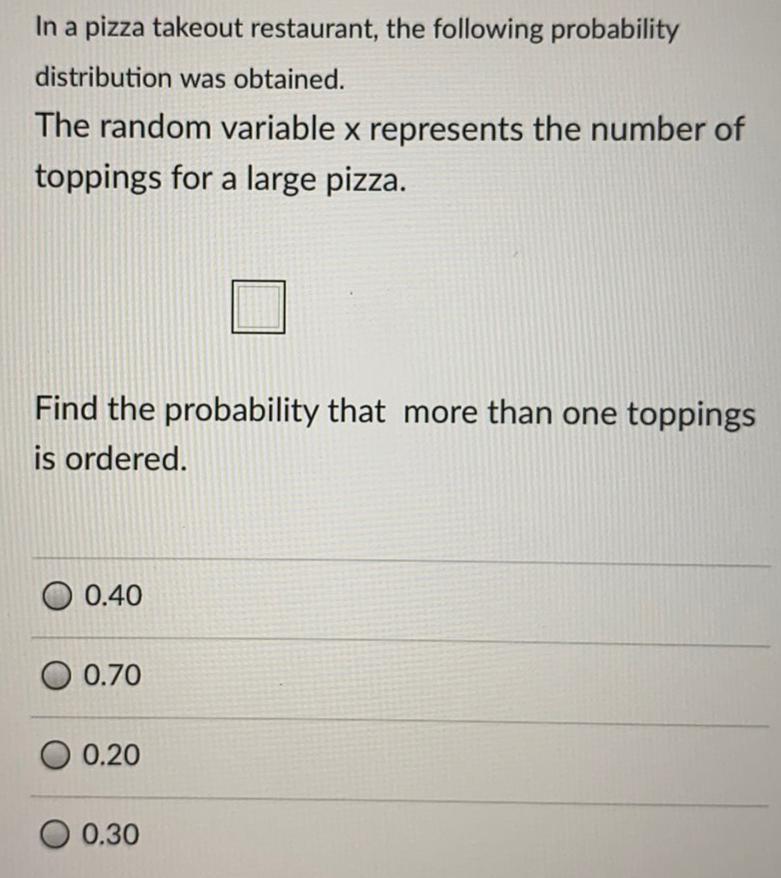
StatisticsIn a pizza takeout restaurant, the following probability
distribution was obtained.
The random variable x represents the number of
toppings for a large pizza.
Find the probability that more than one toppings
is ordered.
0.40
0.70
0.20
0.30
Math
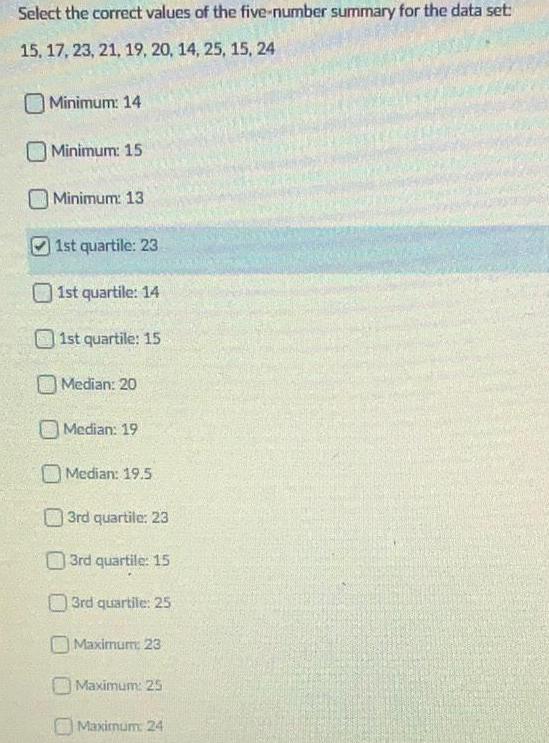
StatisticsSelect the correct values of the five-number summary for the data set:
15, 17, 23, 21, 19, 20, 14, 25, 15, 24
Minimum: 14
Minimum: 15
Minimum: 13
1st quartile: 23
1st quartile: 14
1st quartile: 15
Median: 20
Median: 19
Median: 19.5
3rd quartile: 23
3rd quartile: 15
3rd quartile: 25
Maximum: 23
Maximum: 25
Maximum: 24
Math
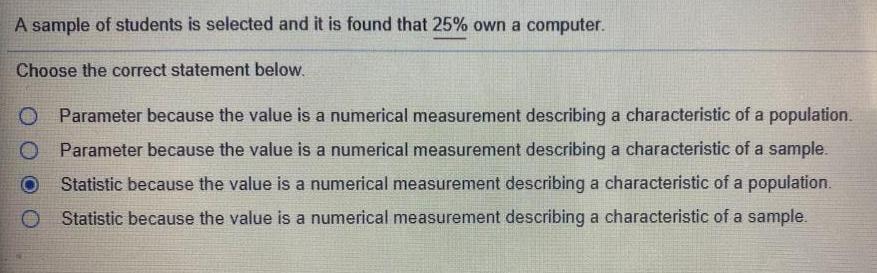
StatisticsA sample of students is selected and it is found that 25% own a computer.
Choose the correct statement below.
Parameter because the value is a numerical measurement describing a characteristic of a population.
Parameter because the value is a numerical measurement describing a characteristic of a sample.
Statistic because the value is a numerical measurement describing a characteristic of a population.
Statistic because the value is a numerical measurement describing a characteristic of a sample.
Math
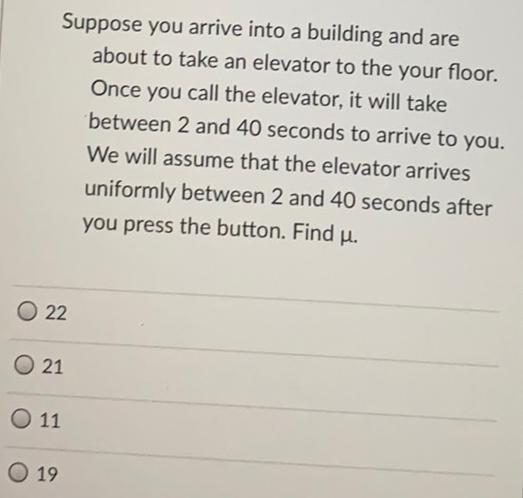
StatisticsSuppose you arrive into a building and are about to take an elevator to the your floor.
Once you call the elevator, it will take between 2 and 40 seconds to arrive to you.
We will assume that the elevator arrives uniformly between 2 and 40 seconds after you press the button. Find µ.
22
21
11
19

Math
StatisticsWhich sampling method subdivides the population into categories sharing similar characteristics and then selects a sample from each subdivision? Choose the correct answer below. Systematic Convenience Cluster Stratified

Math
StatisticsJenna drives on average 46 miles per day with a standard deviation of 5.3 miles per day. Suppose Jenna's miles driven per day are normally distributed. Let X the number of miles driven in a given day. Then X = N(46,5.3). Suppose Jenna drives 41 miles on Monday. The Z-score when x = 41 is ___ The mean is ___ This Z-score tells you that x = 41 is ___ standard deviations to the left of the mean.

Math
StatisticsYou are testing the null hypothesis p = 0.4 and will reject this hypothesis if z is less than -1.97. (Give your answers correct to four decimal places.) (a) If the null hypothesis is true and you observe z equal to -2.33, which of the following will you do? correctly fail to reject Ho correctly reject Ho commit a type I error commit a type II error (b) What is the significance level for this test? (c) What is the p-value for z = -2.33?

Math
StatisticsIn a fictional study, suppose that a psychologist is studying the effect of daily meditation on resting heart rate. The psychologist believes the patients who not meditate have a higher10 points resting heart rate. For a random sample of 45 pairs of identical twins, the psychologist randomly assigns one twin to one of two treatments. One twin in each pair meditates daily for one week, while the other twin does not meditate. At the end of the week, the psychologist measures the resting heart rate of each twin. Assume the mean resting heart rate is 80 heart beats per minute. The psychologist conducts a T-test for the mean of the differences in resting heart rate of patients who do not meditate minus resting heart rate of patients who do meditate. Which of the following is the correct null and alternative hypothesis for the psychologist's study? A. H₀: µ = 80; Ha: µ > 80 B. H₀: µ= 0; Ha: µ≠0 C. H₀: µ = 0; Ha: µ > 0

Math
StatisticsResearchers compare the body composition of cattle feeding on a grain diet with that of cattle feeding on a grass diet. This method of gathering data is classified as
(1)a census.
(2)a sample survey
(3)an experiment.
(4)an observational study.

Math
StatisticsA single strand of spaghetti should be 11 inches long. The employee in charge of the machine that cuts the spaghetti thinks the machine is producing shorter strands. She randomly samples 26 strands of spaghetti and measures them. She calculates a sample mean of 10.87 inches with a sample standard deviation of 0.46 inches. Perform a significance test using a significance level of a = 0.10 and use the result to make a strategic decision.
The employee should not adjust the machine that cuts the spaghetti.
The employee should set the machine to cut the spaghetti in shorter intervals.
The employee should set the machine to cut the spaghetti in longer intervals.
The employee should reduce the amount of ingredients used to make each batch of spaghetti.

Math
StatisticsA store manager timed Janette to see how long it would take her to fold and put away a sweater, a shirt, a pair ofpants, and a scarf. It took her 26.1 seconds for the shirt, 24.3 seconds for the sweater, 32.8 seconds for the pants, and 18.2 seconds for the scarf. What was the average time it took Janette to fold and put away all four items?

Math
StatisticsA pollster took a random sample of 100 students from a large university and computed a confidence interval to estimate the percentage of students who were planning to vote in the upcoming election. The pollster felt that the confidence interval was too wide to provide a precise estimate of the population parameter. What could the pollster have done to produce a narrower confidence interval that would produce a more precise estimate of the percentage of all university students who plan to vote in the upcoming election?
A. Increase the sample size to 150.
B. Increase the confidence level to 99%.
C. Both a and b
D. None of the above

Math
StatisticsNeverReady batteries have engineered a newer, longer-lasting AAA battery. The company claims this battery has an average life span of 17 hours with a standard deviation of 0.8 hours. Your statistics class questions this claim. As a class, you randomly select 30 batteries and find that the sample mean life span is 16.7 hours. If the process is working properly, what is the probability of getting a random sample of 30 batteries in which the sample mean lifetime is 16.7 hours or less?

Math
StatisticsThe weight of oranges growing in an orchard is normally distributed with a mean weight of 7.5 oz. and a standard deviation of 1.5 oz. Using the empirical rule, determine what interval would represent weights of the middle 95% of all oranges from this orchard.