Statistics Questions and Answers
Math
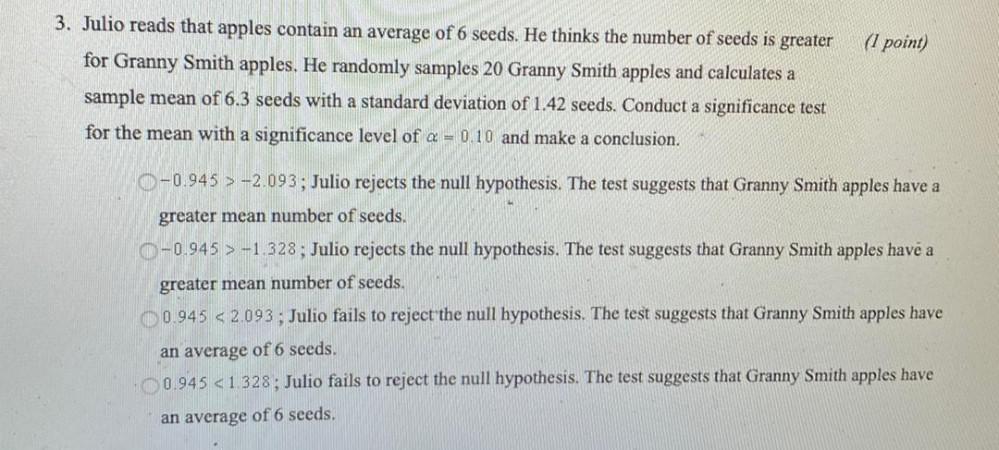
StatisticsJulio reads that apples contain an average of 6 seeds. He thinks the number of seeds is greater for Granny Smith apples. He randomly samples 20 Granny Smith apples and calculates a sample mean of 6.3 seeds with a standard deviation of 1.42 seeds. Conduct a significance test for the mean with a significance level of α = 0.10 and make a conclusion.
-0.945 > -2.093; Julio rejects the null hypothesis. The test suggests that Granny Smith apples have a greater mean number of seeds.
-0.945 > -1.328; Julio rejects the null hypothesis. The test suggests that Granny Smith apples have a greater mean number of seeds.
0.945 < 2.093 ; Julio fails to reject the null hypothesis. The test suggests that Granny Smith apples have an average of 6 seeds.
0.945 < 1.328; Julio fails to reject the null hypothesis. The test suggests that Granny Smith apples have an average of 6 seeds.
Math
StatisticsNoise levels at various area urban hospitals were measured in decibels. The mean of the noise levels in 88 randomly selected corridors was 81.1 decibels, and the standard deviation of the population was 8.06. Find the upper bound limit of the 90% confidence interval of the true mean.
Math
StatisticsMeasurements of the diameters of a random sample of 205 ball bearings made by a certain machine during one week showed a mean of 0.873 inch and a standard deviation of 0.481 inch. Find a lower bound 99% confidence limit for the mean diameter of all the ball bearings. Round your answer to 4 decimal places.
Math
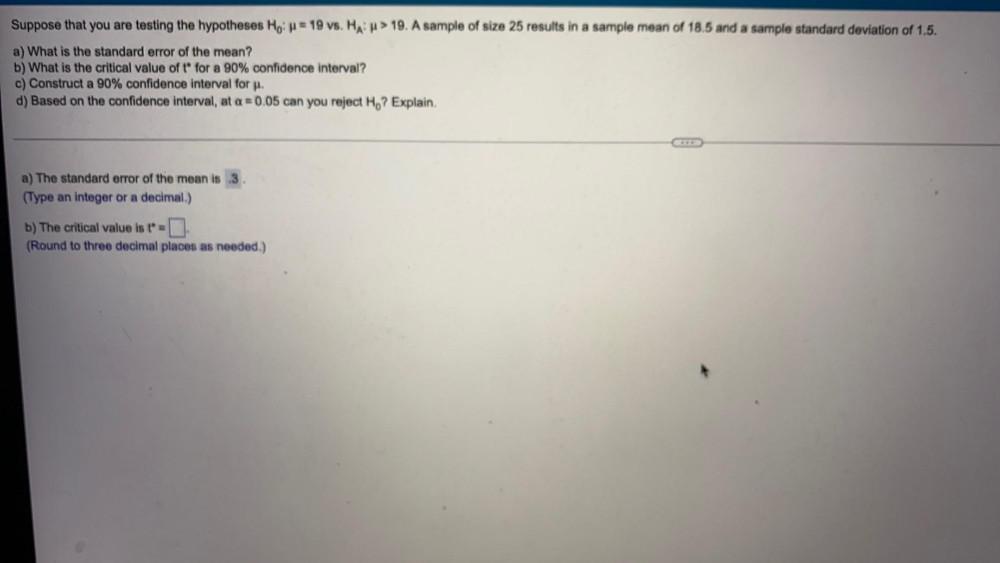
StatisticsSuppose that you are testing the hypotheses Ho: = 19 vs. HA: > 19. A sample of size 25 results in a sample mean of 18.5 and a sample standard deviation of 1.5.
a) What is the standard error of the mean?
b) What is the critical value of t for a 90% confidence interval?
c) Construct a 90% confidence interval for μ.
d) Based on the confidence interval, at a = 0.05 can you reject Ho? Explain.
a) The standard error of the mean is 3
b) The critical value is t
Math
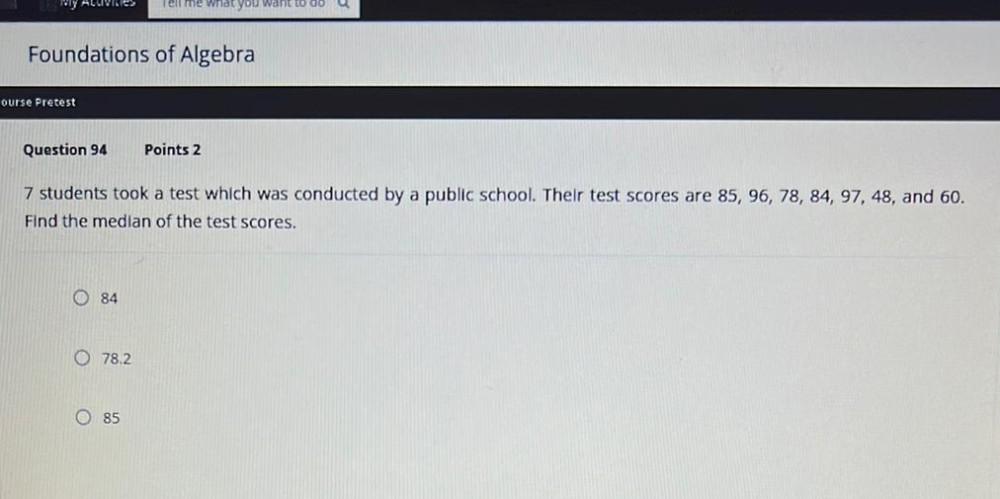
Statistics7 students took a test which was conducted by a public school. Their test scores are 85, 96, 78, 84, 97, 48, and 60. Find the median of the test scores.
84
78.2
85
Math
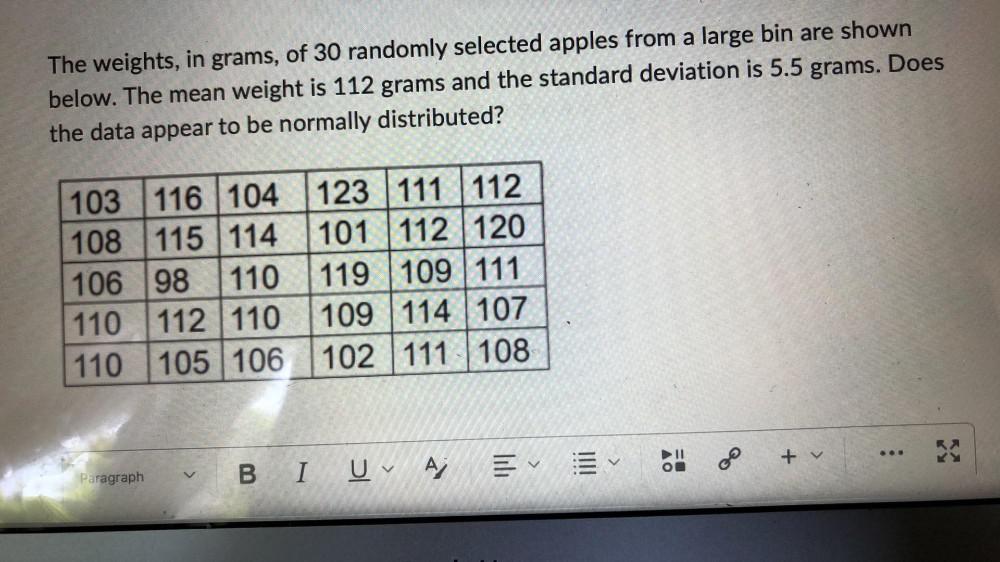
StatisticsThe weights, in grams, of 30 randomly selected apples from a large bin are shown below. The mean weight is 112 grams and the standard deviation is 5.5 grams. Does the data appear to be normally distributed?
103 116 104 123 111 112
108 115 114 101 112 120
106 98 110 119 109 111
110 112 110 109 114 107
110 105 106 102 111 108
Math
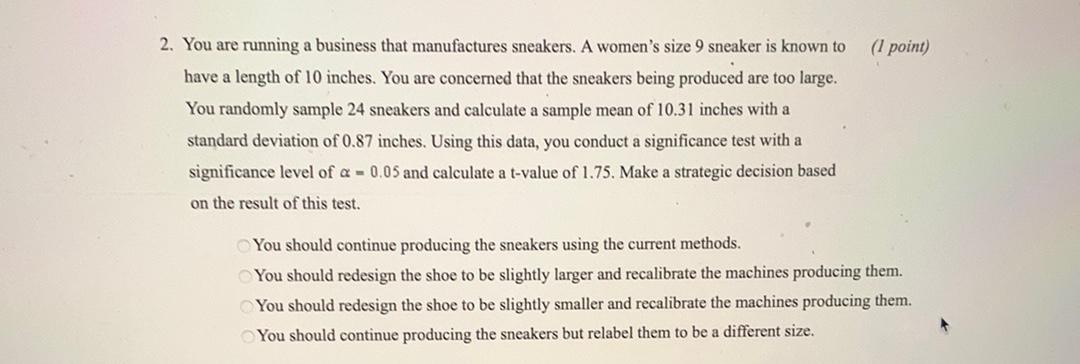
StatisticsYou are running a business that manufactures sneakers. A women's size 9 sneaker is known to have a length of 10 inches. You are concerned that the sneakers being produced are too large. You randomly sample 24 sneakers and calculate a sample mean of 10.31 inches with a standard deviation of 0.87 inches. Using this data, you conduct a significance test with a significance level of α = 0.05 and calculate a t-value of 1.75. Make a strategic decision based on the result of this test.
You should continue producing the sneakers using the current methods.
You should redesign the shoe to be slightly larger and recalibrate them machines producing them.
You should redesign the shoe to be slightly smaller and recalibrate the machines producing them.
You should continue producing the sneakers but relabel them to be a different size.
Math
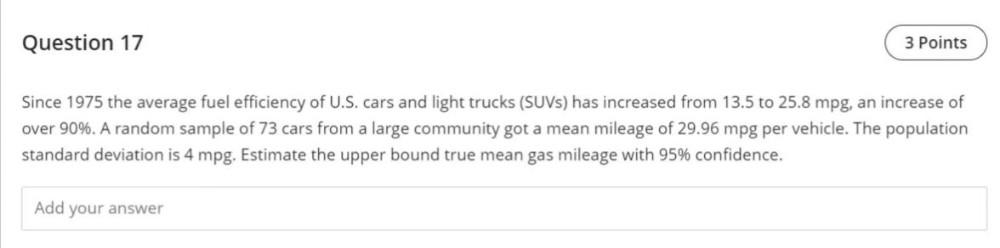
StatisticsSince 1975 the average fuel efficiency of U.S. cars and light trucks (SUVs) has increased from 13.5 to 25.8 mpg, an increase of over 90%. A random sample of 73 cars from a large community got a mean mileage of 29.96 mpg per vehicle. The population standard deviation is 4 mpg. Estimate the upper bound true mean gas mileage with 95% confidence.
Math
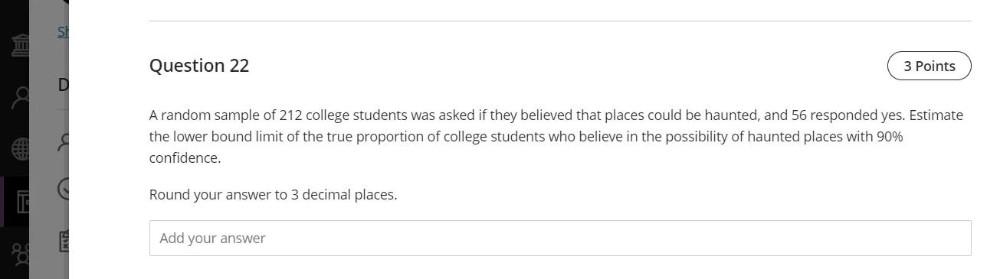
StatisticsA random sample of 212 college students was asked if they believed that places could be haunted, and 56 responded yes. Estimate the lower bound limit of the true proportion of college students who believe in the possibility of haunted places with 90% confidence.
Math
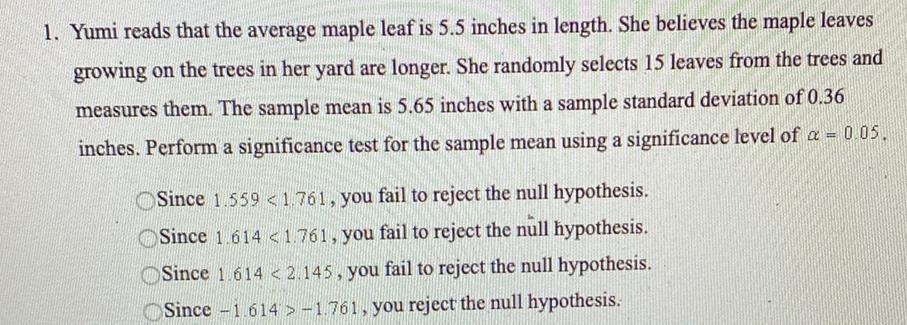
StatisticsYumi reads that the average maple leaf is 5.5 inches in length. She believes the maple leaves growing on the trees in her yard are longer. She randomly selects 15 leaves from the trees and measures them. The sample mean is 5.65 inches with a sample standard deviation of 0.36 inches. Perform a significance test for the sample mean using a significance level of α = 0 05.
Since 1.559 <1.761, you fail to reject the null hypothesis.
Since 1.614 <1.761, you fail to reject the null hypothesis.
Since 1.614 <2.145, you fail to reject the null hypothesis.
Since -1.614 > -1.761, you reject the null hypothesis.
Math
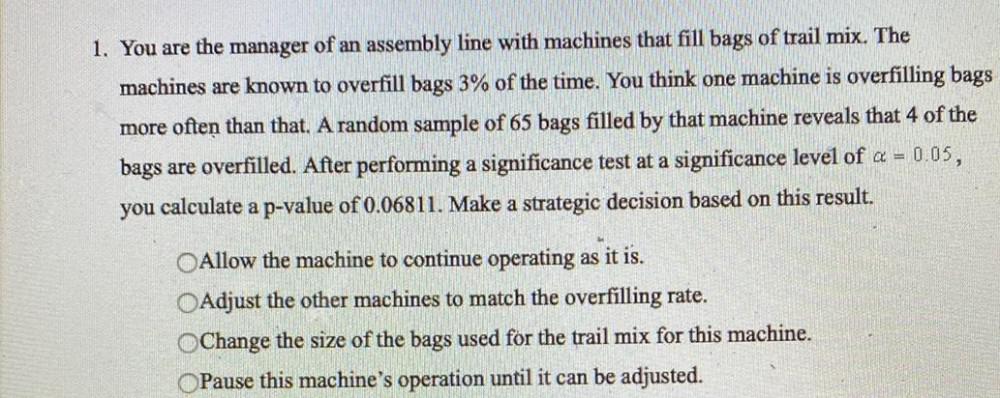
StatisticsYou are the manager of an assembly line with machines that fill bags of trail mix. The machines are known to overfill bags 3% of the time. You think one machine is overfilling bags more often than that. A random sample of 65 bags filled by that machine reveals that 4 of the bags are overfilled. After performing a significance test at a significance level of α = 0.05, You calculate a p-value of 0.06811. Make a strategic decision based on this result.
Allow the machine to continue operating as it is.
Adjust the other machines to match the overfilling rate.
Change the size of the bags used for the trail mix for this machine.
Pause this machine's operation until it can be adjusted.
Math
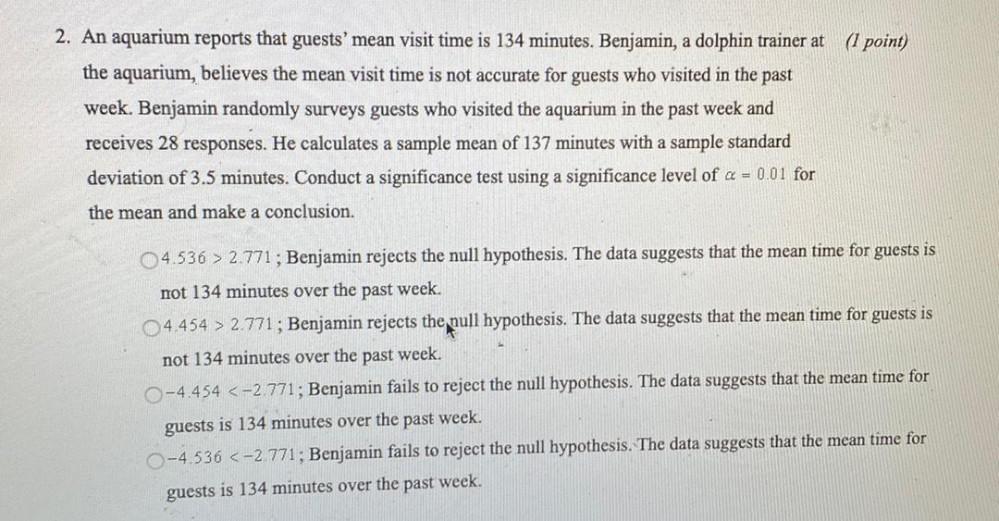
StatisticsAn aquarium reports that guests' mean visit time is 134 minutes. Benjamin, a dolphin trainer at the aquarium, believes the mean visit time is not accurate for guests who visited in the past week. Benjamin randomly surveys guests who visited the aquarium in the past week and receives 28 responses. He calculates a sample mean of 137 minutes with a sample standard deviation of 3.5 minutes. Conduct a significance test using a significance level of α = 0.01 for the mean and make a conclusion.
4.536 > 2.771; Benjamin rejects the null hypothesis. The data suggests that the mean time for guests is mot 134 minutes over the past week.
4.454 > 2.771; Benjamin rejects the pull hypothesis. The data suggests that the mean time for guests is not 134 minutes over the past week.
-4.454 <-2.771; Benjamin fails to reject the null hypothesis. The data suggests that the mean time for guests is 134 minutes over the past week.
-4.536 <-2.771; Benjamin fails to reject the null hypothesis. The data suggests that the mean time for guests is 134 minutes over the past week.
Math
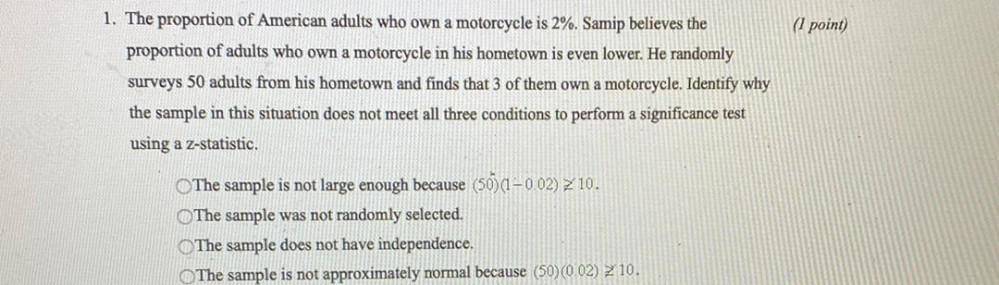
StatisticsThe proportion of American adults who own a motorcycle is 2%. Samip believes the proportion of adults who own a motorcycle in his hometown is even lower. He randomly surveys 50 adults from his hometown and finds that 3 of them own a motorcycle. Identify why the sample in this situation does not meet all three conditions to perform a significance test using a Z-statistic
The sample is not large enough because (50)(1 -0.02) ≱ 10.
The sample was not randomly selected.
The sample does not have independence.
The sample is not approximately normal because (50 (0.02) ≱ 10.
Math
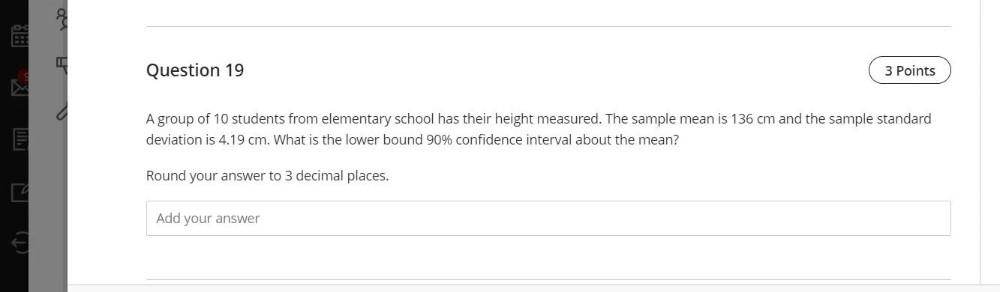
StatisticsA group of 10 students from elementary school has their height measured. The sample mean is 136 cm and the sample standard deviation is 4.19 cm. What is the lower bound 90% confidence interval about the mean? Round your answer to 3 decimal places.
Math
StatisticsWhat is the probability that score pulled at random is less than 48.4?
Express your answer rounded correctly to the thousandth place.
Probability =
Math
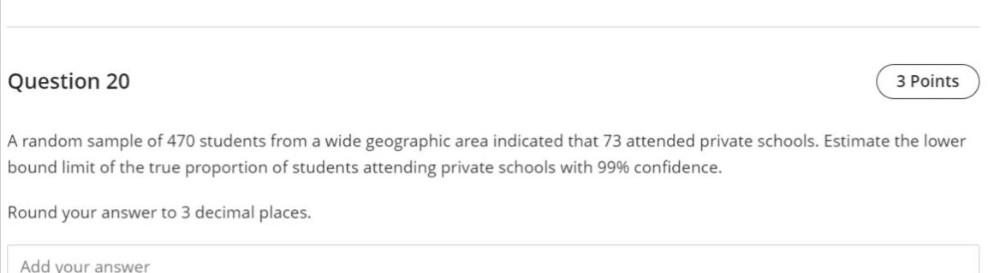
StatisticsA random sample of 470 students from a wide geographic area indicated that 73 attended private schools. Estimate the lower bound limit of the true proportion of students attending private schools with 99% confidence.
Math
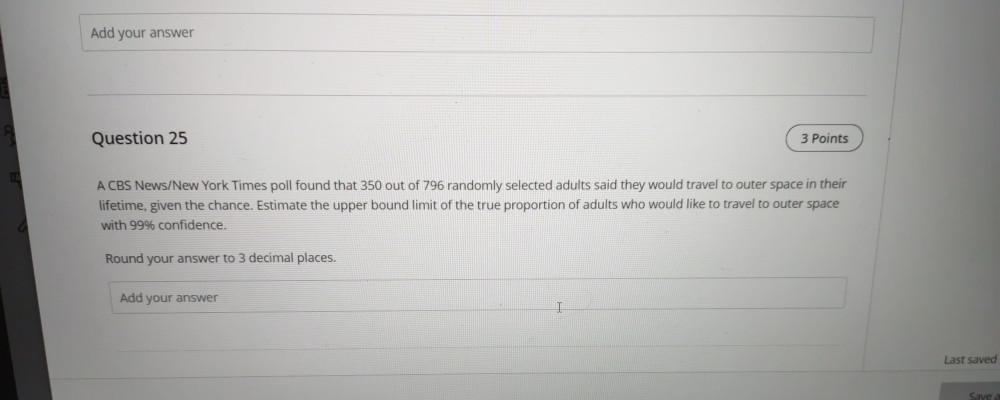
StatisticsA CBS News/New York Times poll found that 350 out of 796 randomly selected adults said they would travel to outer space in their lifetime, given the chance. Estimate the upper bound limit of the true proportion of adults who would like to travel to outer space with 99% confidence.
Round your answer to 3 decimal places.
Math
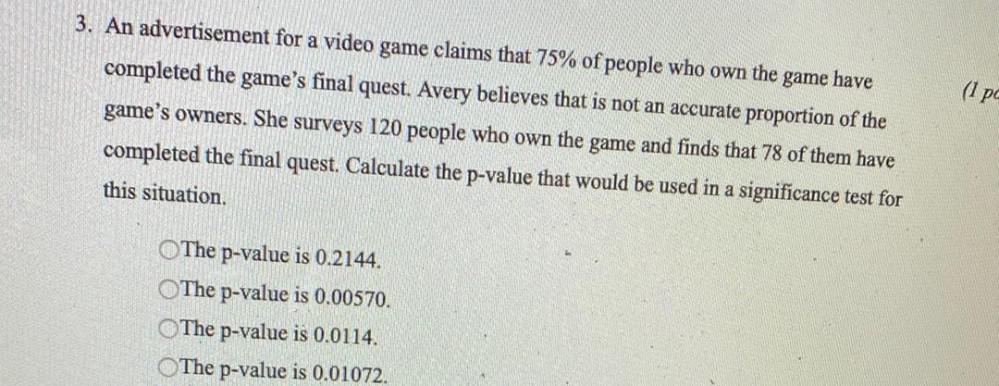
StatisticsAn advertisement for a video game claims that 75% of people who own the game have completed the game's final quest. Avery believes that is not an accurate proportion of the game's owners. She surveys 120 people who own the game and finds that 78 of them have completed the final quest. Calculate the p-value that would be used in a significance test for this situation.
○ The p-value is 0.2144.
○ The p-value is 0.00570.
○ The p-value is 0.0114.
○ The p-value is 0.01072.
Math
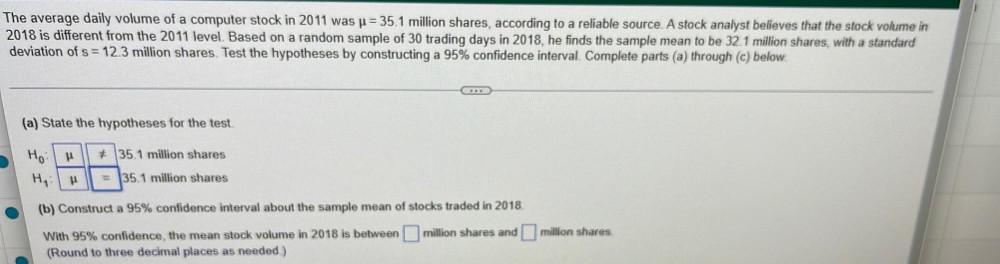
StatisticsThe average daily volume of a computer stock in 2011 was u = 35.1 million shares, according to a reliable source. A stock analyst believes that the stock volume in 2018 is different from the 2011 level. Based on a random sample of 30 trading days in 2018, he finds the sample mean to be 32.1 million shares with a standard deviation of s = 12.3 million shares. Test the hypotheses by constructing a 95% confidence interval. Complete parts (a) through (c) below.
(a) State the hypotheses for the test.
Ho ____ ______35.1 million shares
H1_____ _______35,1 million shares
(b) Construct a 95% confidence interval about the sample mean of stocks traded in 2018 With 95% confidence, the mean stock volume in 2018 is between_____ million shares and____ million shares. (Round to three decimal places as needed).
Math
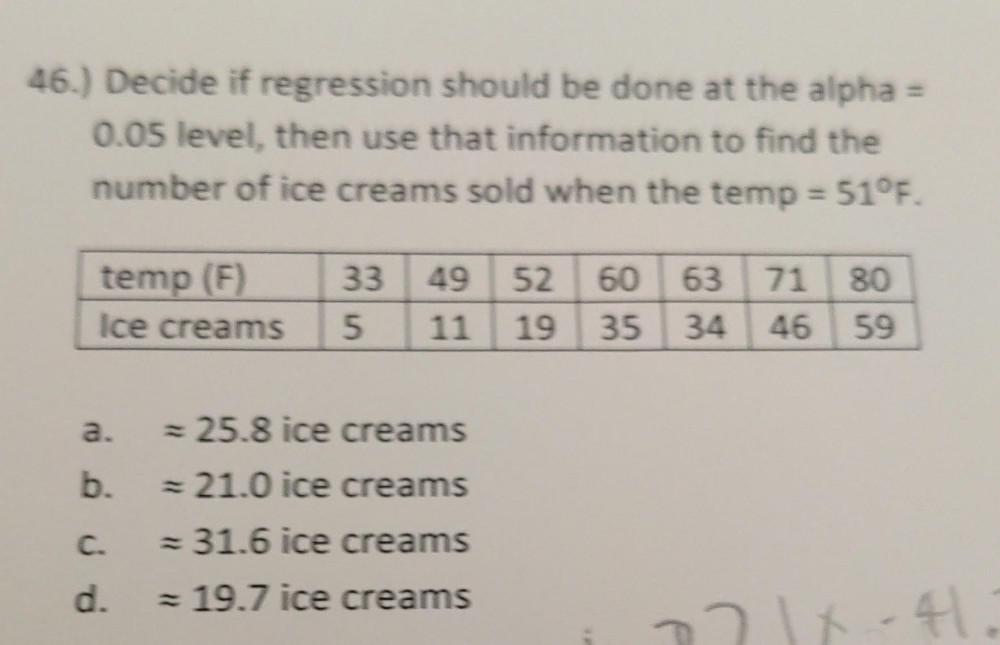
StatisticsDecide if regression should be done at the alpha 0.05 level, then use that information to find the number of ice creams sold when the temp = 51°F.
temp (F) 33 49 52 60 63 71 80
Ice creams 5 11 19 35 34 46 59
a). = 25.8 ice creams
b.) = 21.0 ice creams
C.) = 31.6 ice creams
d.) = 19.7 ice creams
.
Math
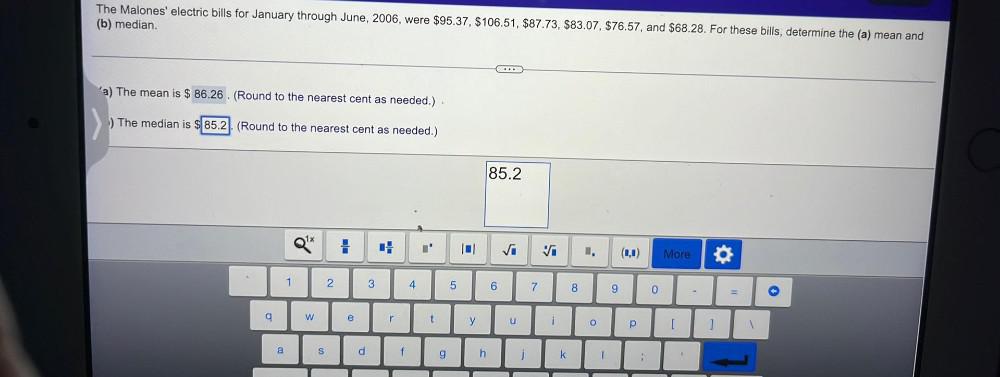
StatisticsThe Malones' electric bills for January through June, 2006, were $95.37, $106.51, $87.73, $83.07, $76.57, and $68.28. For these bills, determine the (a) mean and (b) median.
a) The mean is $ 86.26. (Round to the nearest cent as needed.)
b) The median is $ 85.2. (Round to the nearest cent as needed.)
Math
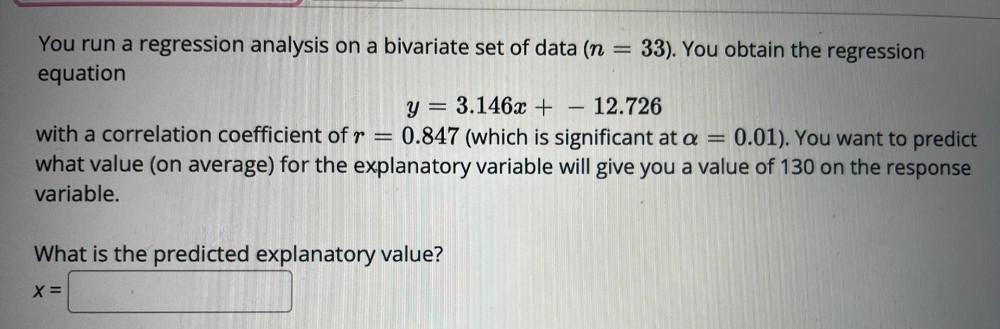
StatisticsYou run a regression analysis on a bivariate set of data (n= 33). You obtain the regression equation
y = 3.146x + - 12.726
with a correlation coefficient of r = 0.847 (which is significant at α = 0.01). You want to predict what value (on average) for the explanatory variable will give you a value of 130 on the response variable.
What is the predicted explanatory value?
X=_________
Math
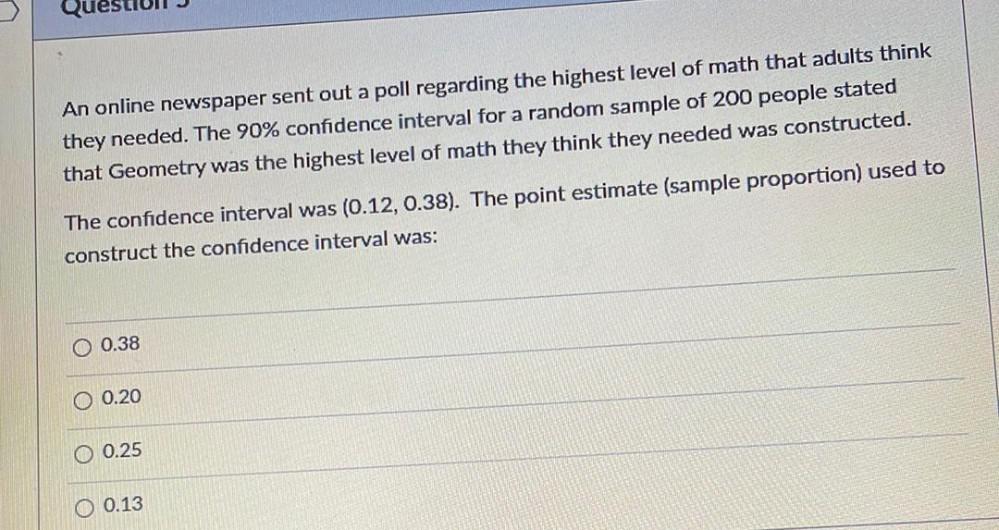
StatisticsAn online newspaper sent out a poll regarding the highest level of math that adults think they needed. The 90% confidence interval for a random sample of 200 people stated that Geometry was the highest level of math they think they needed was constructed.
The confidence interval was (0.12, 0.38). The point estimate (sample proportion) used to construct the confidence interval was:
A) 0.38.
B) 0.20.
C) 0.25.
D) 0.13.
Math
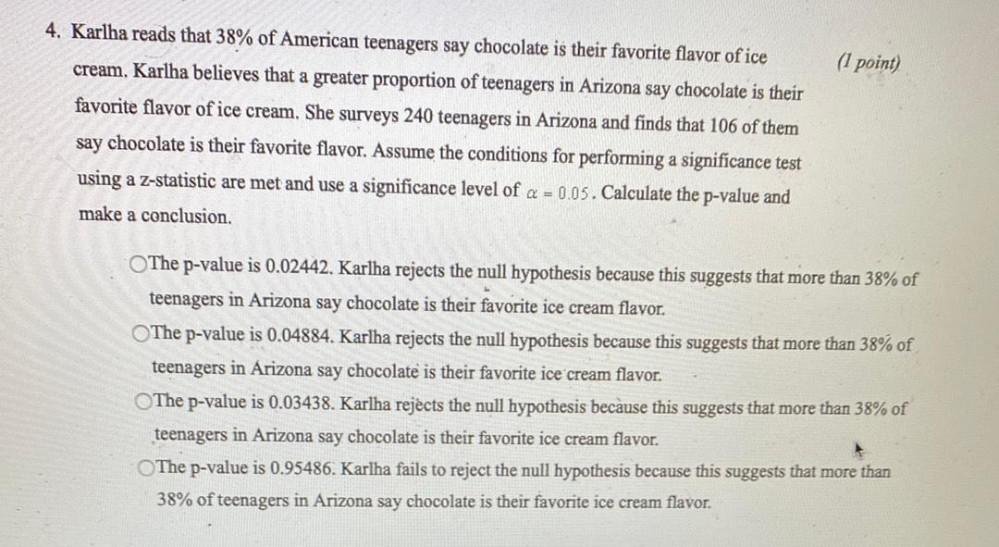
StatisticsKarlha reads that 38% of American teenagers say chocolate is their favorite flavor of ice cream. Karlha believes that a greater proportion of teenagers in Arizona say chocolate is their favorite flavor of ice cream. She surveys 240 teenagers in Arizona and finds that 106 of them say chocolate is their favorite flavor. Assume the conditions for performing a significance test using a z-statistic are met and use a significance level of α = 0.05. Calculate the p-value and make a conclusion.
○ The p-value is 0.02442. Karlha rejects the null hypothesis because this suggests that more than 38% of teenagers in Arizona say chocolate is their favorite ice cream flavor.
○ The p-value is 0.04884. Karlha rejects the null hypothesis because this suggests that more than 38% of teenagers in Arizona say chocolate is their favorite ice cream flavor.
○ The p-value is 0.03438. Karlha rejects the null hypothesis because this suggests that more than 38% of teenagers in Arizona say chocolate is their favorite ice cream flavor.
○ The p-value is 0.95486. Karlha fails to reject the null hypothesis because this suggests that more than 38% of teenagers in Arizona say chocolate is their favorite ice cream flavor.
Math
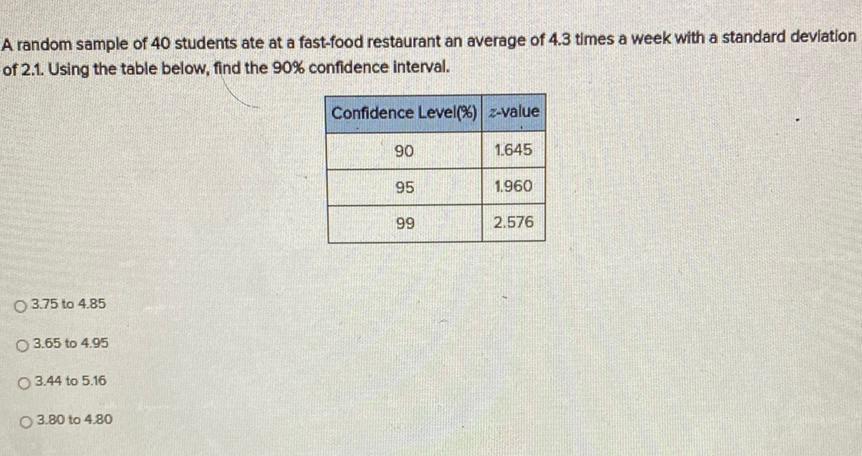
StatisticsA random sample of 40 students ate at a fast-food restaurant an average of 4.3 times a week with a standard deviation of 2.1. Using the table below, find the 90% confidence interval.
3.75 to 4.85
3.65 to 4.95
3.44 to 5.16
3.80 to 4.80
Math
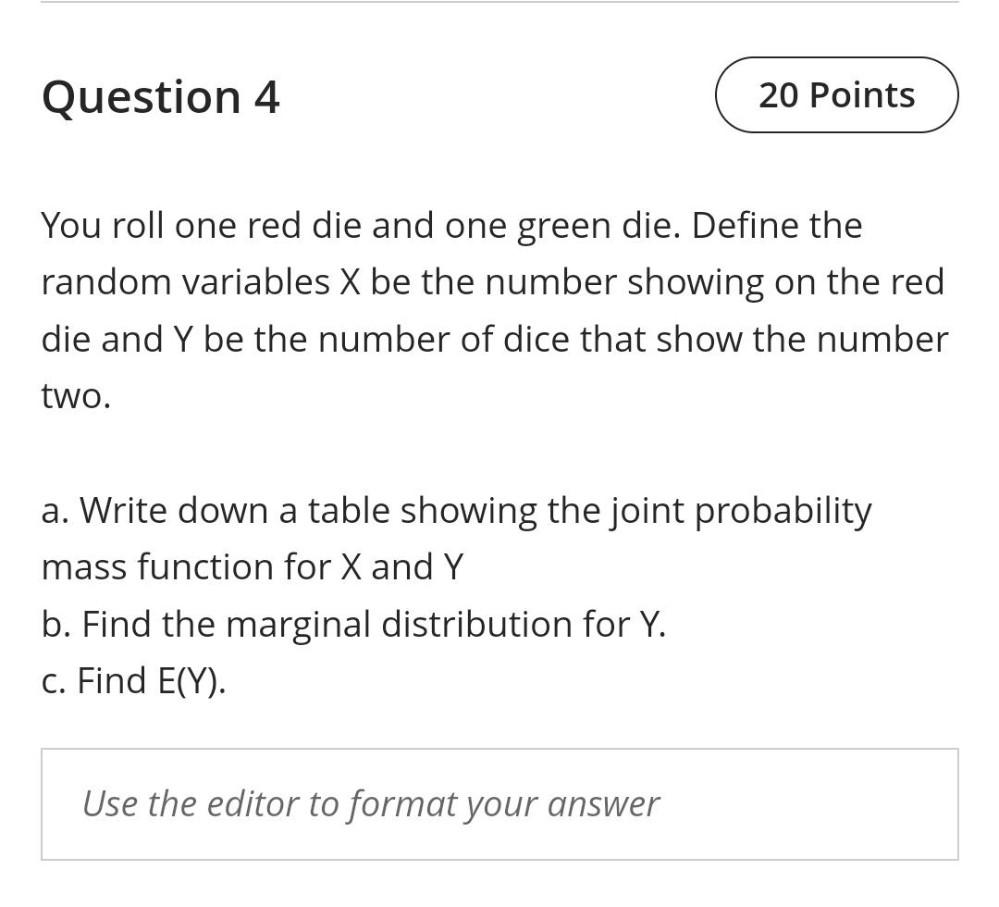
StatisticsYou roll one red die and one green die. Define the random variables X be the number showing on the red die and Y be the number of dice that show the number two.
a. Write down a table showing the joint probability mass function for X and Y
b. Find the marginal distribution for Y.
C. Find E(Y).
Math
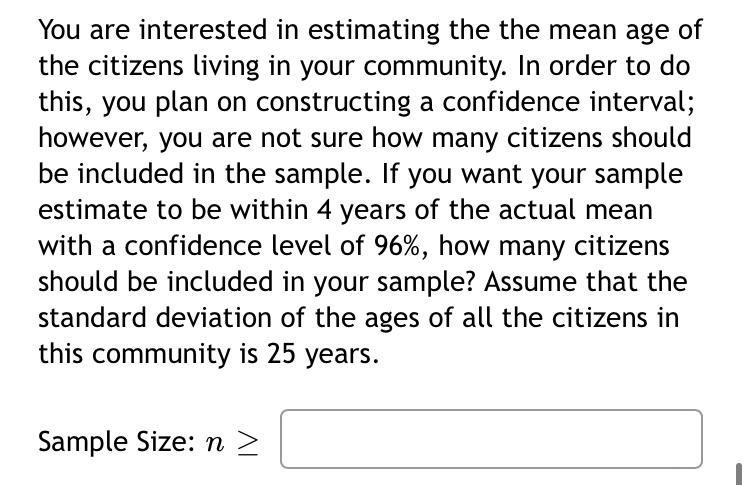
StatisticsYou are interested in estimating the the mean age of the citizens living in your community. In order to do this, you plan on constructing a confidence interval; however, you are not sure how many citizens should be included in the sample. If you want your sample estimate to be within 4 years of the actual mean with a confidence level of 96%, how many citizens should be included in your sample? Assume that the standard deviation of the ages of all the citizens in this community is 25 years.
Math
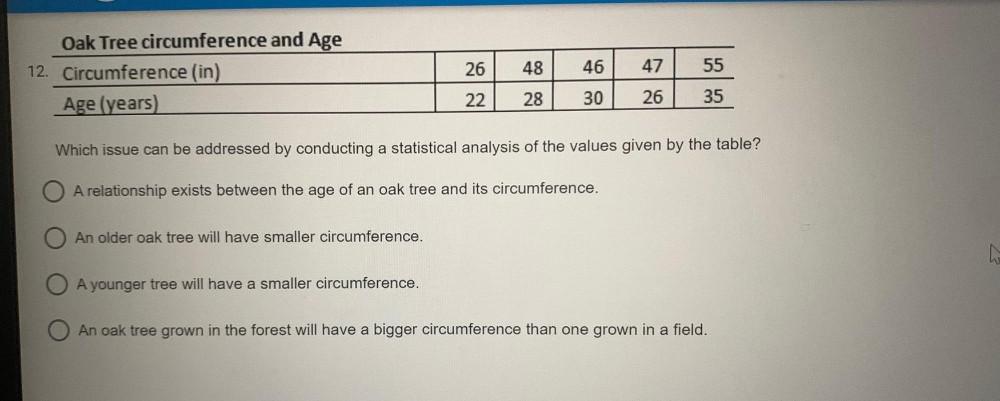
StatisticsOak Tree circumference and Age
Circumference (in) 26 48 46 47 55
Age (years) 22 28 30 26 35
Which issue can be addressed by conducting a statistical analysis of the values given by the table?
A relationship exists between the age of an oak tree and its circumference.
An older oak tree will have smaller circumference.
A younger tree will have a smaller circumference.
An oak tree grown in the forest will have a bigger circumference than one grown in a field.
Math
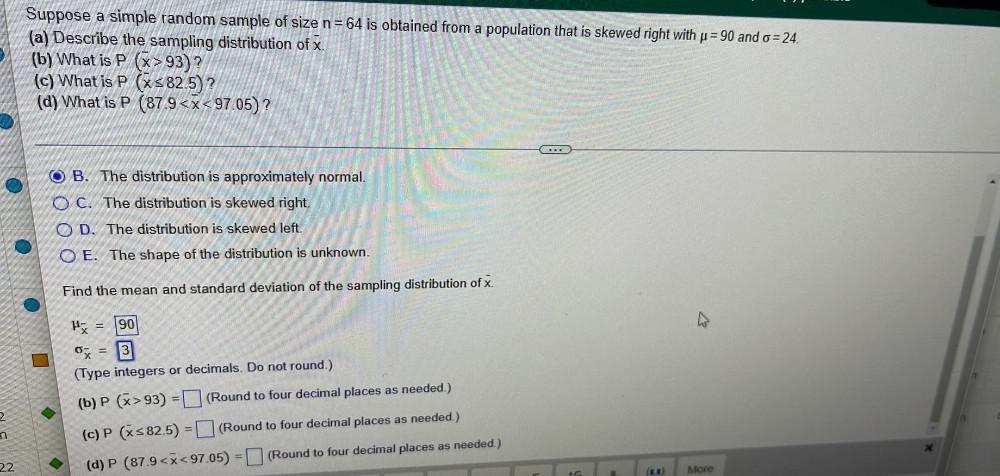
StatisticsSuppose a simple random sample of size n = 64 is obtained from a population that is skewed right with μ= 90 and σ = 24.
(a) Describe the sampling distribution of x.
(b) What is P (x̅>93)?
(c) What is P (x̅≤82.5)?
(d) What is P (87.9<x̅< 97.05)?
Math
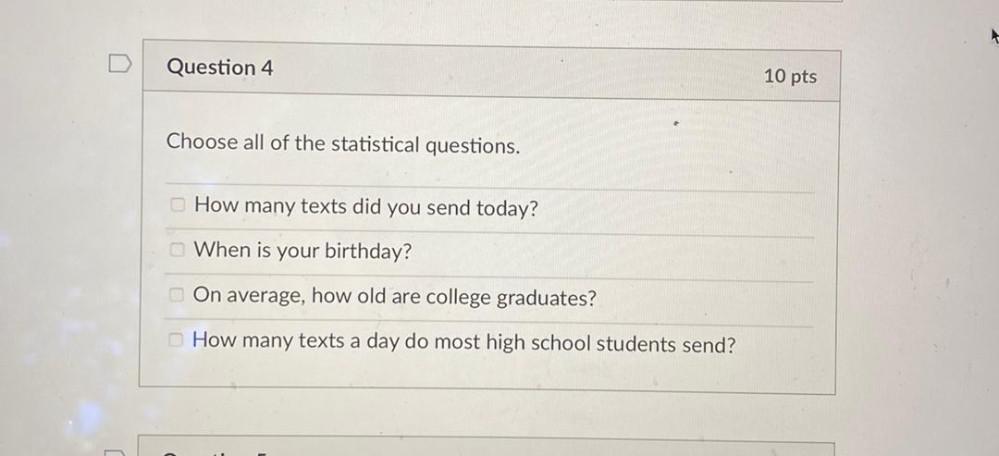
StatisticsChoose all of the statistical questions.
(A) How many texts did you send today?
(B) When is your birthday?
(C) On average, how old are college graduates?
(D) How many texts a day do most high school students send?
Math
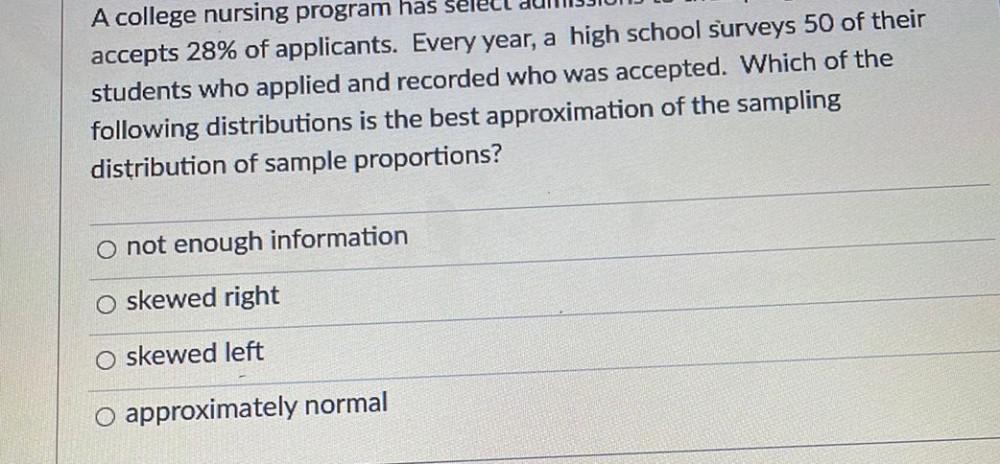
StatisticsA college nursing program has select admissions to their program and only accepts 28% of applicants. Every year, a high school surveys 50 their students who applied and recorded who was accepted. Which of the following distributions is the best approximation of the sampling distribution of sample proportions?
not enough information.
skewed right.
skewed left.
approximately normal.
Math
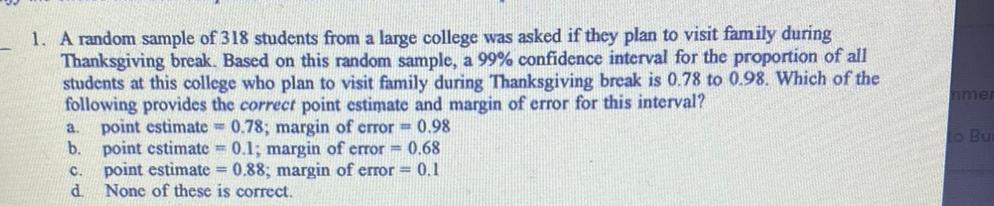
StatisticsA random sample of 318 students from a large college was asked if they plan to visit family during Thanksgiving break. Based on this random sample, a 99% confidence interval for the proportion of all students at this college who plan to visit family during Thanksgiving break is 0.78 to 0.98. Which of the following provides the correct point estimate and margin of error for this interval?
a. point estimate = 0.78; margin of error = 0.98
b. point estimate = 0.1; margin of error = 0.68
c. point estimate = 0.88; margin of error = 0.1
d. None of these is correct.
Math
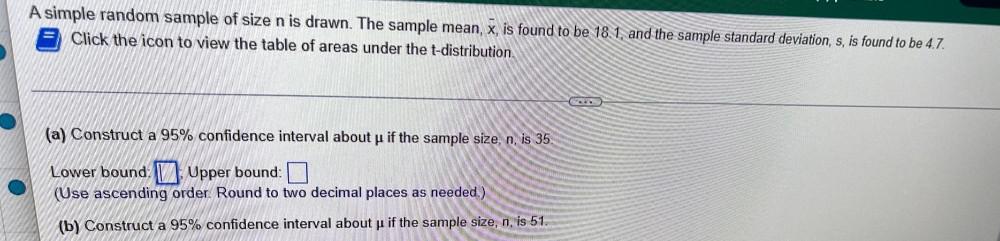
StatisticsA simple random sample of size n is drawn. The sample mean, x, is found to be 18.1, and the sample standard deviation, s, is found to be 4.7.
(a) Construct a 95% confidence interval about p if the sample size, n, is 35.
Lower bound:___ Upper bound:______
(b) Construct a 95% confidence interval about p if the sample size, n, is 51.
Math
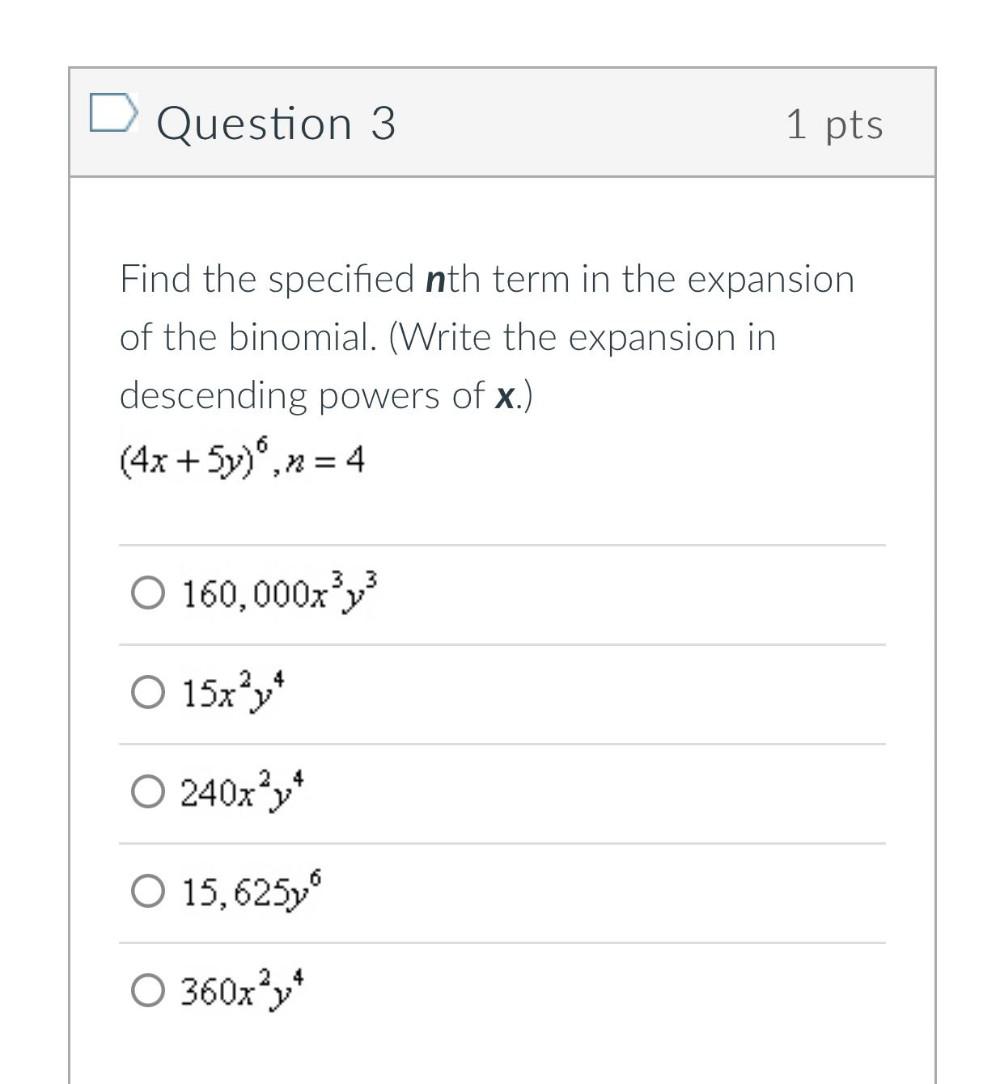
StatisticsFind the specified nth term in the expansion of the binomial. (Write the expansion in descending powers of x.)
(4x + 5y)^6 ,n=4
a)160,000x^3y^3
b)15x^2y^4
c)240x^2y^4
d)15,625y^6
e)360x^2y^4
Math
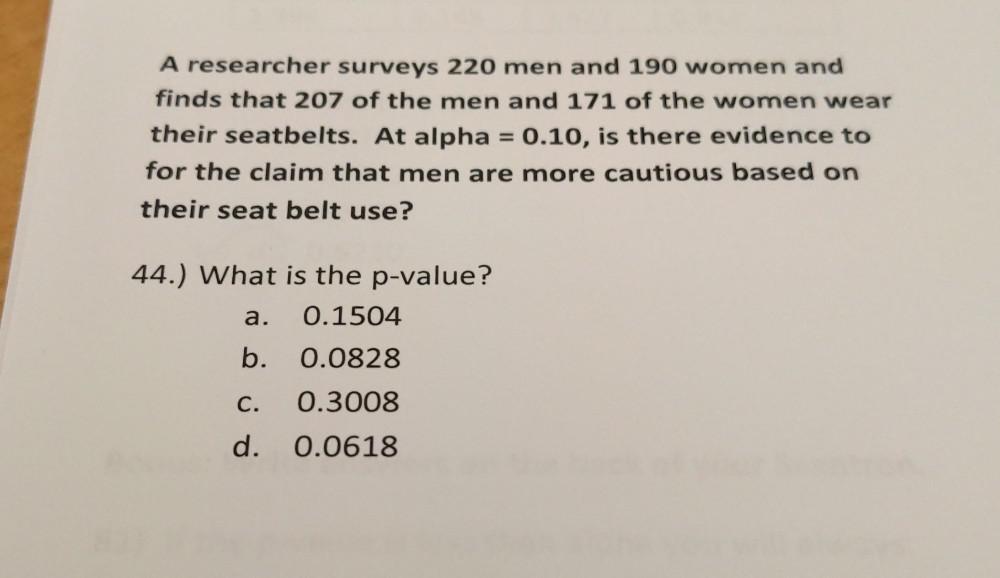
StatisticsA researcher surveys 220 men and 190 women and finds that 207 of the men and 171 of the women wear their seatbelts. At alpha = 0.10, is there evidence to for the claim that men are more cautious based on their seat belt use?
What is the p-value?
A).1504
B).0828
C).0.3008
d).0.0618
Math
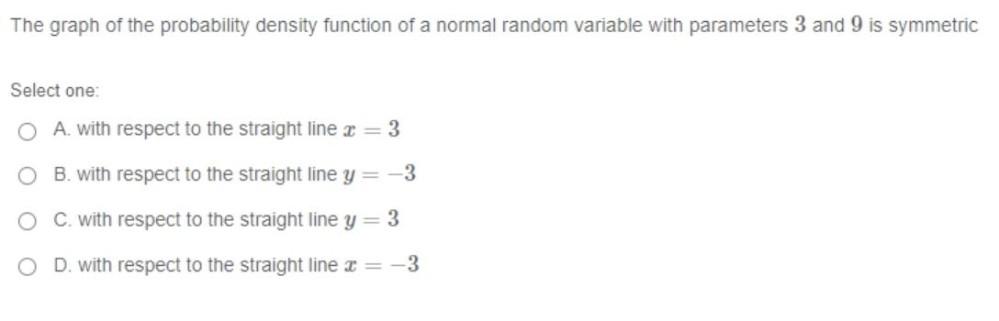
StatisticsThe graph of the probability density function of a normal random variable with parameters 3 and 9 is symmetric
A. with respect to the straight line r = 3
B. with respect to the straight line y = -3
C. with respect to the straight line y = 3
D. with respect to the straight line x = -3
Math
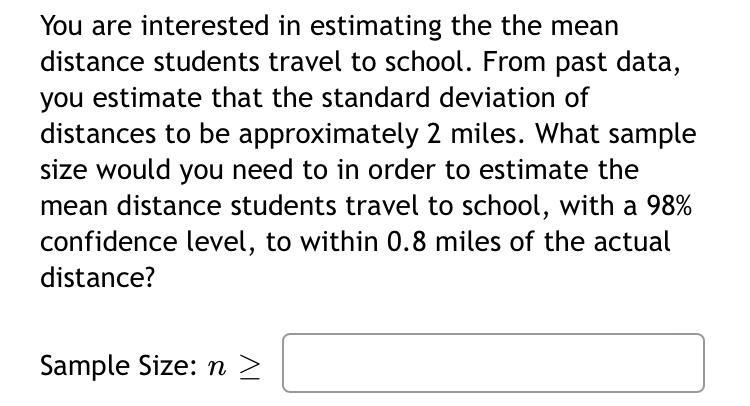
StatisticsYou are interested in estimating the mean distance students travel to school. From past data, you estimate that the standard deviation of distances to be approximately 2 miles. What sample size would you need to in order to estimate the mean distance students travel to school, with a 98% confidence level, to within 0.8 miles of the actual distance?
Sample Size: n ≥_______
Math
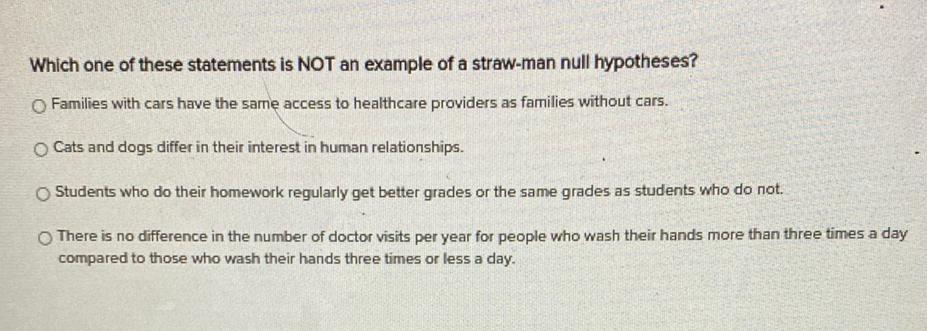
StatisticsWhich one of these statements is NOT an example of a straw-man null hypotheses?
(A) Families with cars have the same access to healthcare providers as families without cars.
(B) Cats and dogs differ in their interest in human relationships.
(C) Students who do their homework regularly get better grades or the same grades as students who do not.
(D) There is no difference in the number of doctor visits per year for people who wash their hands more than three times a day compared to those who wash their hands three times or less a day.
Math
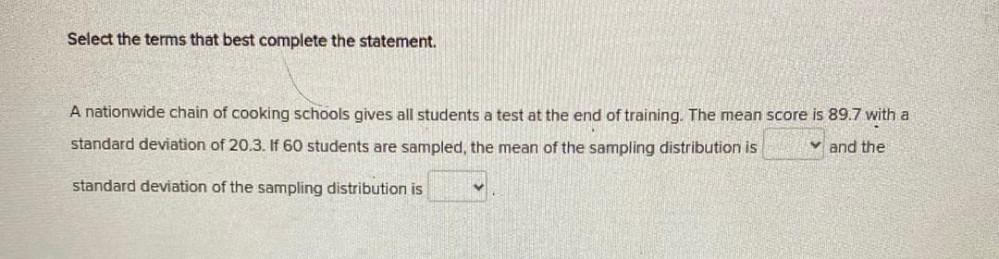
StatisticsA nationwide chain of cooking schools gives all students a test at the end of training. The mean score is 89.7 with a standard deviation of 20.3. If 60 students are sampled, the mean of the sampling distribution is and the standard deviation of the sampling distribution is
Math
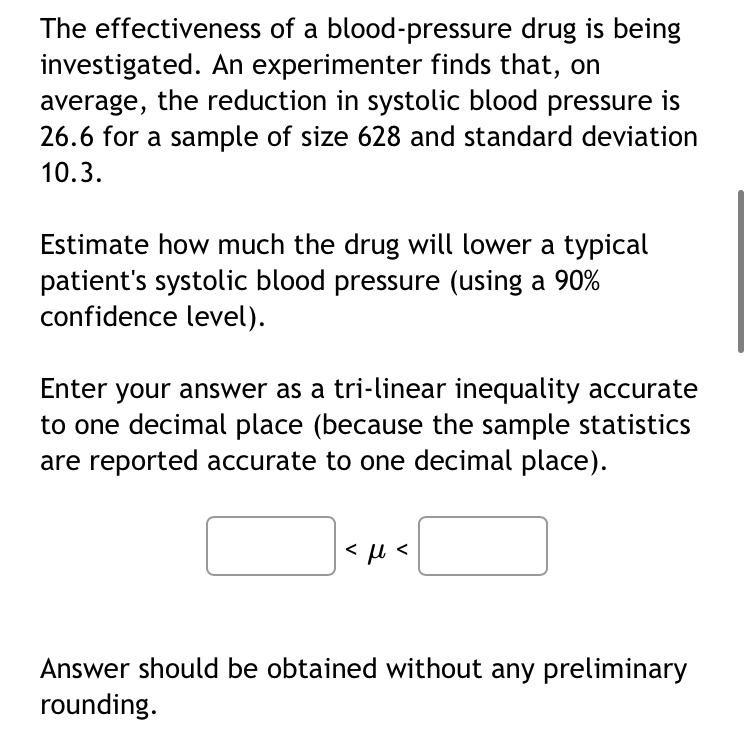
StatisticsThe effectiveness of a blood-pressure drug is being investigated. An experimenter finds that, on average, the reduction in systolic blood pressure is 26.6 for a sample of size 628 and standard deviation 10.3. Estimate how much the drug will lower a typical patient's systolic blood pressure (using a 90% confidence level). Enter your answer as a tri-linear inequality accurate to one decimal place (because the sample statistics are reported accurate to one decimal place).
Math
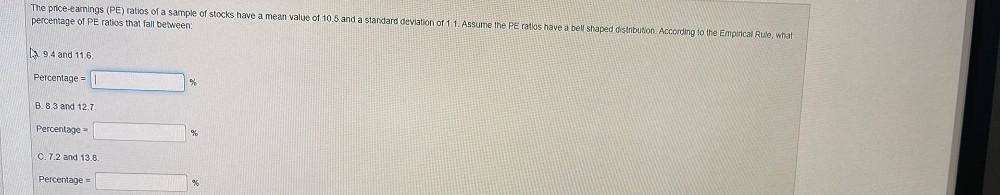
StatisticsThe price-earnings (PE) ratios of a sample of stocks have a mean value of 10.5 and a standard deviation of 1.1. Assume the PE ratios have a bell shaped distribution. According to the Empirical Rule, what percentage of PE ratios that fall between,
A 9.4 and 11.6
B 8.3 and 12.7
C 7.2 and 13.8
Math
StatisticsThe Malones' electric bills for January through June, 2006, were $95.37, $106.51, $87.73, $83.07, $76.57, and $68.28. For these bills, determine the (a) mean and (b) median
a) The mean is $______.
(Round to the nearest cent as needed.)
![Suppose a game has payoff matrix [0 -4 2]
[3 2 -4]
[1 -1 0]
Find the expected value of the game for the following strategies for players A and B.
(a) A=[ 0.1 0.4 0.5]; B = [0.2] (b) A = [ 0.3 0.4 0.3 ]; B =[0.8]
[0.4] [0.1]
[0.4] [0.1]
(a) The expected value is -0.26 .(Round to two decimal places as needed.)
(b) The expected value is ▢ (Round to two decimal places as needed.)](https://media.kunduz.com/media/sug-question/raw/77573753-1658831821.5431.jpeg?w=256)
Math
StatisticsSuppose a game has payoff matrix [0 -4 2]
[3 2 -4]
[1 -1 0]
Find the expected value of the game for the following strategies for players A and B.
(a) A=[ 0.1 0.4 0.5]; B = [0.2] (b) A = [ 0.3 0.4 0.3 ]; B =[0.8]
[0.4] [0.1]
[0.4] [0.1]
(a) The expected value is -0.26 .(Round to two decimal places as needed.)
(b) The expected value is ▢ (Round to two decimal places as needed.)
Math
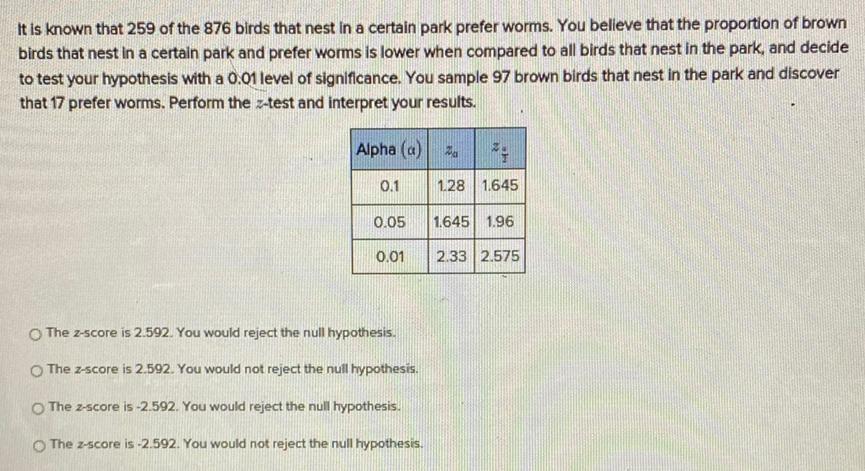
StatisticsIt is known that 259 of the 876 birds that nest in a certain park prefer worms. You believe that the proportion of brown birds that nest in a certain park and prefer worms is lower when compared to all birds that nest in the park, and decide to test your hypothesis with a 0.01 level of significance. You sample 97 brown birds that nest in the park and discover that 17 prefer worms. Perform the z-test and interpret your results.
Alpha (a) Zₐ zₐ/₂
0.1 1.28 1.645
0.05 1.645 1.96
0.01 2.33 2.575
The z-score is 2.592. You would reject the null hypothesis.
The z-score is 2.592. You would not reject the null hypothesis.
The z-score is -2.592. You would reject the null hypothesis.
The z-score is -2.592. You would not reject the null hypothesis.
Math
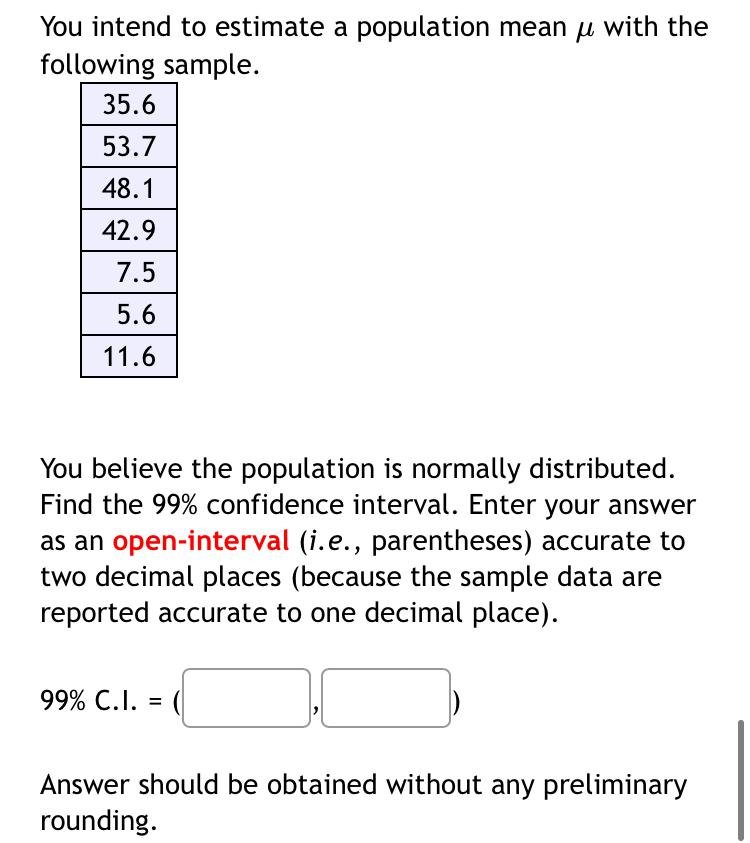
StatisticsYou intend to estimate a population mean μ with the following sample.
35.6
53.7
48.1
42.9
7.5
5.6
11.6
You believe the population is normally distributed. Find the 99% confidence interval. Enter your answer as an open-interval (i.e., parentheses) accurate to two decimal places (because the sample data are reported accurate to one decimal place).
99% C.I. =(______,_______).
Answer should be obtained without any preliminary rounding.
Math
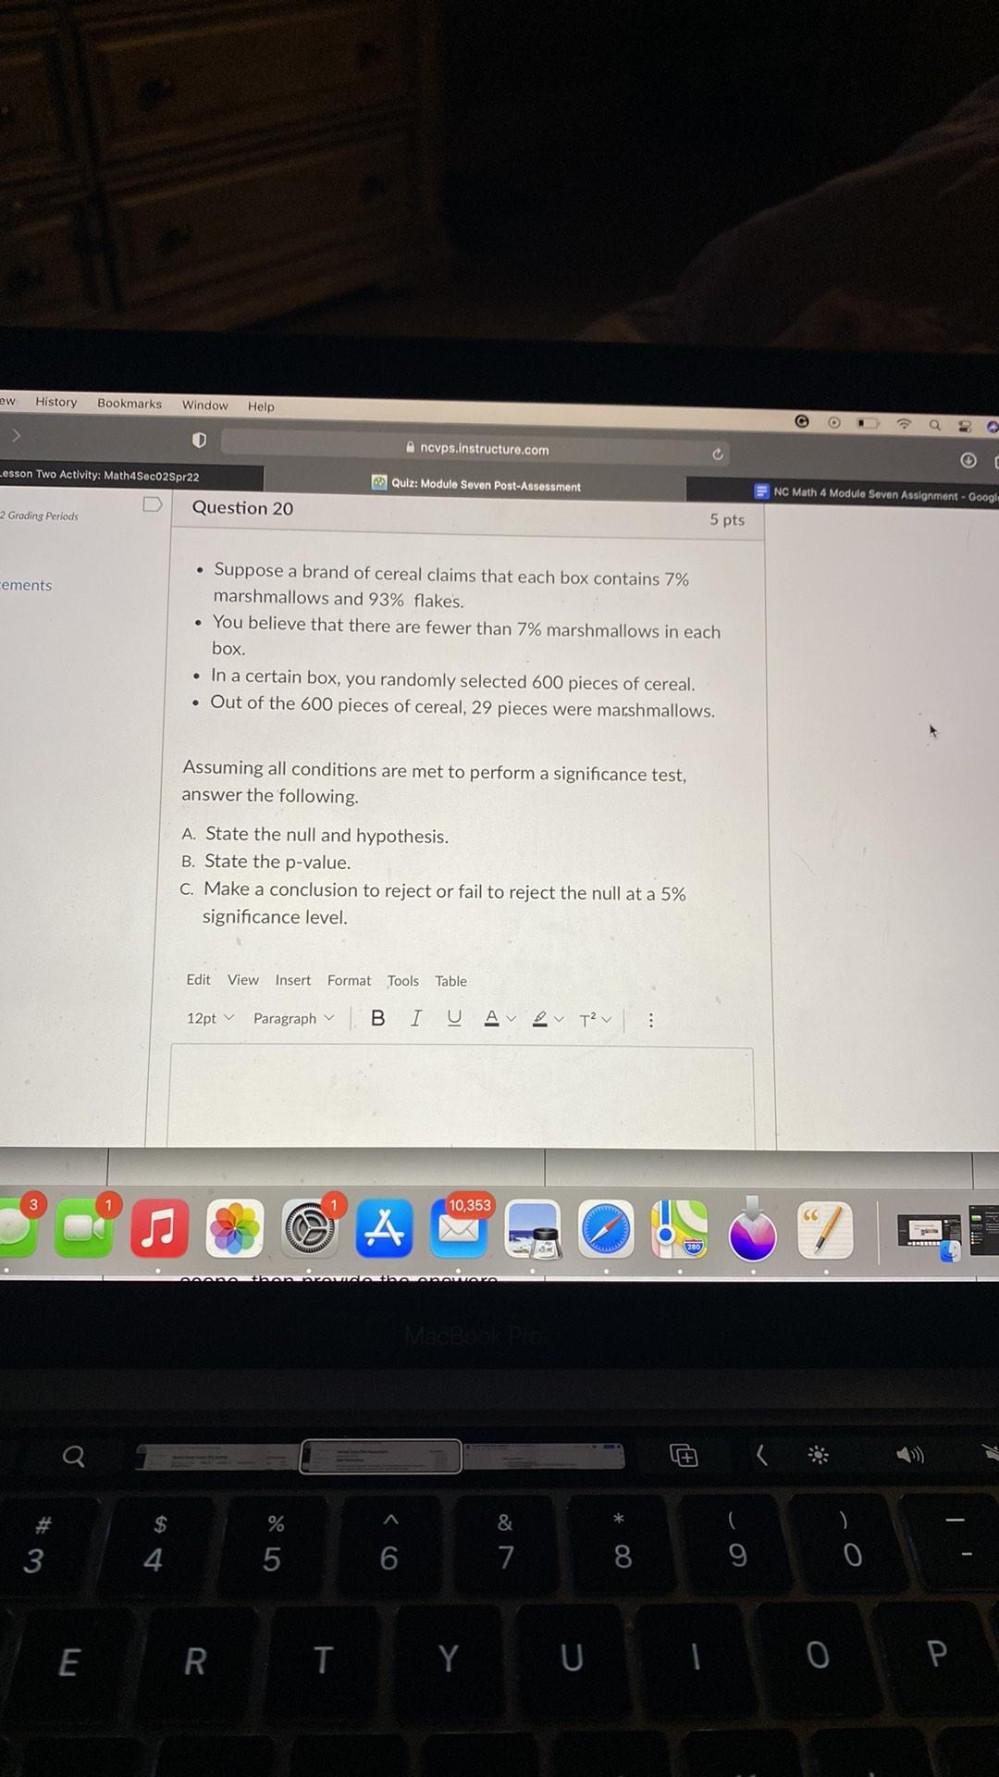
Statistics• Suppose a brand of cereal claims that each box contains 7%
marshmallows and 93% flakes.
• You believe that there are fewer than 7% marshmallows in each box.
• In a certain box, you randomly selected 600 pieces of cereal.
• Out of the 600 pieces of cereal, 29 pieces were marshmallows.
Assuming all conditions are met to perform a significance test,
answer the following.
A State the null and hypothesis.
B State the p-value.
C Make a conclusion to reject or fail to reject the null at a 5%
significance level.
Math
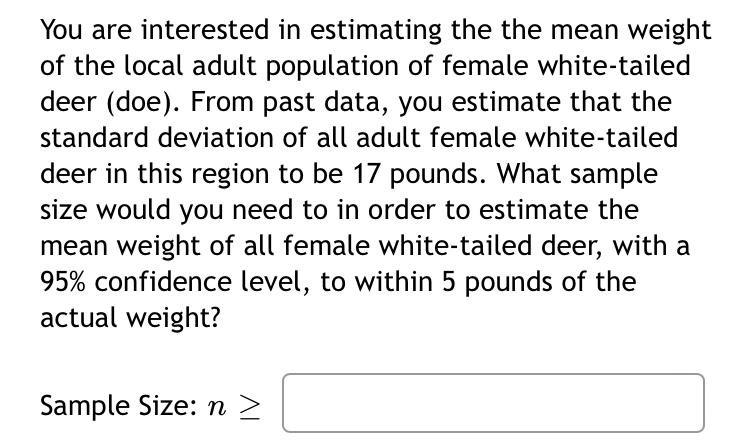
StatisticsYou are interested in estimating the mean weight of the local adult population of female white-tailed deer (doe). From past data, you estimate that the standard deviation of all adult female white-tailed deer in this region to be 17 pounds. What sample size would you need to in order to estimate the mean weight of all female white-tailed deer, with a 95% confidence level, to within 5 pounds of the actual weight?
Sample Size: n≥
Math
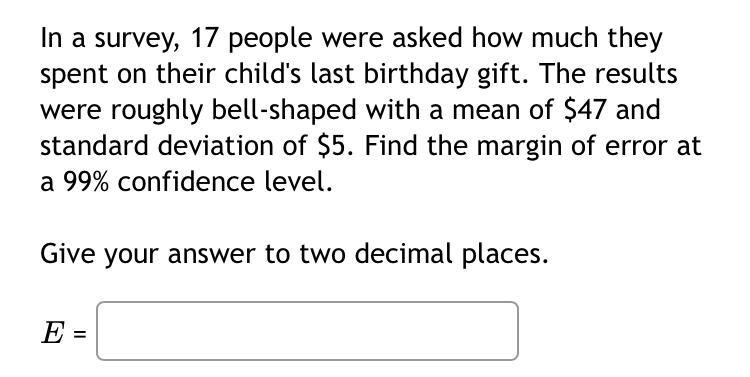
StatisticsIn a survey, 17 people were asked how much they spent on their child's last birthday gift. The results were roughly bell-shaped with a mean of $47 and standard deviation of $5. Find the margin of error at a 99% confidence level.
Math
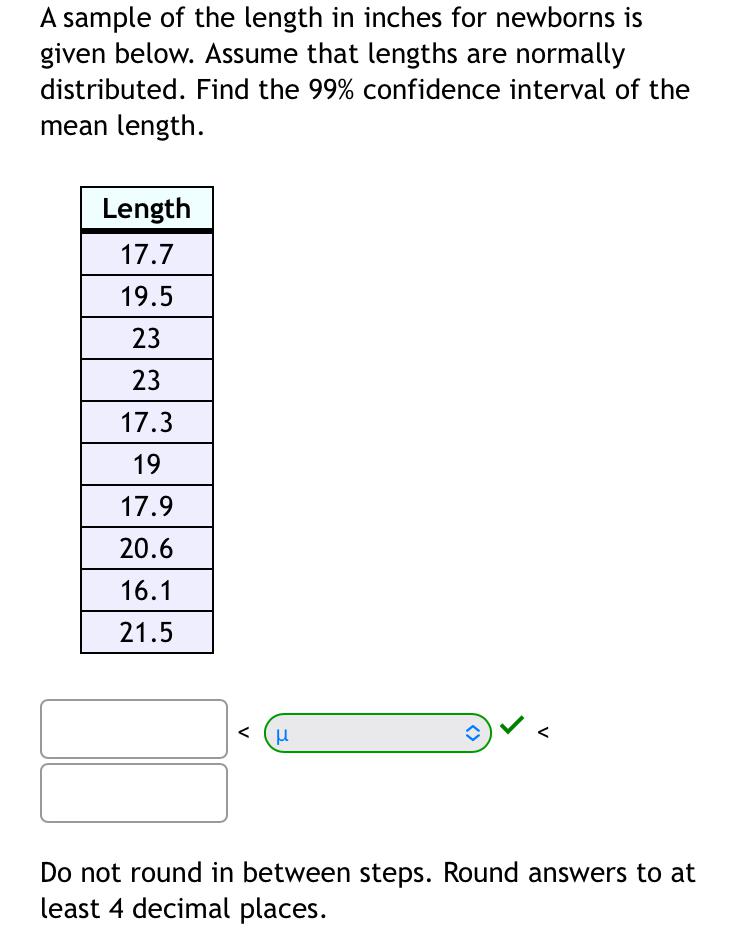
StatisticsA sample of the length in inches for newborns is given below. Assume that lengths are normally distributed. Find the 99% confidence interval of the mean length.
Length
17.7
19.5
23
23
17.3
19
17.9
20.6
16.1
21.5
Do not round in-between steps. Round answers to at least 4 decimal places.
Math
StatisticsSuppose the average height of US men is 70 inches with a standard deviation of 5 inches, and the average height of women is 65 inches with a standard deviation of a 3.5 inches. What is the z-score for your height relative to your gender? What is the meaning of the associated value from the z-table for your z-score?