Statistics Questions and Answers
Math
StatisticsOn page 2, question 2, which scatterplot has a negative direction?
scatterplot 2
scatterplot 3
scatterplot 1
Math
StatisticsHomework: Ch 5
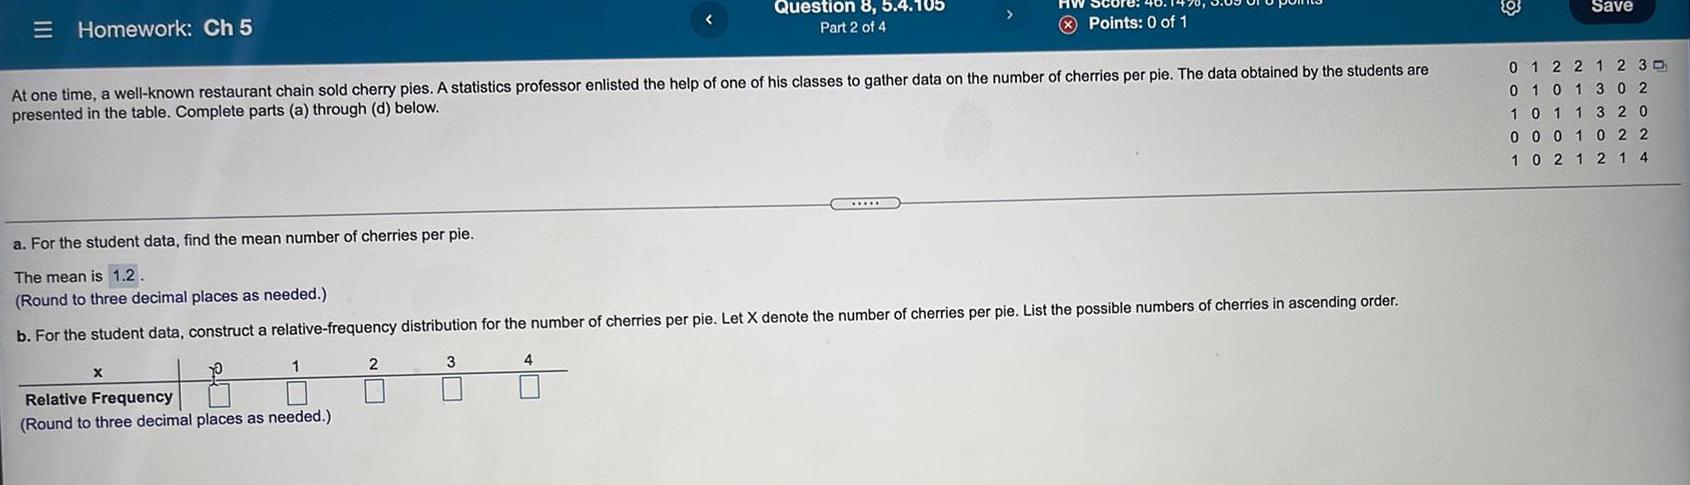
At one time, a well-known restaurant chain sold cherry pies. A statistics professor enlisted the help of one of his classes to gather data on the number of cherries per pie. The data obtained by the students are
presented in the table. Complete parts (a) through (d) below.
X
a. For the student data, find the mean number of cherries per pie.
The mean is 1.2.
(Round to three decimal places as needed.)
b. For the student data, construct a relative-frequency distribution for the number of cherries per pie. Let X denote the number of cherries per pie. List the possible numbers of cherries in ascending order.
1
Relative Frequency
(Round to three decimal places as needed.)
2
Question 8, 5.4.105
Part 2 of 4
3
Points: 0 of 1
4
Save
0 1 2 2 1 2 30
01 01 302
1 0 1 1 3 20
0 0 0 1 0 2 2
102 1 2 1 4
Math
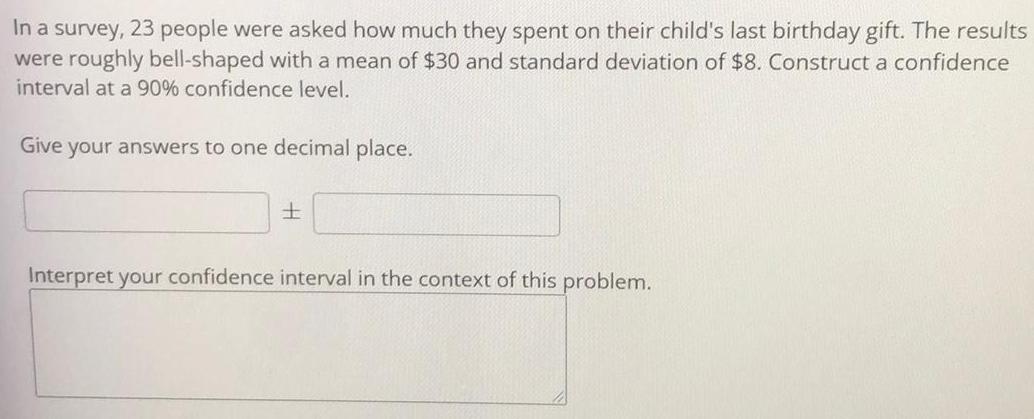
StatisticsIn a survey, 23 people were asked how much they spent on their child's last birthday gift. The results were roughly bell-shaped with a mean of $30 and standard deviation of $8. Construct a confidence interval at a 90% confidence level.
Give your answers to one decimal place.
Interpret your confidence interval in the context of this problem.
Math
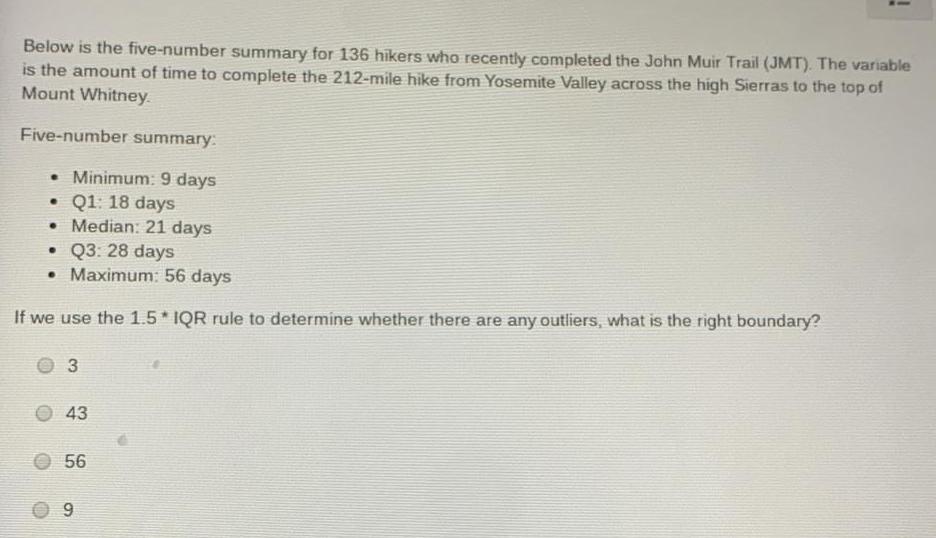
StatisticsBelow is the five-number summary for 136 hikers who recently completed the John Muir Trail (JMT). The variable is the amount of time to complete the 212-mile hike from Yosemite Valley across the high Sierras to the top of Mount Whitney.
Five-number summary:
• Minimum: 9 days
• Q1: 18 days
• Median: 21 days
• Q3: 28 days
•Maximum: 56 days
If we use the 1.5* IQR rule to determine whether there are any outliers, what is the right boundary?
3
43
56
9
Math
StatisticsThe Boston marathon is a very competitive race. To qualify for the Boston marathon, male runners must have completed a marathon in less than 3 hours and 5 minutes within the last year.
Other marathons, such as the Chicago marathon, have no qualifying times. Anyone is able to run this race, even without completing a different marathon earlier in the year.
Consider the groups of runners of each race: Boston marathon runners and Chicago marathon runners. Which group's finishing times for the marathon would most likely have the larger standard deviation?
The Chicago marathon finishing times would more likely have a higher standard deviation than the Boston marathon finishing times.
The Boston marathon finishing times would more likely have a higher standard deviation than the Chicago marathon finishing times.
There is not enough information to predict the relative sizes of their standard deviations.
They would likely have the same standard deviation because many of the same people run both races.
Math
Statistics1. The life expectancy and schooling data for 173 nations relating the response variable y life ex-
pectancy (in years) to the explanatory variable x- mean number of years in school, results in a
regression line that is shown below
y = 56.3166 +1.7078x
The standard error for the slope is 0.1378.
Math
StatisticsIn 2009, DuPont Automotive reported that 18% of cars in North America were white in color.
We are interested in the proportion of white cars in a random sample of 200 cars.
a. What the parameters for this Binomial model?
b. Find the mean and standard deviation of X= the number of white cars in a sample of 200 cars.

Math
StatisticsCadmium, a heavy metal, is toxic to animals. Mushrooms, however, are able to absorb and accumulate cadmium at high concentrations. Some governments have a safety limit for cadmium in dry vegetables at 1.3 parts per million (ppm). A
hypothesis test is to be performed to decide whether the mean cadmium level in a certain mushroom is not equal to the government's recommended limit. Complete parts (a) through (c) below.
( )
a. Determine the null hypothesis.
Hou
ppm
Math
StatisticsPeaches at the local fruit stand have a mean weight of 180 g, with a standard deviation of 17 g.
(a) The center 68% of the peach weights are between which two weights?
(b) 97.5% of all peaches weigh more than what weight? (note that 50% + 47.5% is 97.5 %)?

Math
StatisticsUse a(t)
= -9.8 meters per second per second as the acceleration due to gravity. (Neglect air resistance.)
A canyon is 1200 meters deep at its deepest point. A rock is dropped from the rim above this point. How long will it take the rock
to hit the canyon floor? (Round your answer to one decimal place.)
X sec
Math
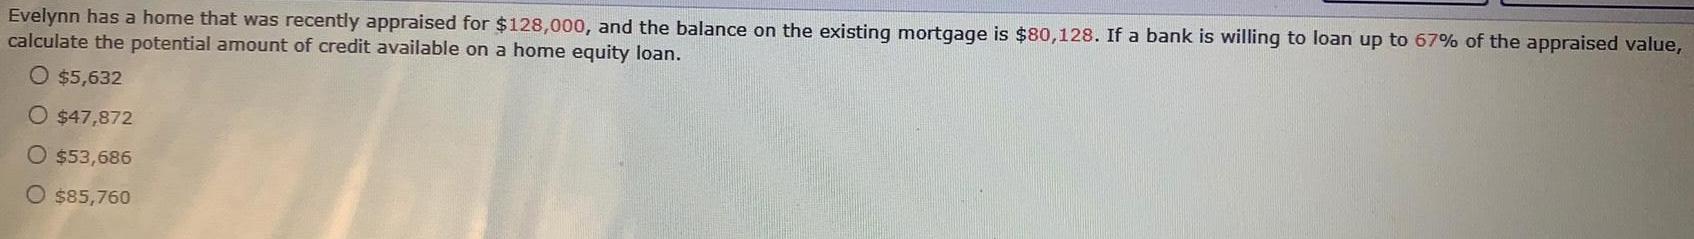
StatisticsEvelynn has a home that was recently appraised for $128,000, and the balance on the existing mortgage is $80,128. If a bank is willing to loan up to 67% of the appraised value,
calculate the potential amount of credit available on a home equity loan.
O $5,632
O $47,872
O $53,686
O $85,760
![Does this diet help? A group of 74 people enrolled in a weight-loss program that involved adhering to a special diet and to a daily exercise program. After six
months, their mean weight loss was 28 pounds, with a sample standard deviation of 9 pounds. A second group of 45 people went on the diet but didn't exercise.
14 pounds, with a sample standard deviation of 6 pounds. Construct a 95% confidence interval for the mean
After six months, their mean weight loss was
difference in weight losses. Let H₁ denote the mean weight loss of the group with daily exercise. Use tables to find the critical value and round the answers to
the nearest integer.
A
95% confidence interval for the difference in the mean difference in weight loss, in pounds, is
] < ₁ = 2₂ < [
X
5](https://media.kunduz.com/media/sug-question/raw/59241768-1657876005.2482061.jpeg?w=256)
Math
StatisticsDoes this diet help? A group of 74 people enrolled in a weight-loss program that involved adhering to a special diet and to a daily exercise program. After six
months, their mean weight loss was 28 pounds, with a sample standard deviation of 9 pounds. A second group of 45 people went on the diet but didn't exercise.
14 pounds, with a sample standard deviation of 6 pounds. Construct a 95% confidence interval for the mean
After six months, their mean weight loss was
difference in weight losses. Let H₁ denote the mean weight loss of the group with daily exercise. Use tables to find the critical value and round the answers to
the nearest integer.
A
95% confidence interval for the difference in the mean difference in weight loss, in pounds, is
] < ₁ = 2₂ < [
X
5
Math
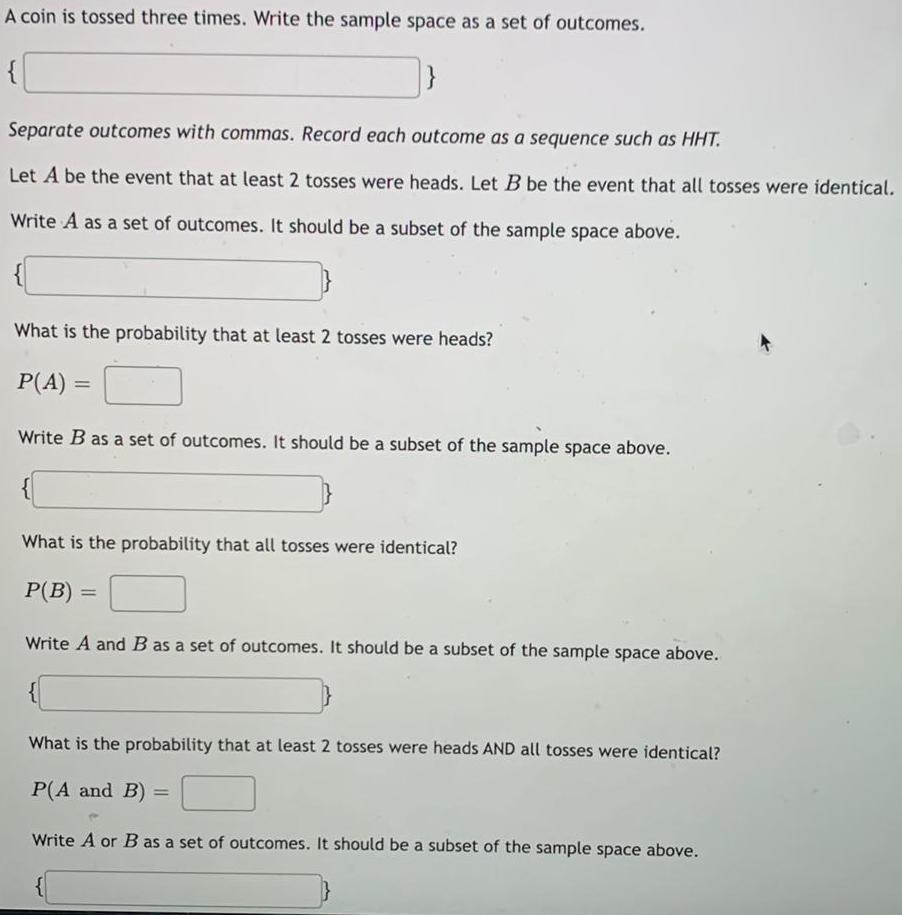
StatisticsA coin is tossed three times. Write the sample space as a set of outcomes.
Separate outcomes with commas. Record each outcome as a sequence such as HHT.
Let A be the event that at least 2 tosses were heads. Let B be the event that all tosses were identical.
Write A as a set of outcomes. It should be a subset of the sample space above.
What is the probability that at least 2 tosses were heads?
Write B as a set of outcomes. It should be a subset of the sample space above.
What is the probability that all tosses were identical?
Write A and B as a set of outcomes. It should be a subset of the sample space above.
What is the probability that at least 2 tosses were heads AND all tosses were identical?
Write A or B as a set of outcomes. It should be a subset of the sample space above.
Math
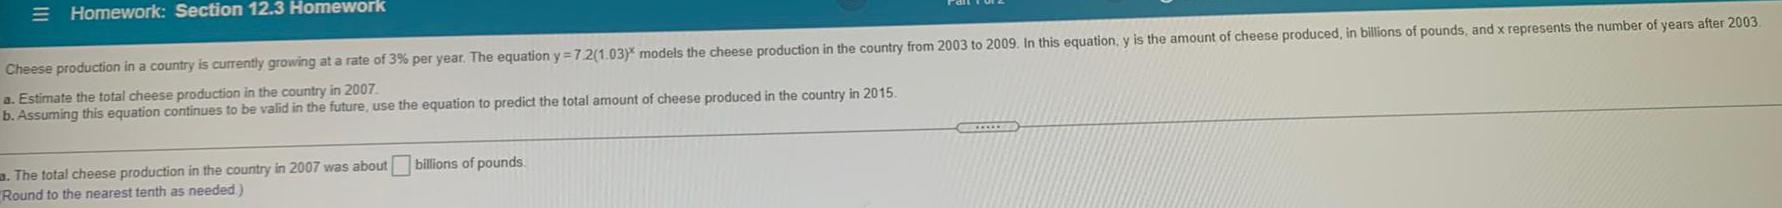
StatisticsCheese production in a country is currently growing at a rate of 3% per year. The equation y=72(1.03)* models the cheese production in the country from 2003 to 2009. In this equation, y is the amount of cheese produced, in billions of pounds, and x represents the number of years after 2003.
a. Estimate the total cheese production in the country in 2007.
b. Assuming this equation continues to be valid in the future, use the equation to predict the total amount of cheese produced in the country in 2015.
a. The total cheese production in the country in 2007 was about billions of pounds. Round to the nearest tenth as needed.)
Math
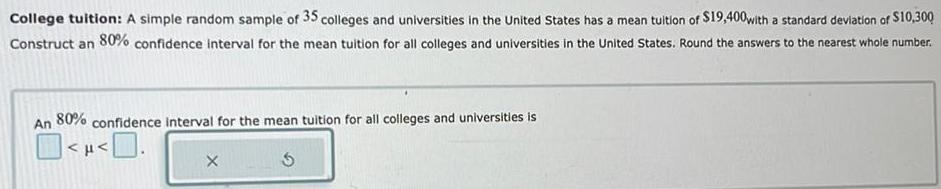
StatisticsCollege tuition: A simple random sample of 35 colleges and universities in the United States has a mean tuition of $19,400 with a standard deviation of Construct an 80% confidence interval for the mean tuition for all colleges and universities in the United States. Round the answers to the nearest whole number.
An 80% confidence interval for the mean tuition for all colleges and universities is
<μ< 0.
Math
StatisticsIn an albatross colony the wingspan of the birds is approximately normally distributed with an average wingspan of 3.07 metres and standard deviation 0.48 metres. In this colony, 75% of the birds have wingspan less than w metres. Find the value of w. Give your answer as a decimal, rounded to two decimal places. Do not include the unit.
Math
StatisticsA company manufactures steel tubes with an average circumference of 12.5 cm. The maximum divergence allowed is 0.15 cm. The circumference of the tubes follow a normal distribution with standard deviation 0.09 cm. What percentage of tubes have an unacceptably large circumference?
Math
StatisticsThe number of sweets in a bag are normally distributed with mean 48 and standard deviation 4. What percentage of bags selected at random contain between 45 and 55 sweets? Give your answer correct to 3 significant figures.
![The lifespan of a mouse is normally distributed with mean 1 year and standard deviation 0.2 years. Ingrid knows that 35% of mice live longer than x years. Find the value of x. Give your answer correct to 3 significant figures. [Answer format: 0.00 years]](https://media.kunduz.com/media/sug-question/raw/59149374-1657832609.5326579.jpeg?w=256)
Math
StatisticsThe lifespan of a mouse is normally distributed with mean 1 year and standard deviation 0.2 years. Ingrid knows that 35% of mice live longer than x years. Find the value of x. Give your answer correct to 3 significant figures. [Answer format: 0.00 years]
Math
StatisticsThe mean monthly rent of students at Oxnard University is $810 with a standard deviation of $235.
(a) John's rent is $1,370. What is his standardized z-score? (Round your answer to 3 decimal places.)
(b) is John's rent an outlier?
O Yes
O No
(c) How high would the rent have to be to qualify as an outlier?
Math
StatisticsThe time to deliver a pizza is normally
distributed with mean 22 minutes and
standard deviation 7 minutes. During 1000
deliveries, in 52 cases the pizzas were
delivered in less than x minutes. Find x. Give
your answer to the nearest integer.
Math
StatisticsThe weight of newborn pigs is normally distributed with mean 1.4 kg and standard deviation 0.3 kg. What is the interquartile range? Give your answer correct to 3 significant figures.
Math
StatisticsUse z scores to compare the given values.
Based on sample data, newborn males have weights with a mean of 3279.8 g and a standard deviation of 617.6 g. Newborn females have weights with a mean of 3045.9 g and a standard deviation of 665.7 g. Who
has the weight that is more extreme relative to the group from which they came: a male who weighs 1700 g or a female who weighs 1700 g?
m
Since the z score for the male is z= and the z score for the female is z = the
(Round to two decimal places.).
has the weight that is more extreme.
![The weights of newborn giraffes are
normally distributed with mean 55 kg and
standard deviation 10 kg.
What percentage of giraffes selected at
random weigh between 50 kg and 60 kg?
Give your answer correct to 3 significant
figures.
[Answer format: 00.0%]](https://media.kunduz.com/media/sug-question/raw/59153711-1657828843.6813936.jpeg?w=256)
Math
StatisticsThe weights of newborn giraffes are
normally distributed with mean 55 kg and
standard deviation 10 kg.
What percentage of giraffes selected at
random weigh between 50 kg and 60 kg?
Give your answer correct to 3 significant
figures.
[Answer format: 00.0%]
Math
StatisticsThe accompanying table provides a probability distribution for the number of major hurricanes, Y, for a randomly selected year between 1851 and 2012. Complete parts (a) through (c) below.
Click the icon to view the distribution of hurricanes.
a. Find and interpret the mean of the random variable.
(Round to three decimal places as needed.)
P=
INCONT
Math
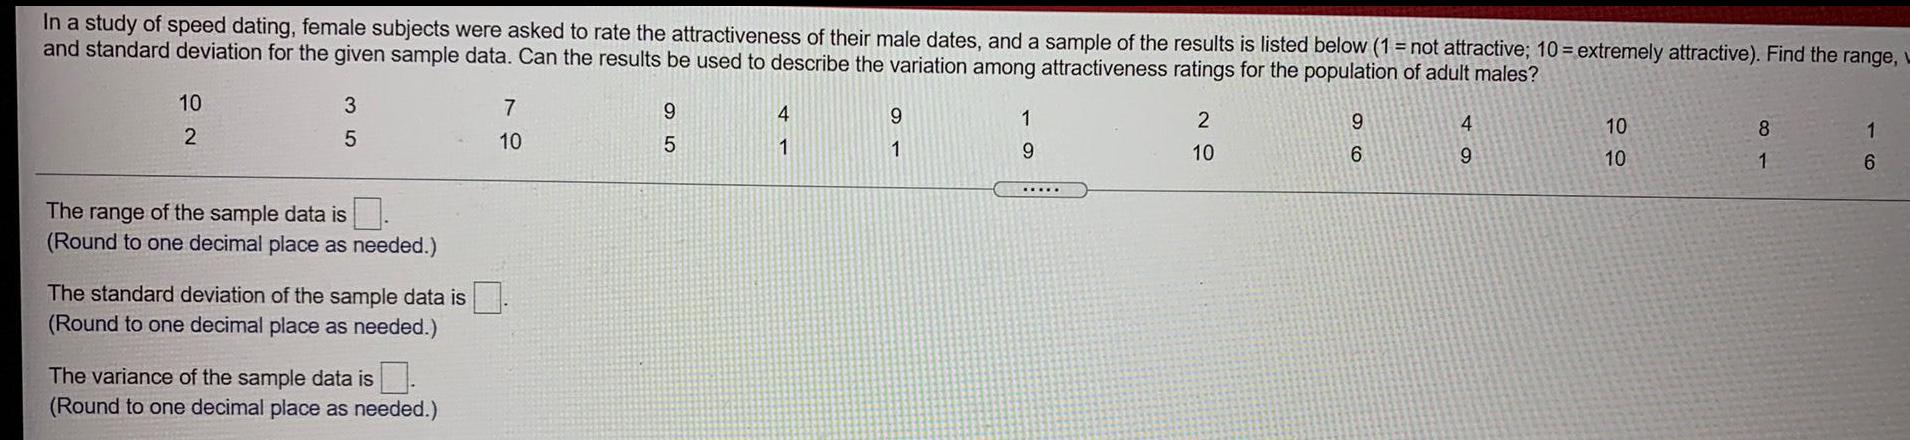
StatisticsIn a study of speed dating, female subjects were asked to rate the attractiveness of their male dates, and a sample of the results is listed below (1= not attractive; 10 = extremely attractive). Find the range, L
and standard deviation for the given sample data. Can the results be used to describe the variation among attractiveness ratings for the population of adult males?
10
2
35
The range of the sample data is
(Round to one decimal place as needed.)
The standard deviation of the sample data is
(Round to one decimal place as needed.)
The variance of the sample data is.
(Round to one decimal place as needed.)
7
10
95
4
1
9
1
1
9
2
10
96
49
10
10
8
1
1
6
Math
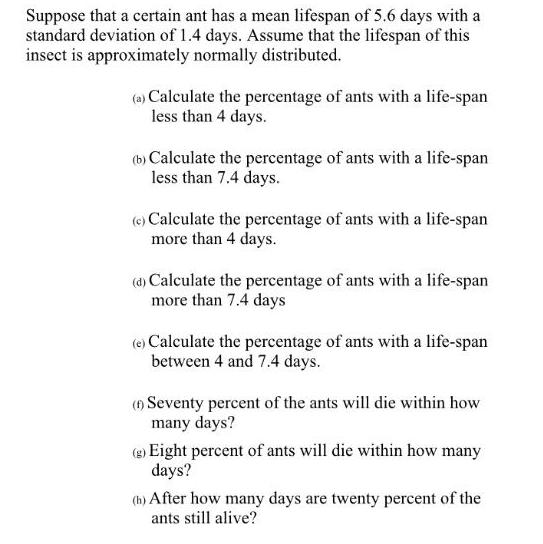
StatisticsSuppose that a certain ant has a mean lifespan of 5.6 days with a
standard deviation of 1.4 days. Assume that the lifespan of this
insect is approximately normally distributed.
(a) Calculate the percentage of ants with a life-span
less than 4 days.
(b) Calculate the percentage of ants with a life-span
less than 7.4 days.
(c) Calculate the percentage of ants with a life-span
more than 4 days.
(d) Calculate the percentage of ants with a life-span
more than 7.4 days
(e) Calculate the percentage of ants with a life-span
between 4 and 7.4 days.
(n) Seventy percent of the ants will die within how
many days?
(g) Eight percent of ants will die within how many
days?
(h) After how many days are twenty percent of the
ants still alive?
Math
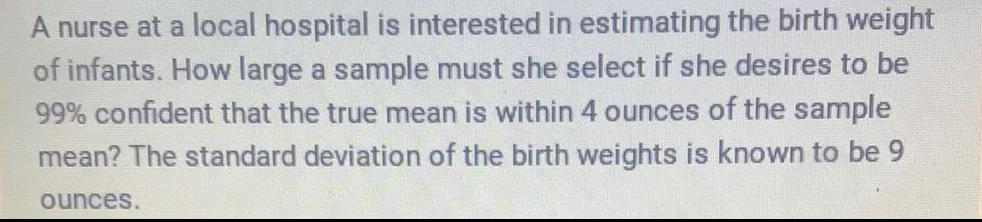
StatisticsA nurse at a local hospital is interested in estimating the birth weight
of infants. How large a sample must she select if she desires to be
99% confident that the true mean is within 4 ounces of the sample
mean? The standard deviation of the birth weights is known to be 9
ounces.
Math
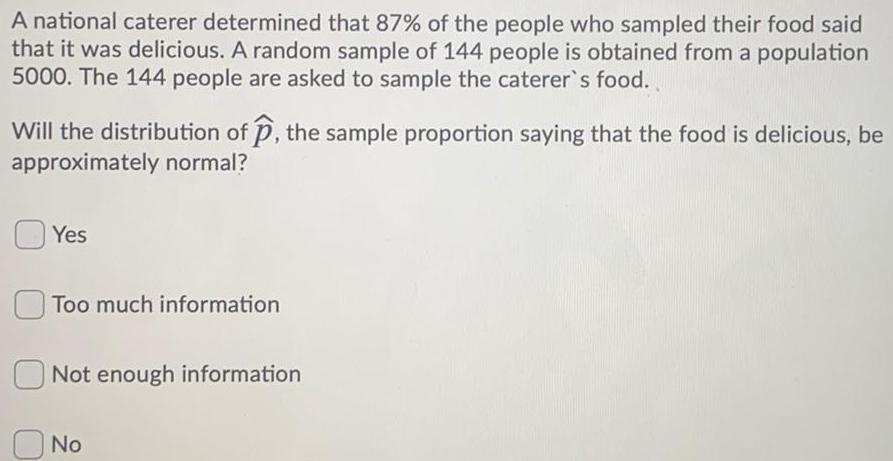
StatisticsA national caterer determined that 87% of the people who sampled their food said
that it was delicious. A random sample of 144 people is obtained from a population
5000. The 144 people are asked to sample the caterer's food.
Will the distribution of p, the sample proportion saying that the food is delicious, be
approximately normal?
Yes
Too much information
Not enough information
No
Math
StatisticsHospital floors: Hospital floors are usually bare tiles instead of carpet. Carpets will decrease noise but might increase germ growth.
To study this, researchers installed carpet in 8 of 16 hospital rooms. They randomly selected the rooms to carpet.
The other rooms had bare tiles.
After two weeks of normal use, they collected air samples from the rooms and counted the bacteria in each sample.
Which of the following is the response variable?
Air samples
Hospital rooms
Type of floor covering
Bacteria count
Math
StatisticsAssume that the heights of men are normally distributed with a mean of 66.9 inches and a standard deviation of 2.1 inches. If 36 men are randomly selected, find the
probability that they have a mean height greater than 67.9 inches.
0.9005
0.0021
0.0210
0.9979
Math
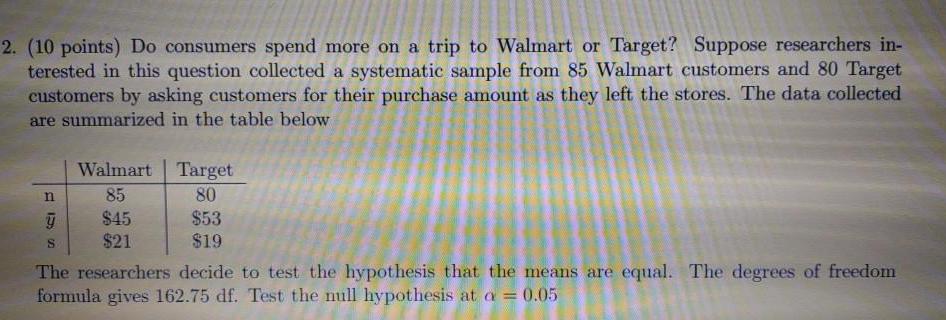
StatisticsDo consumers spend more on a trip to Walmart or Target? Suppose researchers in- terested in this question collected a systematic sample from 85 Walmart customers and 80 Target customers by asking customers for their purchase amount as they left the stores. The data collected are summarized in the table below.
The researchers decide to test the hypothesis that the means are equal. The degrees of freedom formula gives 162.75 df. Test the null hypothesis at a = 0.05
Math
StatisticsSuppose a population has a mean of 7 for some characteristic of interest and a standard deviation of 9.6. A sample is drawn from this population of size 64. What is the standard error of the mean?
0.15
3.3
0.7
1.2
Math
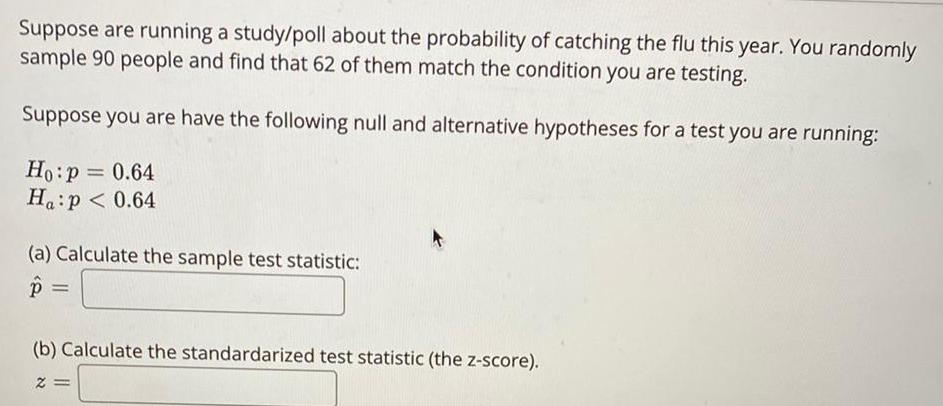
StatisticsSuppose are running a study/poll about the probability of catching the flu this year. You randomly sample 90 people and find that 62 of them match the condition you are testing. Suppose you are have the following null and alternative hypotheses for a test you are running:
Ho p = 0.64
Ha p < 0.64
(a) Calculate the sample test statistic: p =
(b) Calculate the standardarized test statistic (the z-score). z =
Math
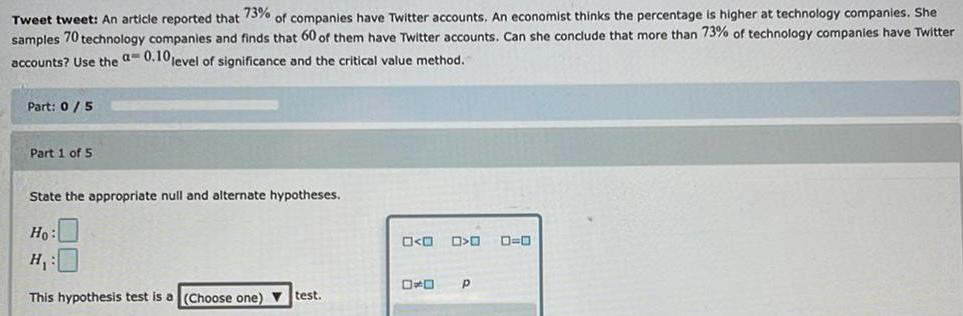
StatisticsTweet tweet: An article reported that 73% of companies have Twitter accounts. An economist thinks the percentage is higher at technology companies. She samples 70 technology companies and finds that 60 of them have Twitter accounts. Can she conclude that more than 73% of technology companies have Twitter accounts? Use the am 0.10 level of significance and the critical value method.
Math
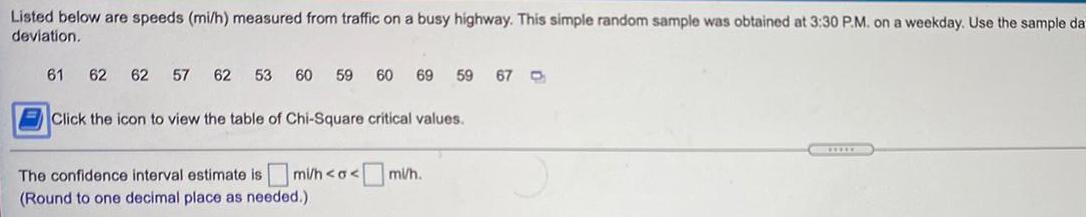
StatisticsListed below are speeds (mi/h) measured from traffic on a busy highway. This simple random sample was obtained at 3:30 P.M. on a weekday. Use the sample da deviation.
61 62 62 57 62 53 60 59 60 69 59 67
Math
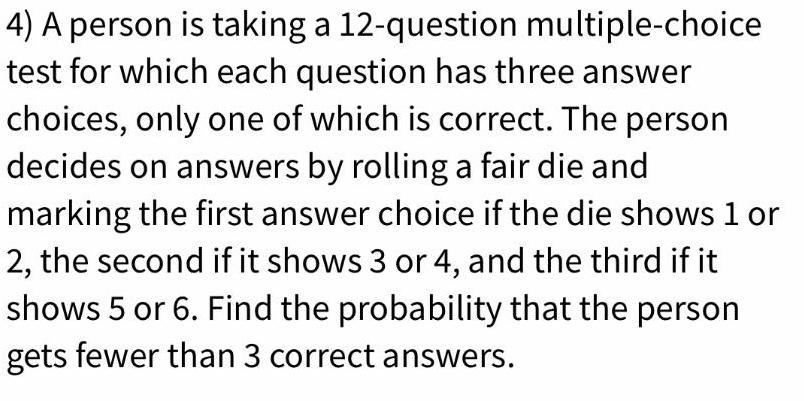
Statistics4) A person is taking a 12-question multiple-choice
test for which each question has three answer
choices, only one of which is correct. The person
decides on answers by rolling a fair die and
marking the first answer choice if the die shows 1 or
2, the second if it shows 3 or 4, and the third if it
shows 5 or 6. Find the probability that the person
gets fewer than 3 correct answers.
Math
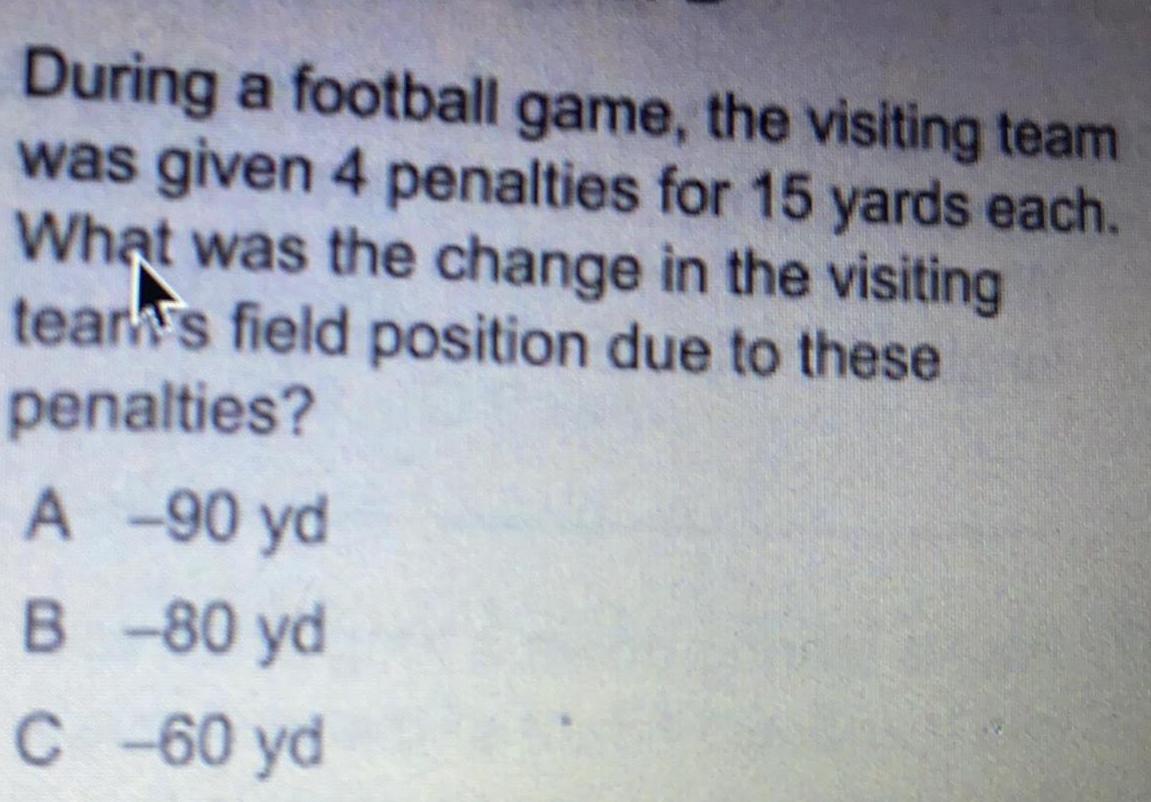
StatisticsDuring a football game, the visiting team was given 4 penalties for 15 yards each. What was the change in the visiting tear's field position due to these penalties?
A -90 yd
B -80 yd
C -60 yd
Math
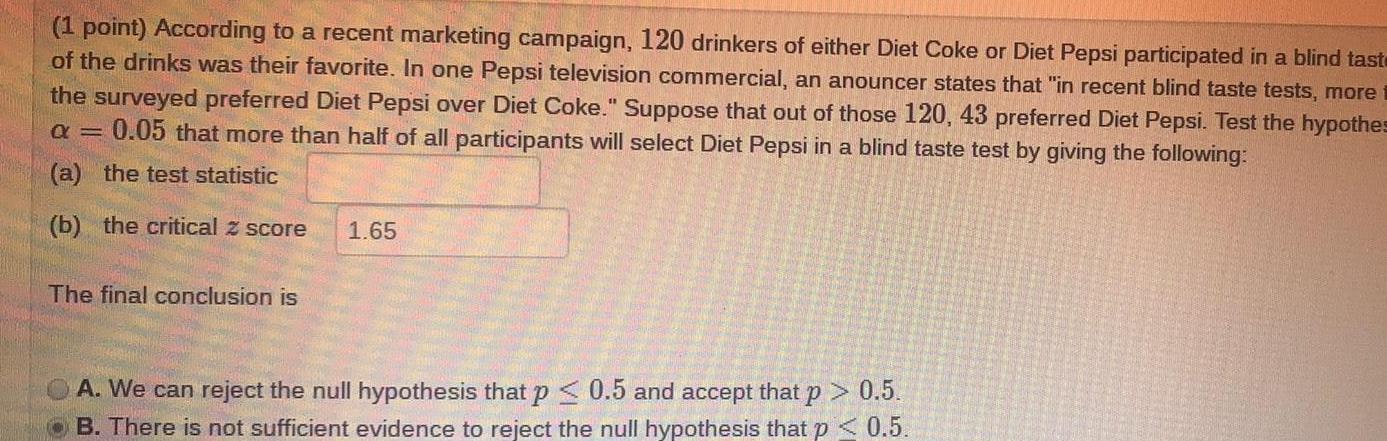
Statistics(1 point) According to a recent marketing campaign, 120 drinkers of either Diet Coke or Diet Pepsi participated in a blind taste
of the drinks was their favorite. In one Pepsi television commercial, an anouncer states that "in recent blind taste tests, more
the surveyed preferred Diet Pepsi over Diet Coke." Suppose that out of those 120, 43 preferred Diet Pepsi. Test the hypothes
a = 0.05 that more than half of all participants will select Diet Pepsi in a blind taste test by giving the following:
(a) the test statistic
(b) the critical z score
The final conclusion is
1.65
A. We can reject the null hypothesis that p ≤ 0.5 and accept that p > 0.5.
B. There is not sufficient evidence to reject the null hypothesis that p < 0.5.
Math
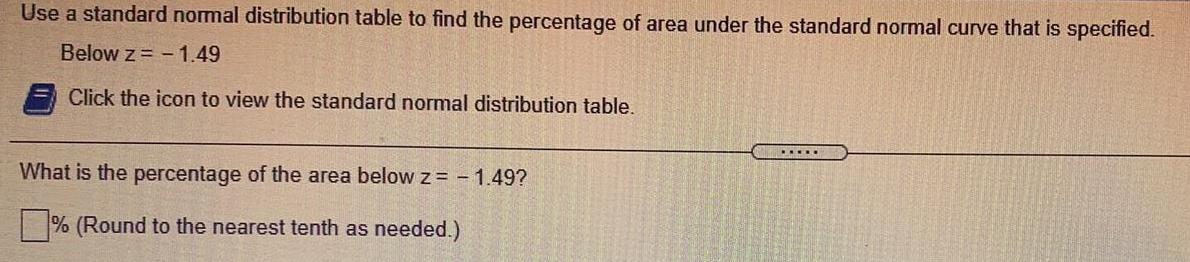
StatisticsUse a standard normal distribution table to find the percentage of area under the standard normal curve that is specified.
Below z = -1.49
Click the icon to view the standard normal distribution table.
What is the percentage of the area below z = -1.49?
% (Round to the nearest tenth as needed.)
.....
Math
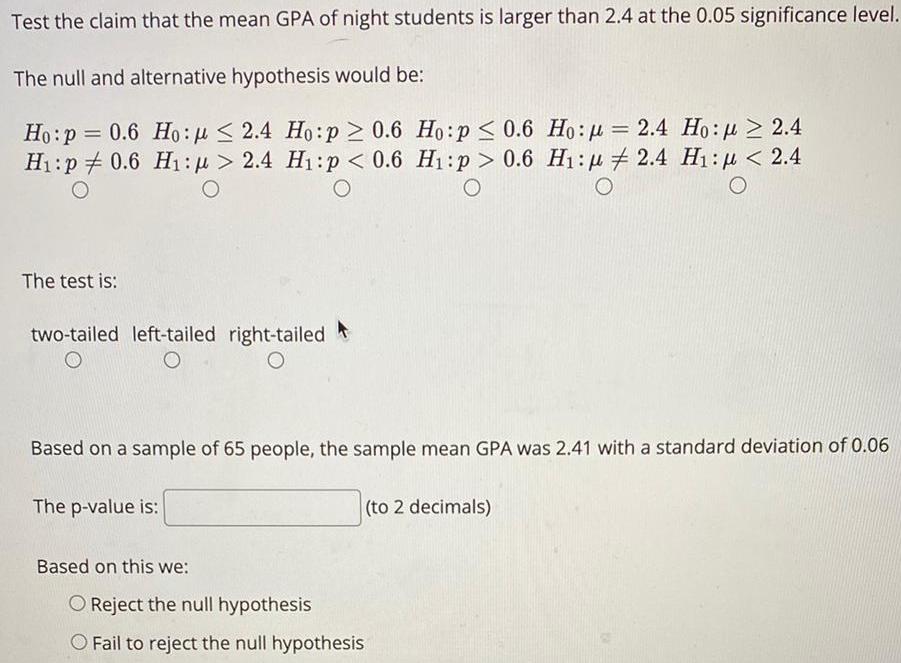
StatisticsTest the claim that the mean GPA of night students is larger than 2.4 at the 0.05 significance level.
The null and alternative hypothesis would be:
Ho:p= 0.6 Ho: ≤ 2.4 Ho:p> 0.6
H₁:p 0.6 H₁: > 2.4 H₁:p < 0.6
O
The test is:
two-tailed left-tailed right-tailed
The p-value is:
Based on a sample of 65 people, the sample mean GPA was 2.41 with a standard deviation of 0.06
Based on this we:
Ho:p ≤ 0.6 Ho: 2.4 Ho:μ ≥ 2.4
H₁:p> 0.6 H₁:
O
2.4 H₁:μ< 2.4
O
O
(to 2 decimals)
O Reject the null hypothesis
O Fail to reject the null hypothesis
=
Math
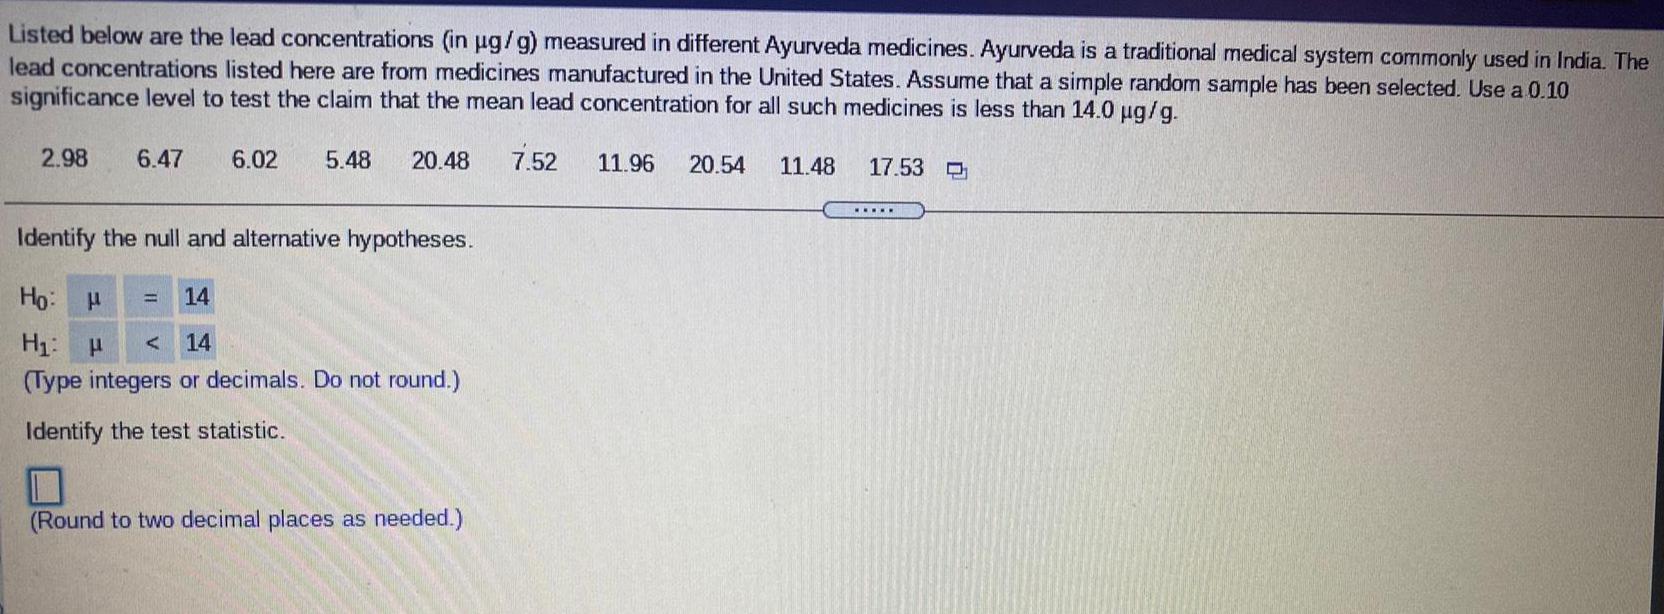
StatisticsListed below are the lead concentrations (in µg/g) measured in different Ayurveda medicines. Ayurveda is a traditional medical system commonly used in India. The lead concentrations listed here are from medicines manufactured in the United States. Assume that a simple random sample has been selected. Use a 0.10 significance level to test the claim that the mean lead concentration for all such medicines is less than 14.0 µg/g.
2.98 6.47 6.02 5.48 20.48 7.52 11.96 20.54 11.48 17.53
Math
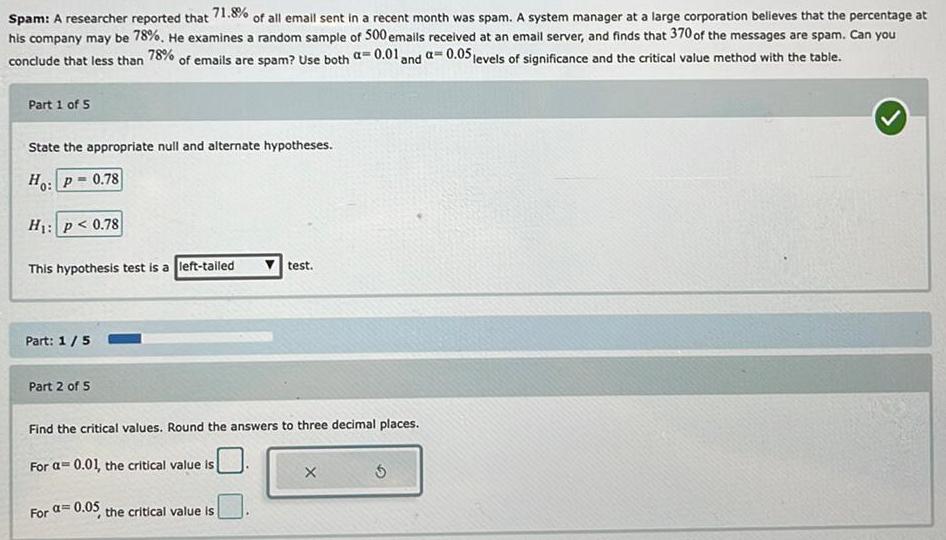
StatisticsSpam: A researcher reported that 71.8% of all email sent in a recent month was spam. A system manager at a large corporation believes that the percentage at
his company may be 78%. He examines a random sample of 500 emails received at an email server, and finds that 370 of the messages are spam. Can you
a= 0.05 levels of significance and the critical value method with the table.
78%
conclude that less than of emails are spam? Use both a 0.01
and
Part 1 of 5
State the appropriate null and alternate hypotheses.
Ho: p= 0.78
H₁: p< 0.78
This hypothesis test is a left-tailed
Part: 1 / 5
Part 2 of 5
test.
Find the critical values. Round the answers to three decimal places.
For a= 0.01, the critical value is
For a= 0.05, the critical value is
X
5
Math
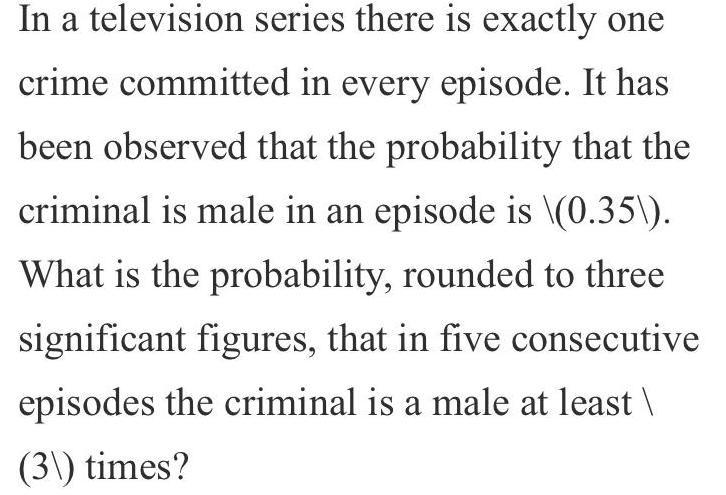
StatisticsIn a television series there is exactly one
crime committed in every episode. It has
been observed that the probability that the
criminal is male in an episode is \(0.35\).
What is the probability, rounded to three
significant figures, that in five consecutive
episodes the criminal is a male at least \
(3\) times?
Math
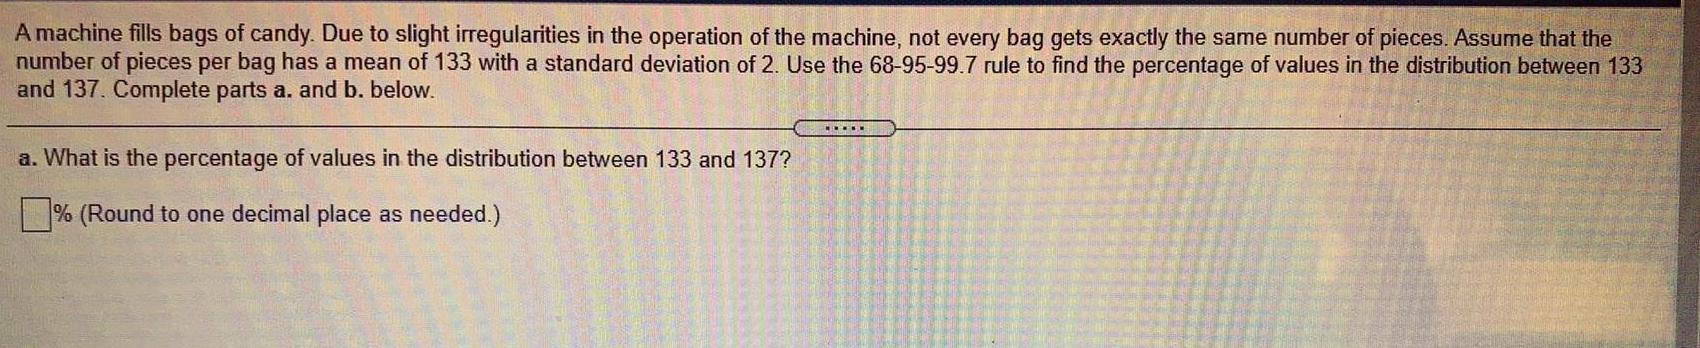
StatisticsA machine fills bags of candy. Due to slight irregularities in the operation of the machine, not every bag gets exactly the same number of pieces. Assume that the
number of pieces per bag has a mean of 133 with a standard deviation of 2. Use the 68-95-99.7 rule to find the percentage of values in the distribution between 133
and 137. Complete parts a. and b. below.
a. What is the percentage of values in the distribution between 133 and 137?
% (Round to one decimal place as needed.)

Math
StatisticsA poll is given, showing 80% are in favor of a new building project.
If 8 people are chosen at random, what is the probability that exactly 1 of them favor the new
building project? Round your answer to 4 decimal places (e.g. 0.0001).
Hint: Use technology such as Binomial Calculator.
Math
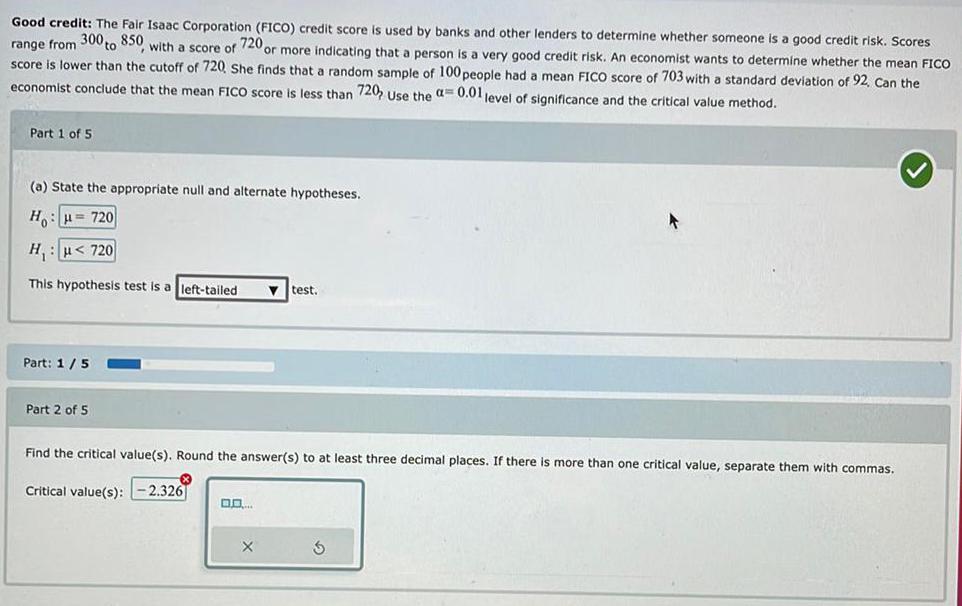
StatisticsGood credit: The Fair Isaac Corporation (FICO) credit score used by banks and other lenders to determine whether someone is a good credit risk. Scores
range from 300 to 850, with a score of 720 or more indicating that a person is a very good credit risk. An economist wants to determine whether the mean FICO
score is lower than the cutoff of 720, She finds that a random sample of 100 people had a mean FICO score of 703 with a standard deviation of 92, Can the
economist conclude that the mean FICO score is less than 720, Use the a= 0.01 level of significance and the critical value method.
Part 1 of 5
(a) State the appropriate null and alternate hypotheses.
Ho:μ= 720
H₁: μ< 720
This hypothesis test is a left-tailed Y test
Part 2 of 5
Find the critical value(s). Round the answer(s) to at least three decimal places. If there more
Critical value(s): -2.326
DO.....
S
one critical value, separate them with commas.
Math
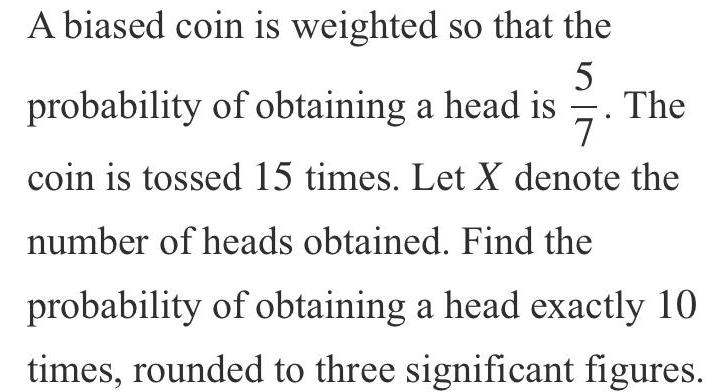
StatisticsA biased coin is weighted so that the probability of obtaining a head is 5/7. The coin is tossed 15 times. Let X denote the number of heads obtained. Find the probability of obtaining a head exactly 10 times, rounded to three significant figures.

Math
StatisticsIn a multiple choice test, there are 10 questions. Each question has 4 choices, one of which is correct. Tom, who knows nothing about the subject, guesses each answer at random. Let \(X) be the number of questions that Tom has actually guessed correctly. Find the mean and standard deviation of the \(X\)- distribution.

Math
Statistics2% of a group of toys are defective. A random sample of 100 toys is chosen from the group. Let \(X) be the number of defective toys in the sample. Find the mean and standard deviation of the \ (X\)distribution.