Statistics Questions and Answers

Math
StatisticsFor a standard normal distribution, find:
P(Z > c) = 0.3365
Find c.
Round your answer to 3 decimal places (e.g. 0.001).
Hint: Use technology such as Normal Curve Calculator.

Math
StatisticsA manufacturing machine has a 1% defect rate.
If 3 items are chosen at random, what is the probability that at least one will have a defect?
Round your answer to 4 decimal places (e.g. 0.0001).
Hint: Use technology such as Binomial Calculator.

Math
StatisticsFor a standard normal distribution, given:
P(Z < c) = 0.6645
Find c.
Round your answer to 3 decimal places (e.g. 0.001).

Math
StatisticsSuppose your manager indicates that for a normally distributed data set you are analyzing, your company wants data points between z = 1.4 and z= 1.4 standard deviations of the mean (or within 1.4 standard deviations of the mean). What percent of the data points will fall in that range?

Math
StatisticsA poll of 1018 teens aged 13 to 17 showed that 56% of them have made new friends online. Use a 0.05 significance level to test the claim that half of all teens have made new friends online. Use the P-value method. Use the normal distribution as an approximation to the binomial distribution.

Math
StatisticsA particular brand of laptop was sampled with regard to the time it can be used before it requires recharging. The mean time was calculated to be 7.6 hours with a standard deviation of 1.99 hours. Calculate the coefficient of variation for this example.

Math
StatisticsIntelligence Quotient (IQ) scores are often reported to be normally distributed with = 100.0 and 15.0. A random sample of 35 people is taken. Step 1 of 2: What is the probability of a random person on the street having an IQ score of less than 967 Round your answer to 4 decimal places, if necessary.

Math
StatisticsIn the video, we found the area under the curve that lies in the region between two z-scores. Which of the following statements is NOT true?
Choose the correct answer below.
OA. The z-score table gives us the area under the curve to the right of the z-score.
OB. The area under the curve between z = 1.5 and z=2.1 was 4.89%.
OC. We found the area under the curve from z = 0 to z= 2.1 to be 0.4821.
OD. Using the z-score table, looking up z = 1.5 gave us 0.4332.

Math
StatisticsTed is not particularly creative. He uses the pickup line "If I could
rearrange the alphabet, I'd put U and I together." The random variable x is
the number of women Ted approaches before encountering one who
reacts positively. Determine whether a probability distribution is given. If a
probability distribution is given, find its mean and standard deviation. If a
probability distribution is not given, identify the requirements that are not
satisfied.
X
0
1
2
3
OA. μ= women (Round to one decimal place as needed.)
OB. The table does not show a probability distribution.
P(x)
0.001
0.008
0.035
0.056
▪▪▪▪▪
Does the table show a probability distribution? Select all that apply.
A. Yes, the table shows a probability distribution.
B. No, the sum of all the probabilities is not equal to 1.
C. No, the random variable x is categorical instead of numerical.
D. No, not every probability is between 0 and 1 inclusive.
E. No, the random variable x's number values are not associated with probabilities.
Find the mean of the random variable x. Select the correct choice below and, if necessary, fill in the answer box to complete your
choic

Math
StatisticsA population of values has a normal distribution with u 219.4 and σ = 27.2. You intend to draw
a random sample of size n = 19.
Find the probability that a single randomly selected value is less than 206.9.
Find the probability that a sample of size n = 19 is randomly selected with a mean less than 206.9.
Enter your answers as numbers accurate to 4 decimal places. Answers obtained using exact z-scores or z-scores rounded to 3 decimal places are accepted.

Math
StatisticsEngineers must consider the breadths of male heads when designing helmets. The company
researchers have determined that the population of potential clientele have head breadths that are normally distributed with a mean of 5.8-in and a standard deviation of 1.2-in.
In what range would you expect to find the middle 50% of most head breadths?
Between
and
If you were to draw samples of size 45 from this population, in what range would you expect to find the middle 50% of most averages for the breadths of male heads in the sample?
Between and
Enter your answers as numbers. Your answers should be accurate to 2 decimal places.

Math
StatisticsIn 1948, the baseball player Frankie Fleetfoot hit 0.365. In the 1940s the mean batting average was 0.264 and the standard deviation was 0.0331. In 1977, Sam Slugger hit 0.340. In the 1970s the mean batting average was 0.257 and the standard deviation was 0.0312. Determine which batting average was more impressive.
(Assume that the batting averages were normally distributed in both decades.)
![If a company spends million dollars on research, it sales will be s million dollars, where r and s are related by s² = 3³ – 55.
(a) Find ds/dr by implicit differentiation and evaluate it at r = 4, s = 3. [Hint: Differentiate the equation with respect to r.]
ds/dr=
(b) Find dr/ds by implicit differentiation and evaluate it at r = 4, s = 3. [Hint: Differentiate the original equation with respect to s.]
dr/ds=
(c) Interpret your answer to part (a) as a rate of change.
Given ds/dr = n, this means that the rate of change of sales with respect to research expenditures is n, so that increasing research by one million dollars will increase sales by
about n million dollars (at these levels of r and s).
Given ds/dr = n, this means that the rate of change of research expenditures with respect to sales is n, so that increasing sales by one million dollars will increase research by
about n million dollars (at these levels r and s).
Changing research will not affect sales.
Interpret your answer to part (b) as a rate of change.
Changing sales will not affect res
Given dr/ds=m, this means that the rate of change of sales with respect to research expenditures is n, so that increasing research by one million dollars will increase sales by
about m million dollars (at these levels of r and s).
Given dr/ds=m, this means that the rate of change of research expenditures with respect to sales is m, so that increasing sales by one million dollars will increase research
by about m million dollars (at these levels of r and s).](https://media.kunduz.com/media/sug-question/raw/58682464-1657742409.4690864.jpeg?w=256)
Math
StatisticsIf a company spends million dollars on research, it sales will be s million dollars, where r and s are related by s² = 3³ – 55.
(a) Find ds/dr by implicit differentiation and evaluate it at r = 4, s = 3. [Hint: Differentiate the equation with respect to r.]
ds/dr=
(b) Find dr/ds by implicit differentiation and evaluate it at r = 4, s = 3. [Hint: Differentiate the original equation with respect to s.]
dr/ds=
(c) Interpret your answer to part (a) as a rate of change.
Given ds/dr = n, this means that the rate of change of sales with respect to research expenditures is n, so that increasing research by one million dollars will increase sales by
about n million dollars (at these levels of r and s).
Given ds/dr = n, this means that the rate of change of research expenditures with respect to sales is n, so that increasing sales by one million dollars will increase research by
about n million dollars (at these levels r and s).
Changing research will not affect sales.
Interpret your answer to part (b) as a rate of change.
Changing sales will not affect res
Given dr/ds=m, this means that the rate of change of sales with respect to research expenditures is n, so that increasing research by one million dollars will increase sales by
about m million dollars (at these levels of r and s).
Given dr/ds=m, this means that the rate of change of research expenditures with respect to sales is m, so that increasing sales by one million dollars will increase research
by about m million dollars (at these levels of r and s).

Math
StatisticsA normal distribution has a mean of 18 and a standard deviation of 5. Use the 68-95-99.7 rule to find the percentage of values in the distribution between 18 and 23.

Math
StatisticsConsider the probability distribution of X, where X is the number of times a college graduate changed majors.
We collect a random sample of 1000 college graduates. Based on the probability distribution, which result would
be surprising?
280 students in the sample changed majors once.
130 students in the sample never changed majors.
400 students in the sample changed majors twice.

Math
StatisticsAssume that a normal distribution of data has a mean of 20 and a standard deviation of 2. Use the 68-95-99.7 rule to find the percentage of values that lie below 22.
What percentage of values lie below 22?
% (Type an integer or a decimal.)

Math
Statistics9 of 14
Suppose we have a large group of cattle and record their weights. We then make probability histograms with the
data in the following two ways:
Method 1: With 100 bins for our histogram.(0.1 lb)
Method 2: With 1000 bins for our histogram.
Which of the resulting probability histograms will fit a curve most closely?
Method 2
Method 1

Math
StatisticsTandonny selects s
groups
CG,
and the random variable x is the number in the group who say that the
most fun way to flirt is in person. Determine whether a probability
distribution is given. If a probability distribution is given, find its mean and
standard deviation. If a probability distribution is not given, identify the
requirements that are not satisfied.
X
0
1
OA. μ = adult(s) (Round to one decimal place as needed.)
OB. The table does not show a probability distribution.
2
3
0.087
0.343
0.415
0.155
Does the table show a probability distribution? Select all that apply.
A. Yes, the table ows a probability distribution.
B. No, the random variable x is categorical instead of numerical.
C. No, not every probability is between 0 and 1 inclusive.
D. No, the sum of all the probabilities is not equal to 1.
E. No, the random variable x's number values are not associated with probabilities.
Find the mean of the random variable x. Select the correct choice below and, if necessary, fill in the answer box to complete your choice.

Math
StatisticsUnder his cell phone plan, Noah pays a flat cost of $66.50 per month and $4 per
gigabyte. He wants to keep his bill under $80 per month. Which inequality can be
used to determine g, the maximum number of gigabytes Noah can use while staying
within his budget?

Math
StatisticsIn a survey of men in the United States (ages 20 to 29), the mean height was 69.9 inches with a standard deviation of 3.0 inches. Assume the height data is normally distributed. Zak's height has a z-score of -1.7. Which one of the following statements is true?
Zak is shorter than 65 inches.
Zak is taller than 72.9 inches.
Zak's height is in the lower 2.5% of men's heights (ages 20 to 29).

Math
StatisticsIn a survey of 2035 workers, 73% reported working out 3 or more days a week. What is the margin of error? What is the interval that is likely to contain the exact percent of all people who work out 3 or more days a week? Show all work.

Math
StatisticsA company produces steel rods. The lengths of the steel rods are normally distributed with a mean
of 209.3-cm and a standard deviation of 2.4-cm. For shipment, 28 steel rods are bundled together.
Find the probability that the average length of a randomly selected bundle of steel rods is greater
than 209.4-cm.
P(M>209.4-cm) =
Enter your answer as a number accurate to 4 decimal places. Answers obtained using exact z-scores or z-scores rounded to 3 decimal places are accepted.

Math
StatisticsDetermine the range, mean, and standard deviation of the data set.
(5, 10, 5, 17, 17, 9, 13, 14)
The range is
(Type a whole number.)
The mean is
(Type an integer or decimal rounded to three decimal places as needed.)
The standard deviation is
(Round the final answer to two decimal places as needed. Round all intermediate values to three decimal places as needed.)

Math
StatisticsWhat is wrong the following conclusion? All students in North Carolina
should take an online SAT course in order to help improve their score. This
conclusion came from students at Mathville High school. All students at
Mathville High school in North Carolina took an online SAT prep course.
Their average increase in test scores after the course was 200 points.
The conclusion cannot be trusted since offical scientists did not administer the online course.
The conclusion should have been made for the entire United States not just the students in
North Carolina.
Their scores did not improve enough to say there was a difference.
The sample was not a simple random sample.

Math
StatisticsOn March 10, 2020, nine NBA games were played. The average
number of points scored in those games was 226, with a sample
variance of 122.5.
Assuming that the underlying distribution of the data is normal and
that these observations are independent and identically distributed,
construct a 90% confidence interval for the true mean number of
points of an NBA game.

Math
StatisticsThe combined SAT scores for the students at a local high school are normally distributed with a mean of 1545 and a standard deviation of 300. The local college includes a minimum score of 2205 in its admission requirements. What percentage of students from this school earn scores that satisfy the admission requirement? P(X> 2205) = %

Math
StatisticsArcheologists have studied sizes of Egyptian skulls in an attempt to determine whether breeding occurred between different cultures. Listed below are the widths (mm) of skulls from 150 A.D. Construct a 90% confidence interval estimate of the mean skull width.
127.6 137.8 125.9 131.8 143.1 134.9 138.8 128.9

Math
StatisticsAnthony wants to repay the loan his parents gave him in three years. How much does he
need to deposit into an account semi-annually that pays 3.25% interest twice a year in order
to have $35,000 to repay the loan?

Math
StatisticsNext
A manufacturer knows that their items nave a lengths that are skewed right, with a mean of 18.1
inches, and standard deviation of 1.3 inches.
If 34 items are chosen at random, what is the probability that their mean length is greater than 18.6
inches?
(Round answer to four decimal places)

Math
StatisticsA population has parameters μ = 94.2 and a = 74.7. You intend to draw a random sample of size
n= 146.
What is the mean of the distribution of sample means?
Pa =
What is the standard deviation of the distribution of sample means?
(Report answer accurate to 2 decimal places.)
0 =

Math
StatisticsBelow is a list of the salaries for the starting lineup of the local pro baseball team.
Pitcher: $1,100,000
Catcher: $1,800,000
Infield: $495,000 $495,000 $1,600,000 $2,400,000
Outfield: $510,000 $7,000,000 $8,500,000
Find the salary mean, median, and mode for this team. If the highest salary was
removed, how much would the statistical measures change?
1
Mean: $2,655,555.56
Median: $1,600,000
Mode: $495,000
Both the mean and median would increase while the mode would not change.
Mean: $2,655,555.56
Median: $1,600,000
Mode: $495,000
All of the values would decrease.
Mean: $2,655,555.56
Median: $1,600,000
Mode: $495,000
Both the mean and median would decrease while the mode would not change.
Mean: $2,655,555.56
Median: $1,600,000
Mode: $495.000
All of the values would increase.

Math
StatisticsThe mathematical model C = 400x + 60,000 represents the cost in dollars a company has in manufacturing x items during a month. How many items were produced if costs reached $380,000?

Math
StatisticsSixty five percent of adults favor some kind of government control on the prices of medicines. What is the probability that the proportion of adults in a random sample of 500 who favor some kind of government control is between 0.59 and 0.62?

Math
StatisticsProblem: Mr. Zack, the founder of Facelook, recently announced that an average person spends about 60 minutes per day on social media. Assume that the time spent on the social networks is normally distributed with standard deviation 30 minutes. If you are considering the sampling distribution with sample size of 25 people who use social media, then what is the average of the sampling distribution with sample size n = 25?

Math
StatisticsA recent poll of 2300 randomly selected 18-25-year-olds revealed that 266 currently use marijuana or hashish. According to a publication, 12.7% of 18-25-year-olds were current users of marijuana or hashish in 1997. Do the data provide sufficient evidence to conclude that the percentage of 18-25-year-olds who currently use marijuana or hashish has changed from the 1997 percentage of 12.7%? Use α = 0.01 significance level.
test statistic z =
positive critical z score
negative critical z score
The final conclusion is
A. There is sufficient evidence to conclude that the percentage of 18-25-year-olds who currently use marijuana or hashish has changed from the 1997 percentage of 12.7%.
B. There is not sufficient evidence to conclude that the percentage of 18-25-year-olds who currently use marijuana or hashish has changed from the 1997 percentage of 12.7%.

Math
StatisticsA new cream that advertises that it can reduce wrinkles and improve skin was subject to a recent study. A sample of 62 women over the age of 50 used the new cream for 6 months. Of those 62 women, 56 of them reported skin improvement(as judged by a dermatologist). Is this evidence that the cream will improve the skin of more than 60% of women over the age of 50? Test using a = 0.01.
test statistics 2 =
rejection region z >
The final conclusion is
A. We can reject the null hypothesis that p = 0.6 and accept that p > 0.6. That is, the cream can improve the skin of more than 60% of women over 50.
B. There is not sufficient evidence to reject the null hypothesis that p = 0.6. That is, there is not sufficient evidence to reject that the cream can improve the skin of more than 60% of women over 50.

Math
StatisticsThe five number summary of a dataset was found to be:
1, 7, 10, 14, 20
An observation is considered an outlier if it is below:
An observation is considered an outlier if it is above:

Math
StatisticsIn order to find the average speed of cars on Interstate 95, researchers set up an observational study on the side of the road. Researchers gathered a sample of 10 cars and found their average speed. They did this 100 times in order to create a sampling distribution. The range of speeds on the sampling distribution was 45 to 95 with a mean of 67. What was the margin of error?
67 miles per hour
25 miles per hour
14 miles per hour
70 miles per hour

Math
StatisticsThe National Association of Realtors estimates that 23% of all homes purchased in 2004 were considered investment properties. If a sample of 800 homes sold in 2004 is obtained what is the probability that at least 175 homes are going to be used as investment property?
0.2236
0.4821
0.5189
0.7764

Math
StatisticsProvide an appropriate response.
The average score of all golfers for a particular course has a mean of 70 and a standard deviation of 3.5. Suppose 49 golfers played the course today. Find the probability
that the average score of the 49 golfers exceeded 71.
0.0228
0.1293
0.3707
0.4772

Math
StatisticsProvide an appropriate response.
One year, professional sports players salaries averaged $1.9 million with a standard deviation of $0.9 million. Suppose a sample of 400 major league players was taken.
Find the approximate probability that the average salary of the 400 players exceeded $1.1 million.
approximately 0
0.2357
0.7357
approximately 1

Math
StatisticsFill in the blanks.
The
S=
The
S=
of a sample of n data values is denoted by s, which is defined as follows by the formula below.
......
of a sample of n data values is denoted by s, which is defined by the formula below.

Math
StatisticsHan is about to mow some lawns in his
neighborhood. His lawn mower has a 5-gallon
fuel tank, but Han is not sure how much
gasoline is in the tank.
He knows, however, that the lawn mower uses
0.4 gallon of gasoline per hour of mowing.
(0
What are all the possible values for a, the number of hours Han can mow without refilling the
lawn mower?
Write one or more inequalities to represent your response. Be prepared to explain or show
your reasoning.

Math
StatisticsA clinical trial was conducted to test the effectiveness of a drug used for treating insomnia in older subjects. After treatment with the drug, 28 subjects had a mean wake time of 90.2 min and a standard deviation of 42.1 min. Assume that the 28
sample values appear to be from a normally distributed population and construct a 90% confidence interval estimate of the standard deviation of the wake times for a population with the drug treatments. Does the result indicate whether the
treatment is effective?
Find the confidence interval estimate.
min<o<min
(Round to two decimal places as needed.)

Math
StatisticsIn a study, the sample is chosen by separating all cars by size, and selecting 10 of each size grouping
What is the sampling method?
Simple Random
Systematic
Stratified
Cluster
Convenience

Math
StatisticsThe number of pounds of raspberries each customer picked at a U-pick berry farm is
shown.
3.5, 2.2, 2.8, 4.1, 4.5, 3.9, 1.7, 3.4, 4.2, 4.7, 5.2, 4.0, 3.3, 0.6
Which measure or measures of central tendency best reflect the data?
Select EACH correct answer.
mean
mode
median

Math
StatisticsThe level of nitrogen oxides (NOX) in the exhaust of cars of a particular model varies Normally with mean 0.24 grams per mile (g/mi) and standard deviation 0.059 g/ml. Government regulations call for NOX emissions no higher than 0.26 g/ml.
What is the probability (±0.001) that a single car of this model fails to meet the NOX requirement?
A company has 15 cars of this model in its fleet. What is the probability (±0.001) that the average NOX level of these cars is above the 0.26 g/mi limit?

Math
Statistics17. Assume that SAT scores are normally distributed with mean = 1385 and standard
deviation =
150. If 16 scores are randomly selected, find the probability that their
mean score is greater than 1400.
Math
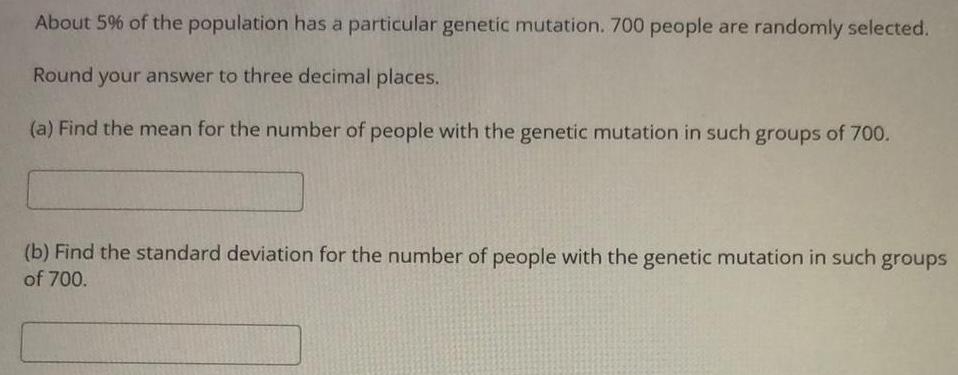
StatisticsAbout 5% of the population has a particular genetic mutation. 700 people are randomly selected.
Round your answer to three decimal places.
(a) Find the mean for the number of people with the genetic mutation in such groups of 700.
(b) Find the standard deviation for the number of people with the genetic mutation in such groups
of 700.
Math
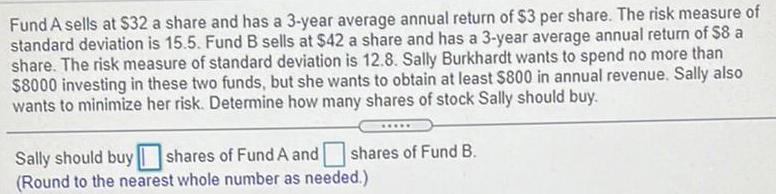
StatisticsFund A sells at $32 a share and has a 3-year average annual return of $3 per share. The risk measure of
standard deviation is 15.5. Fund B sells at $42 a share and has a 3-year average annual return of $8 a
share. The risk measure of standard deviation is 12.8. Sally Burkhardt wants to spend no more than
$8000 investing in these two funds, but she wants to obtain at least $800 in annual revenue. Sally also
wants to minimize her risk. Determine how many shares of stock Sally should buy.
*****
Sally should buy shares of Fund A and
(Round to the nearest whole number as needed.)
shares of Fund B.