Statistics Questions and Answers
Math
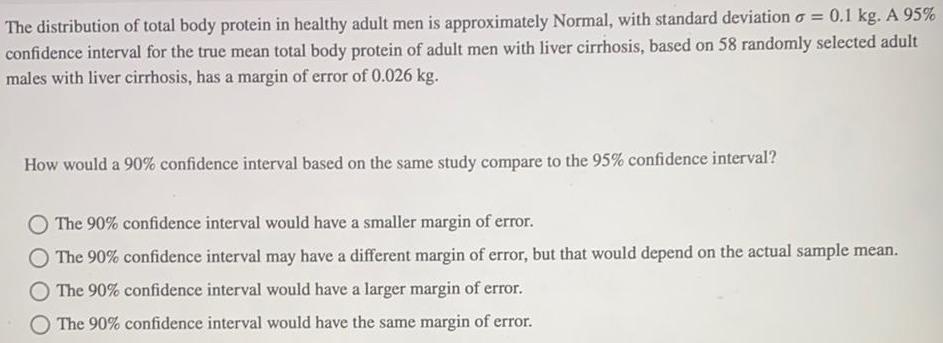
StatisticsThe distribution of total body protein in healthy adult men is approximately Normal, with standard deviation σ = 0.1 kg. A 95% confidence interval for the true mean total body protein of adult men with liver cirrhosis, based on 58 randomly selected adult males with liver cirrhosis, has a margin of error of 0.026 kg.
How would a 90% confidence interval based on the same study compare to the 95% confidence interval?
The 90% confidence interval would have a smaller margin of error.
The 90% confidence interval may have a different margin of error, but that would depend on the actual sample mean.
The 90% confidence interval would have a larger margin of error.
The 90% confidence interval would have the same margin of error.
Math
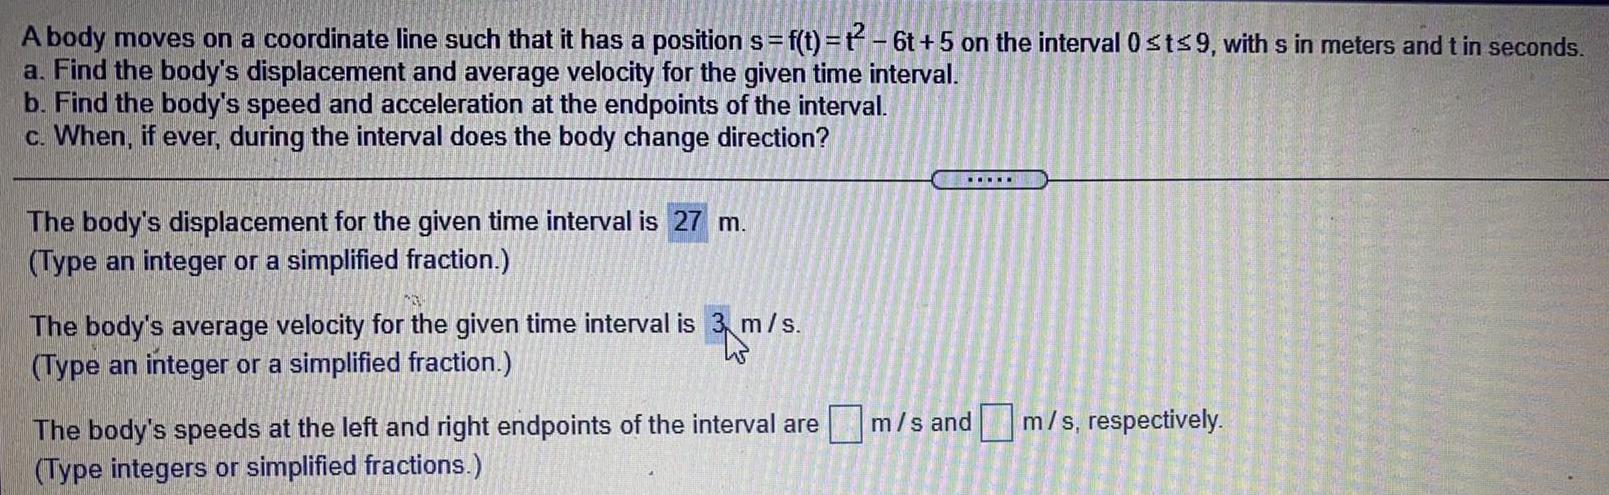
StatisticsA body moves on a coordinate line such that it has a position s= f(t)=t²-6t+5 on the interval 0 ≤t≤9, with s in meters and t in seconds.
a. Find the body's displacement and average velocity for the given time interval.
b. Find the body's speed and acceleration at the endpoints of the interval.
c. When, if ever, during the interval does the body change direction?
The body's displacement for the given time interval is m.
(Type an integer or a simplified fraction.)
The body's average velocity for the given time interval is m/s.
(Type an integer or a simplified fraction.)
The body's speeds at the left and right endpoints of the interval are m/s and m/s, respectively.
(Type integers or simplified fractions.)
▪▪▪▪▪

Math
StatisticsA theater is presenting a program on drinking and driving for students and their parents or other responsible adults. The proceeds will be donated to a local alcohol information center. Admission is $10.00 for adults and $5.00 for students. However, this situation has two constraints: The theater can hold no more than 150 people and for every two adults, there must be at least one student. How many adults and students should attend to raise the maximum
amount of money?
To raise the maximum amount of money, adults and students should attend.
Math
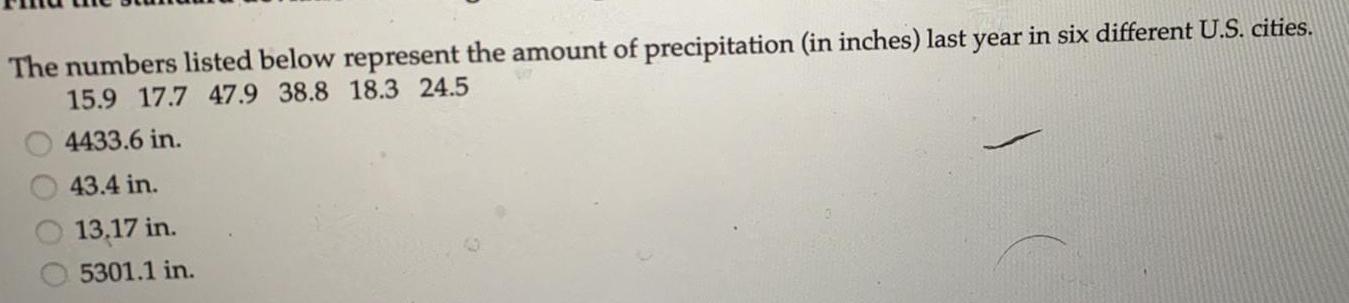
StatisticsThe numbers listed below represent the amount of precipitation (in inches) last year in six different U.S. cities. 15.9 17.7 47.9 38.8 18.3 24.5
4433.6 in.
43.4 in.
13.17 in.
5301.1 in.
Math
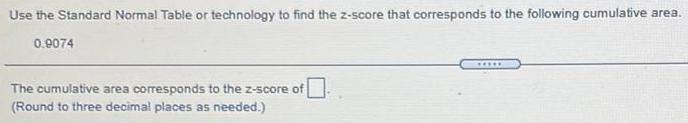
StatisticsUse the Standard Normal Table or technology to find the z-score that corresponds to the following cumulative area.
0.9074
The cumulative area corresponds to the z-score of
(Round to three decimal places as needed.)
*****
Math
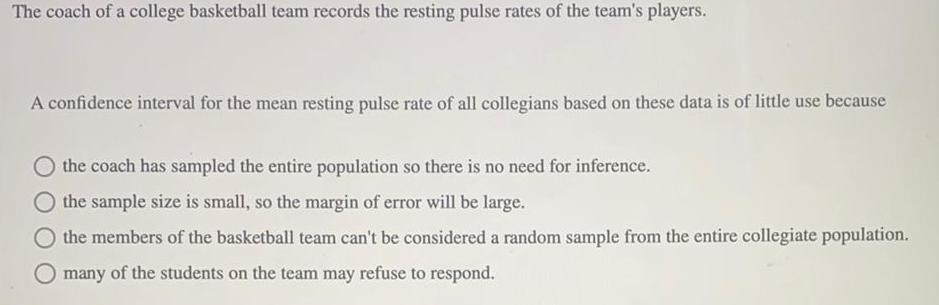
StatisticsThe coach of a college basketball team records the resting pulse rates of the team's players.
A confidence interval for the mean resting pulse rate of all collegians based on these data is of little use because
the coach has sampled the entire population so there is no need for inference.
the sample size is small, so the margin of error will be large.
the members of the basketball team can't be considered a random sample from the entire collegiate population.
many of the students on the team may refuse to respond.
Math
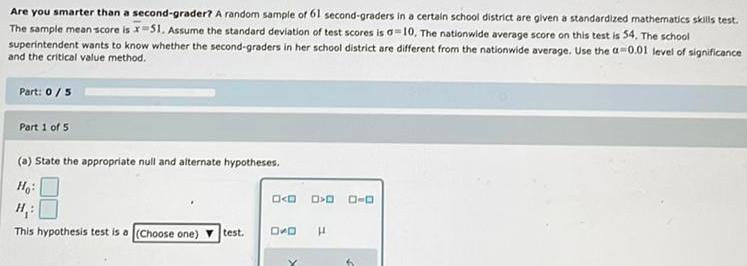
StatisticsAre you smarter than a second-grader? A random sample of 61 second-graders in a certain school district are given a standardized mathematics skills test. The sample mean score is x 51. Assume the standard deviation of test scores is a 10, The nationwide average score on this test is 54. The school superintendent wants to know whether the second-graders in her school district are different from the nationwide average. Use the a 0.01 level of significance and the critical value method.
Math
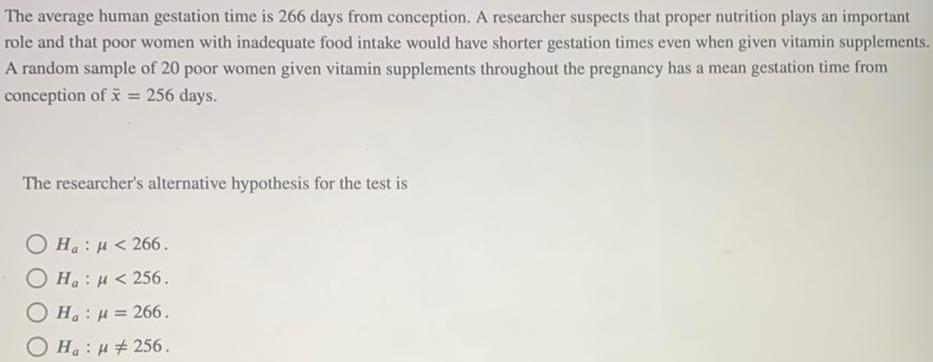
StatisticsThe average human gestation time is 266 days from conception. A researcher suspects that proper nutrition plays an important role and that poor women with inadequate food intake would have shorter gestation times even when given vitamin supplements. A random sample of 20 poor women given vitamin supplements throughout the pregnancy has a mean gestation time from
conception of x̄ = 256 days.
The researcher's alternative hypothesis for the test is
Ha: μ< 266.
Ha: μ <256.
Ha: μ = 266.
Ha: μ ≠ 256.
Math
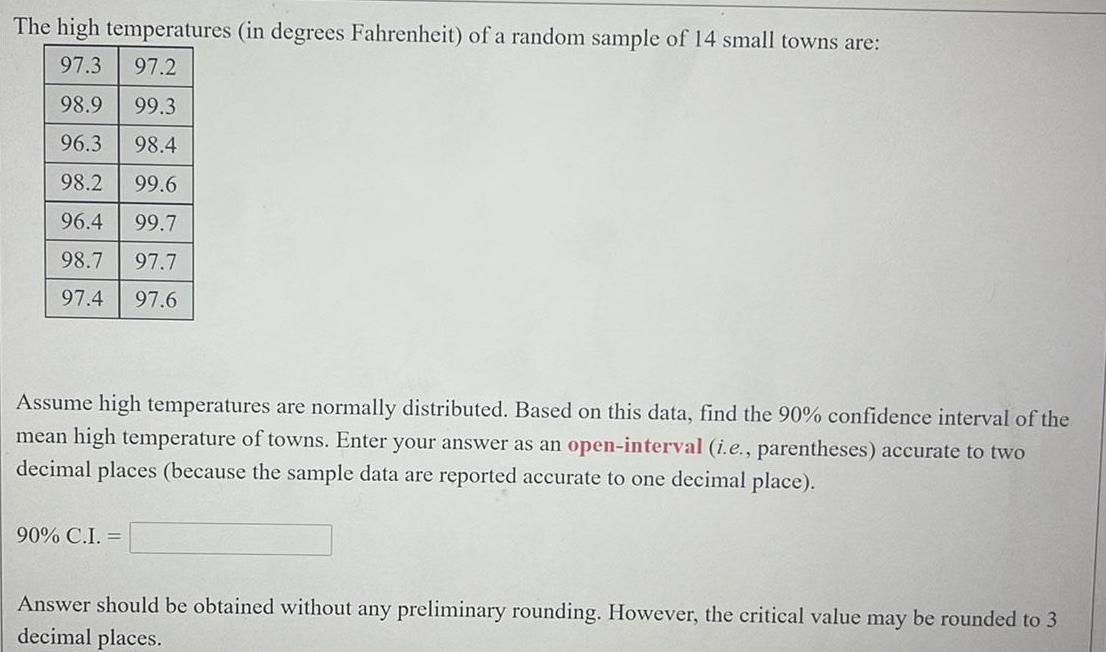
StatisticsThe high temperatures (in degrees Fahrenheit) of a random sample of 14 small towns are:
97.3 97.2
98.9 99.3
96.3 98.4
98.2 99.6
96.4 99.7
98.7 97.7
97.4 97.6
Assume high temperatures are normally distributed. Based on this data, find the 90% confidence interval of the mean high temperature of towns. Enter your answer as an open-interval (i.e., parentheses) accurate to two decimal places (because the sample data are reported accurate to one decimal place).
90% C.I. =
Answer should be obtained without any preliminary rounding. However, the critical value may be rounded to 3
decimal places.
Math
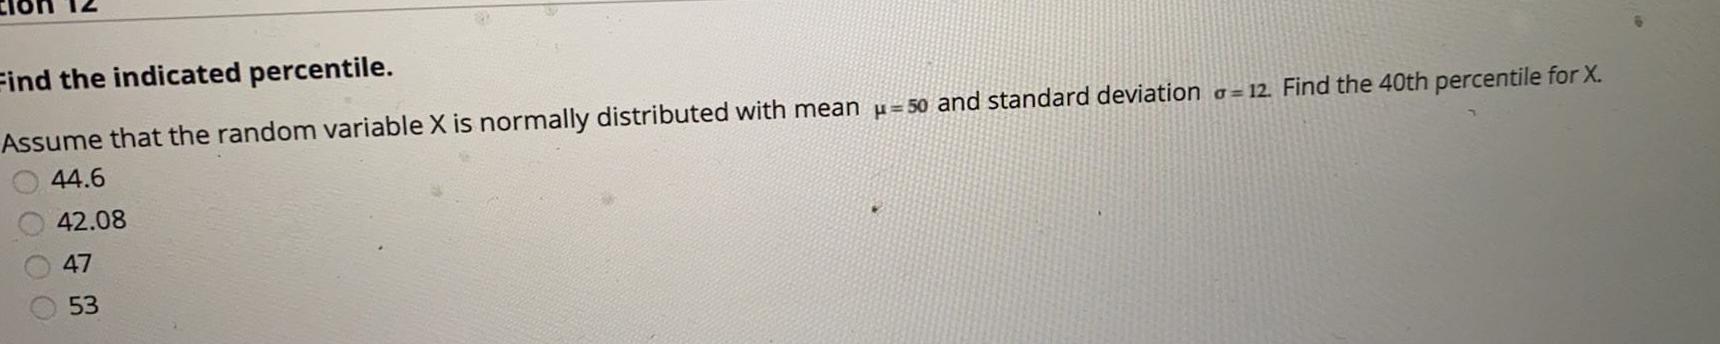
StatisticsFind the indicated percentile.
Assume that the random variable X is normally distributed with mean =50 and standard deviation = 12. Find the 40th percentile for X.
44.6
42.08
47
53
Math
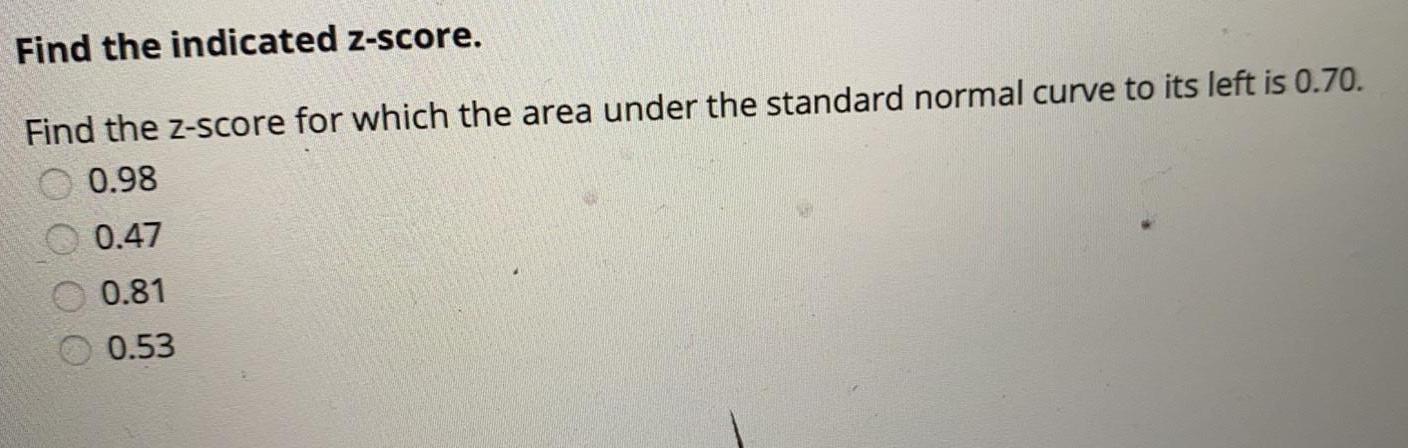
StatisticsFind the indicated z-score.
Find the z-score for which the area under the standard normal curve to its left is 0.70.
0.98
0.47
0.81
0.53
Math
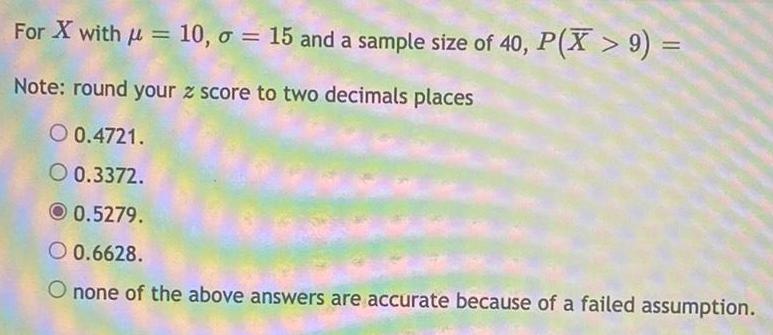
StatisticsFor X with μ = 10, σ = 15 and a sample size of 40, P(X > 9) =
Note: round your z score to two decimals places
0.4721.
0.3372.
.5279.
0.6628.
none of the above answers are accurate because of a failed assumption.
Math
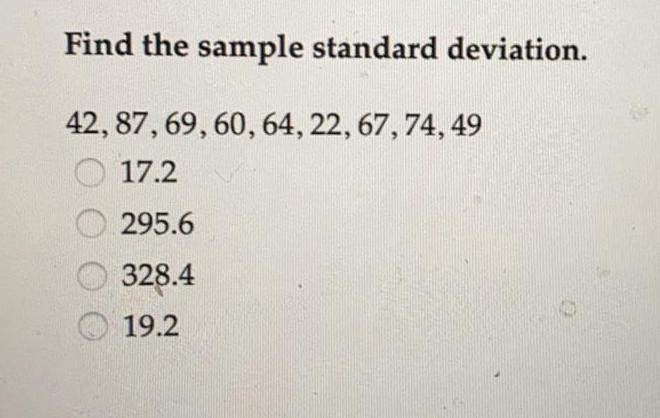
StatisticsFind the sample standard deviation.
42, 87, 69, 60, 64, 22, 67, 74, 49
17.2
295.6
328.4
19.2
Math
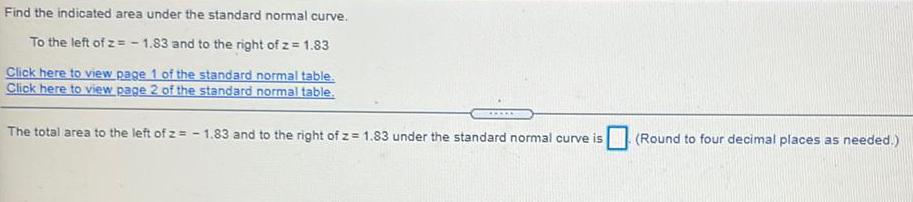
StatisticsFind the indicated area under the standard normal curve.
To the left of z= -1.83 and to the right of z = 1.83
Math
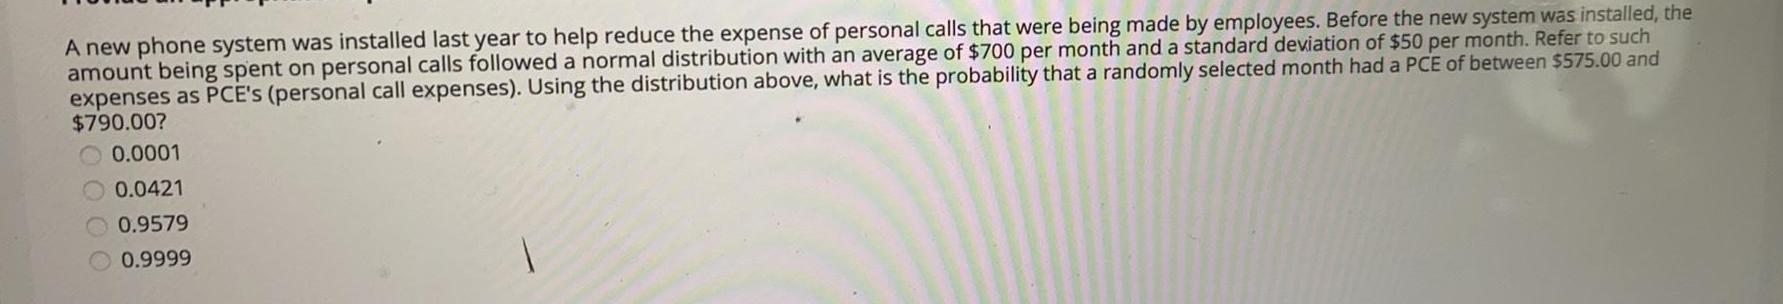
StatisticsA new phone system was installed last year to help reduce the expense of personal calls that were being made by employees. Before the new system was installed, the amount being spent on personal calls followed a normal distribution with an average of $700 per month and a standard deviation of $50 per month. Refer to such expenses as PCE's (personal call expenses). Using the distribution above, what is the probability that a randomly selected month had a PCE of between $575.00 and $790.00?
0.0001
0.0421
0.9579
0.9999
Math
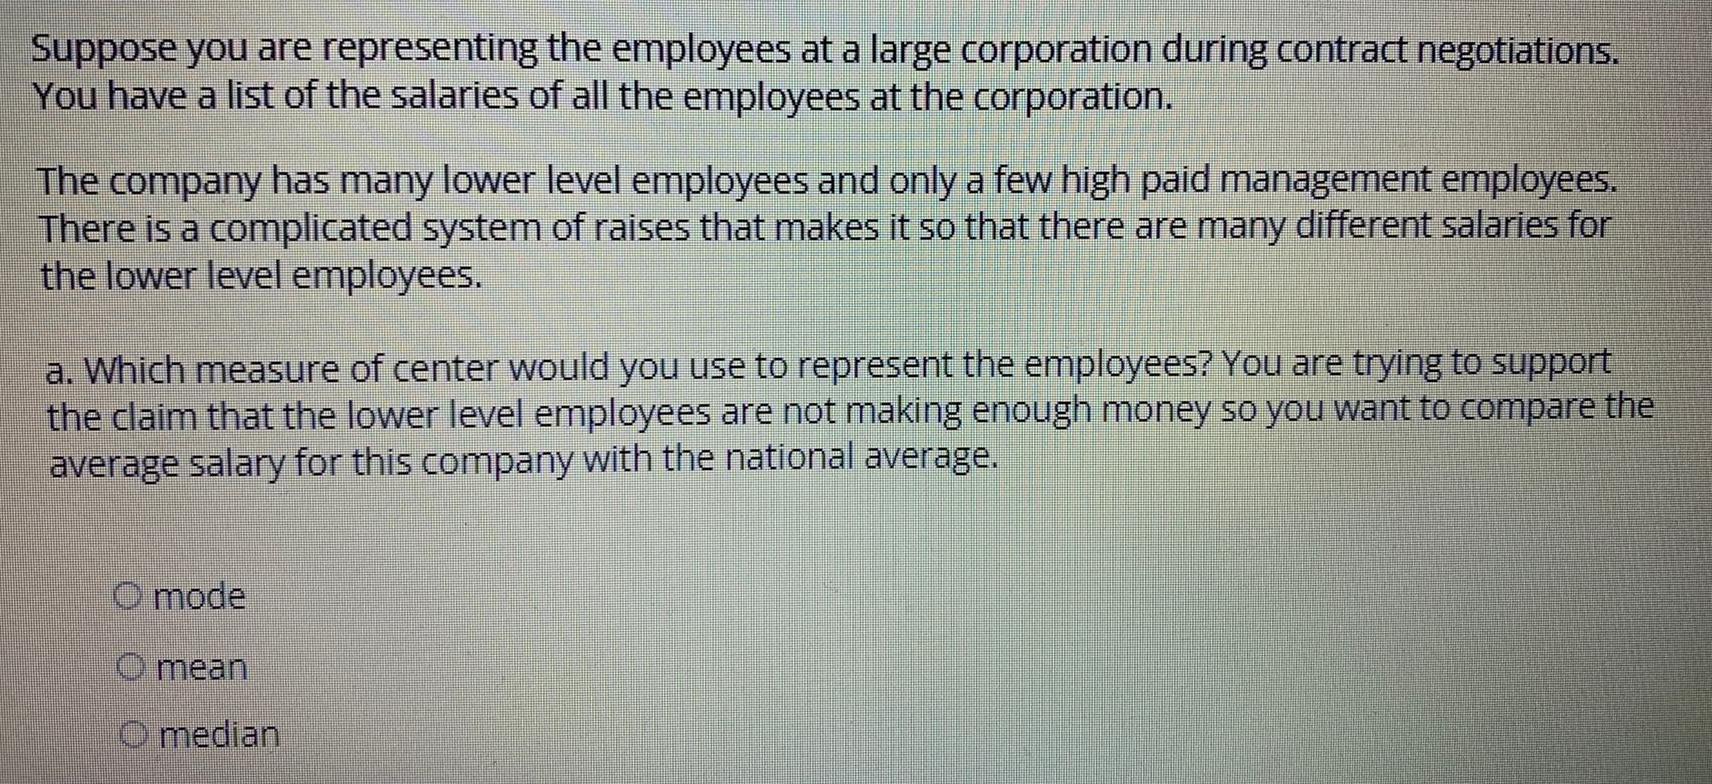
StatisticsSuppose you are representing the employees at a large corporation during contract negotiations. You have a list of the salaries of all the employees at the corporation. The company has many lower level employees and only a few high paid management employees. There is a complicated system of raises that makes it so that there are many different salaries for the lower level employees.
a. Which measure of center would you use to represent the employees? You are trying to support the claim that the lower level employees are not making enough money so you want to compare the average salary for this company with the national average.
Math
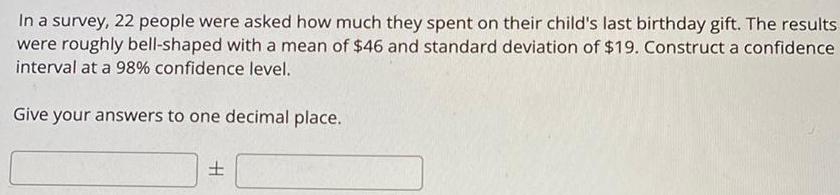
StatisticsIn a survey, 22 people were asked how much they spent on their child's last birthday gift. The results
were roughly bell-shaped with a mean of $46 and standard deviation of $19. Construct a confidence
interval at a 98% confidence level.
Give your answers to one decimal place.
±
Math
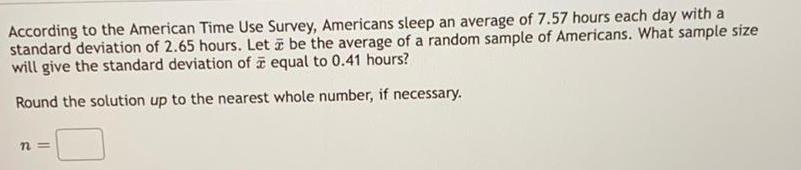
StatisticsAccording to the American Time Use Survey, Americans sleep an average of 7.57 hours each day with a
standard deviation of 2.65 hours. Let à be the average of a random sample of Americans. What sample size
will give the standard deviation of equal to 0.41 hours?
Round the solution up to the nearest whole number, if necessary.
n=
Math
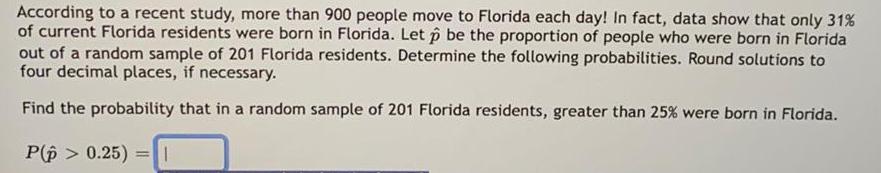
StatisticsAccording to a recent study, more than 900 people move to Florida each day! In fact, data show that only 31% of current Florida residents were born in Florida. Let p be the proportion of people who were born in Florida out of a random sample of 201 Florida residents. Determine the following probabilities. Round solutions to four decimal places, if necessary.
Find the probability that in a random sample of 201 Florida residents, greater than 25% were born in Florida.
Math
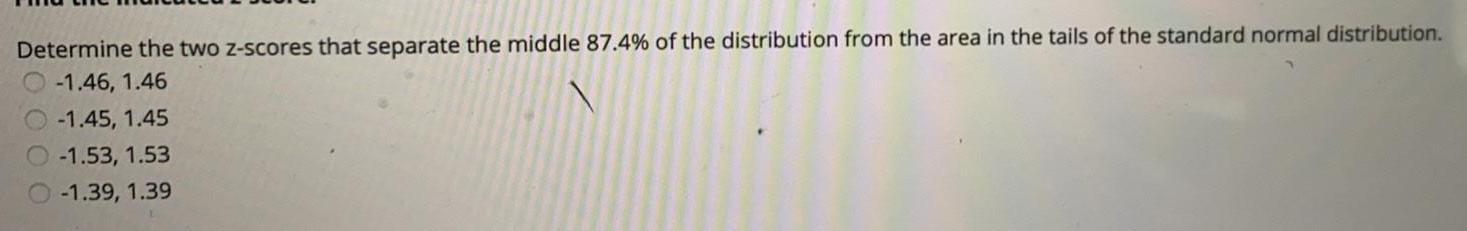
StatisticsDetermine the two z-scores that separate the middle 87.4% of the distribution from the area in the tails of the standard normal distribution.
-1.46, 1.46
-1.45, 1.45
-1.53, 1.53
-1.39, 1.39
Math
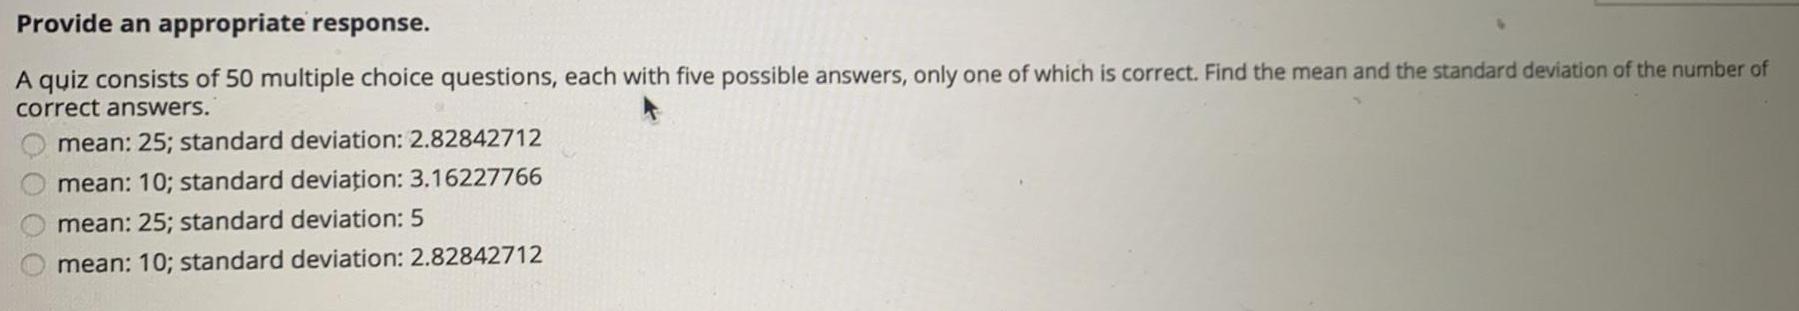
StatisticsA quiz consists of 50 multiple choice questions, each with five possible answers, only one of which is correct. Find the mean and the standard deviation of the number of
correct answers.
mean: 25; standard deviation: 2.82842712
mean: 10; standard deviation: 3.16227766
mean: 25; standard deviation: 5
mean: 10; standard deviation: 2.82842712
Math
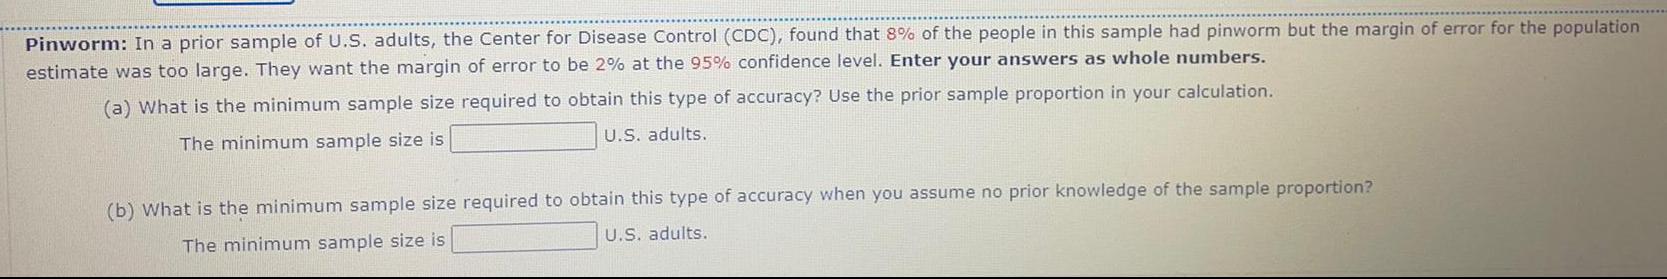
StatisticsIn a prior sample of U.S. adults, the Center for Disease Control (CDC), found that 8% of the people in this sample had pinworm but the margin of error for the population
estimate was too large. They want the margin of error to be 2% at the 95% confidence level. Enter your answers as whole numbers.
(a) What is the minimum sample size required to obtain this type of accuracy? Use the prior sample proportion in your calculation.
The minimum sample size is
U.S. adults.
(b) What is the minimum sample size required to obtain this type of accuracy when you assume no prior knowledge of the sample proportion?
U.S. adults.
The minimum sample size is
Math
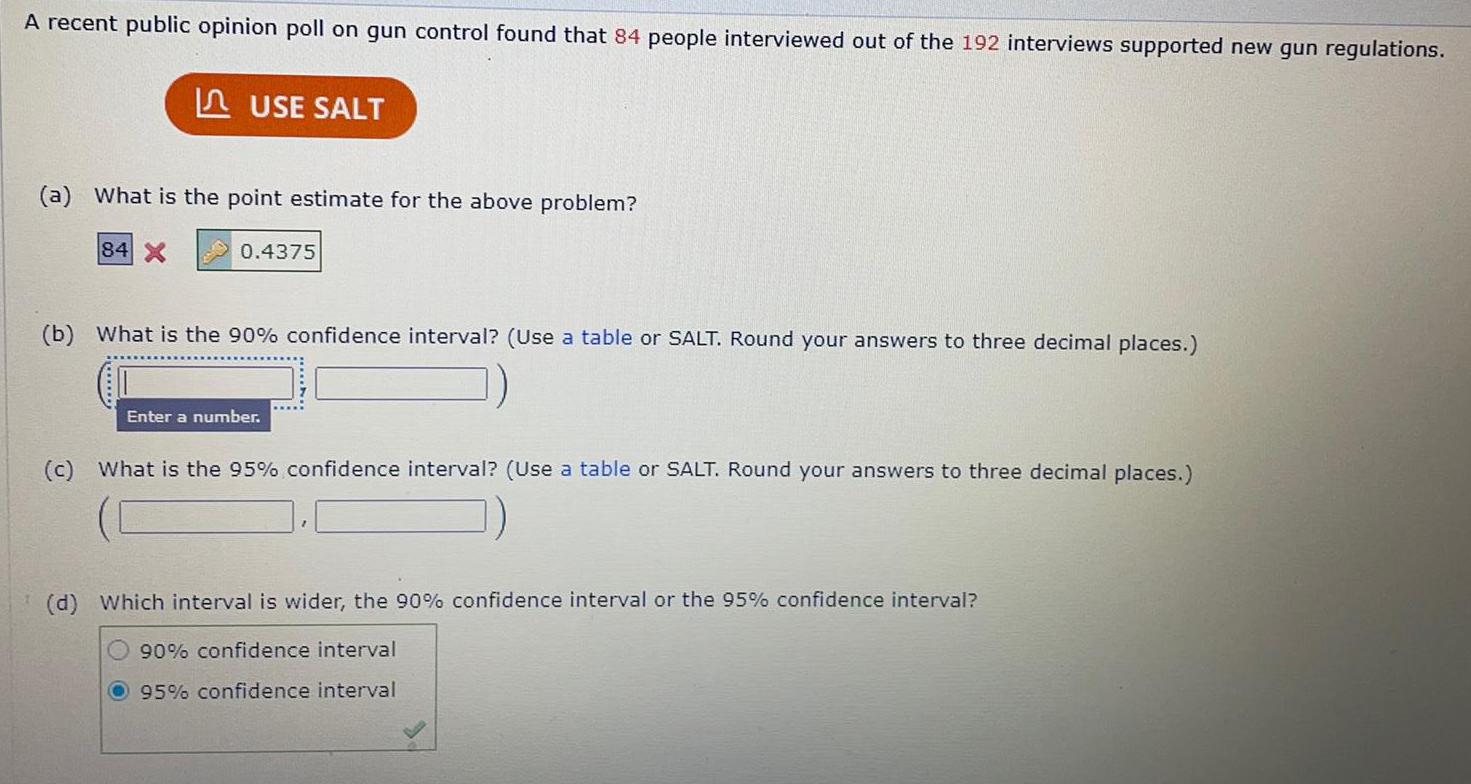
StatisticsA recent public opinion poll on gun control found that 84 people interviewed out of the 192 interviews supported new gun regulations.
(a) What is the point estimate for the above problem?
84 X
0.4375
(b) What is the 90% confidence interval? (Use a table or SALT. Round your answers to three decimal places.)
Enter a number.
(c) What is the 95% confidence interval? (Use a table or SALT. Round your answers to three decimal places.)
(d) Which interval is wider, the 90% confidence interval or the 95% confidence interval?
90% confidence interval
O95% confidence interval
Math
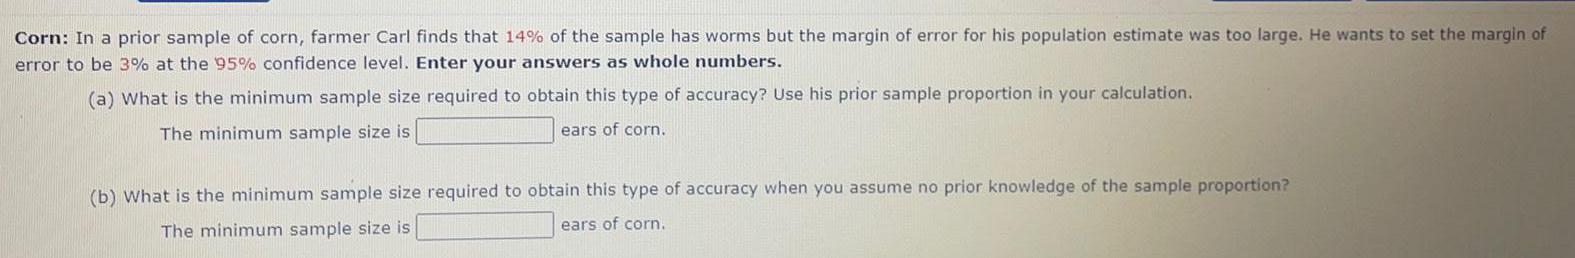
StatisticsIn a prior sample of corn, farmer Carl finds that 14% of the sample has worms but the margin of error for his population estimate was too large. He wants to set the margin of
error to be 3% at the 95% confidence level. Enter your answers as whole numbers.
(a) What is the minimum sample size required to obtain this type of accuracy? Use his prior sample proportion in your calculation.
The minimum sample size is
ears of corn.
(b) What is the minimum sample size required to obtain this type of accuracy when you assume no prior knowledge of the sample proportion?
The minimum sample size is
ears of corn.
Math
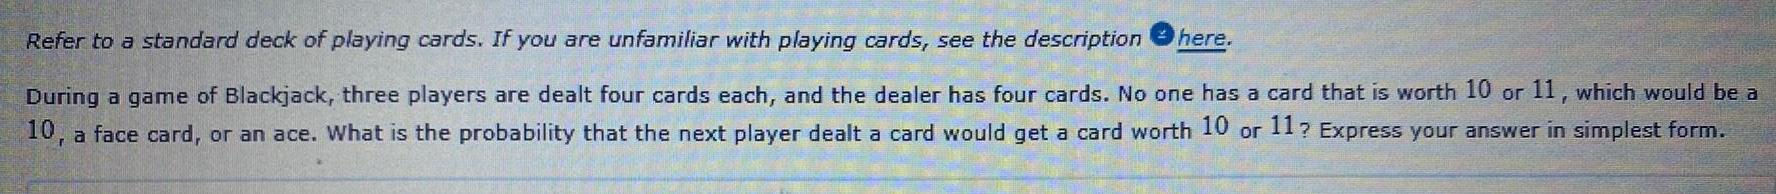
StatisticsRefer to a standard deck of playing cards. If you are unfamiliar with playing cards, see the description.
During a game of Blackjack, three players are dealt four cards each, and the dealer has four cards. No one has a card that is worth 10 or 11, which would be a
10, a face card, or an ace. What is the probability that the next player dealt a card would get a card worth 10 or 11? Express your answer in simplest form.
Math
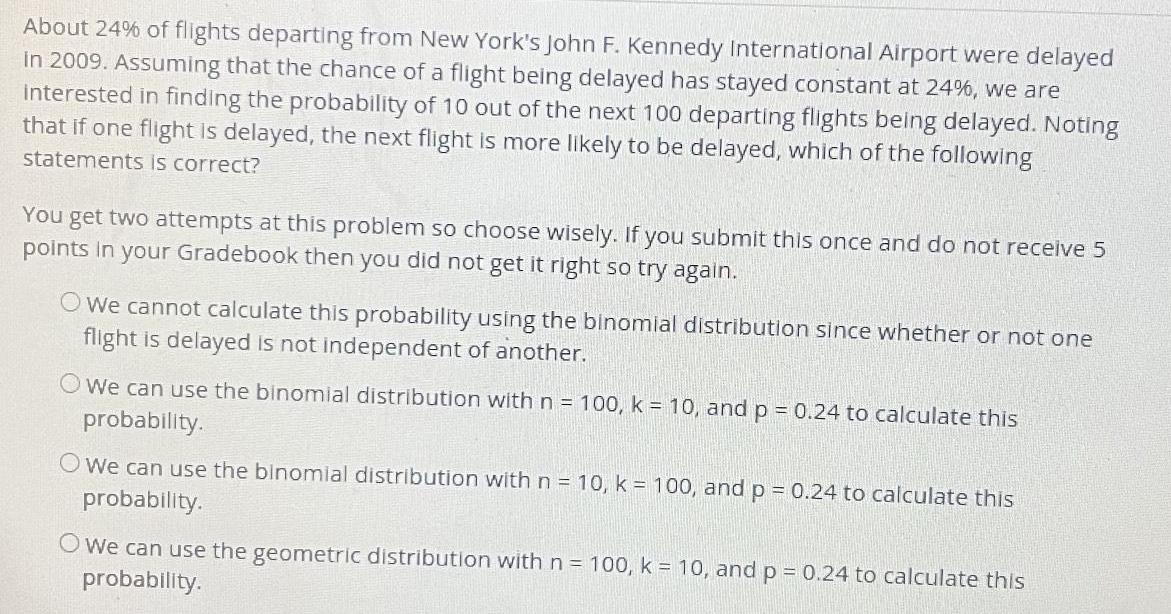
StatisticsAbout 24% of flights departing from New York's John F. Kennedy International Airport were delayed In 2009. Assuming that the chance of a flight being delayed has stayed constant at 24%, we are
interested in finding the probability of 10 out of the next 100 departing flights being delayed. Noting that if one flight is delayed, the next flight is more likely to be delayed, which of the following
statements is correct?
You get two attempts at this problem so choose wisely. If you submit this once and do not receive 5 points in your Gradebook then you did not get it right so try again.
we cannot calculate this probability using the binomial distribution since whether or not one
flight is delayed is not independent of another.
we can use the binomial distribution with n = 100, k = 10, and p = 0.24 to calculate this
probability.
we can use the binomial distribution with n = 10, k = 100, and p = 0.24 to calculate this
probability.
we can use the geometric distribution with n = 100, k = 10, and p = 0.24 to calculate this
probability.
Math
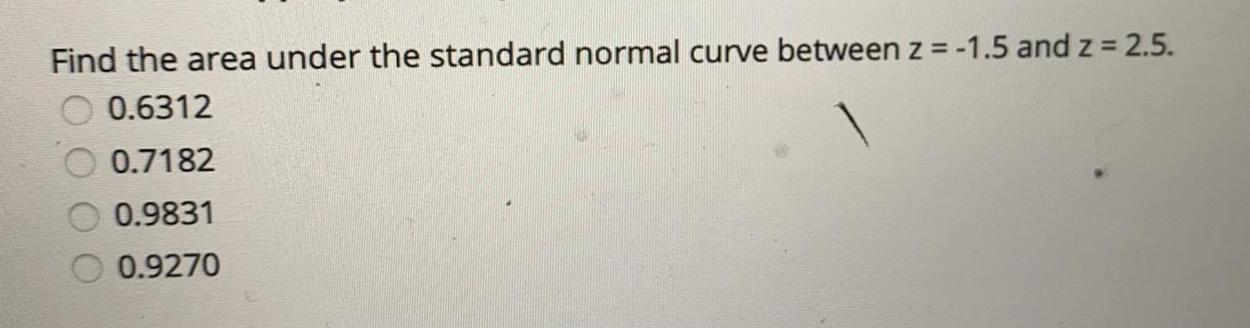
StatisticsFind the area under the standard normal curve between z = -1.5 and z = 2.5.
0.6312
0.7182
0.9831
0.9270
Math
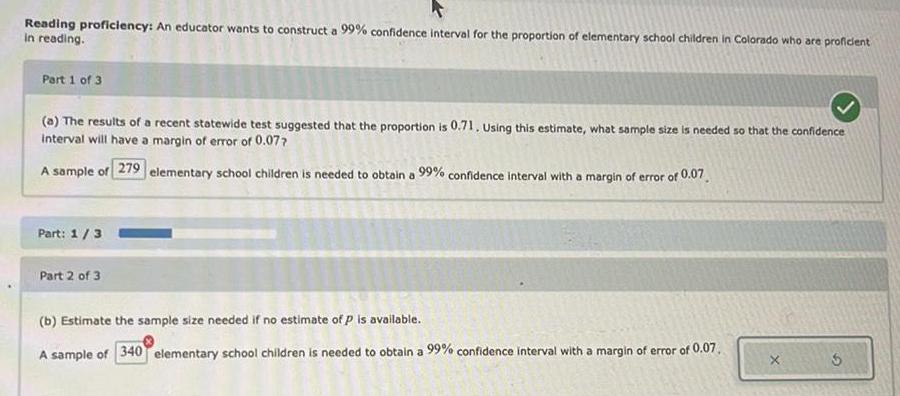
StatisticsReading proficiency: An educator wants to construct a 99% confidence interval for the proportion of elementary school children in Colorado who are proficient in reading.
Part 1 of 3
(a) The results of a recent statewide test suggested that the proportion is 0.71. Using this estimate, what sample size is needed so that the confidence interval will have a margin of error of 0.07 ?
A sample of elementary school children is needed to obtain a 99% confidence interval with a margin of error of 0.07.
Part: 1/3
Part 2 of 3
(b) Estimate the sample size needed if no estimate of P is available.
A sample of 340 elementary school children is needed to obtain a 99% confidence interval with a margin of error of 0.07.
Math
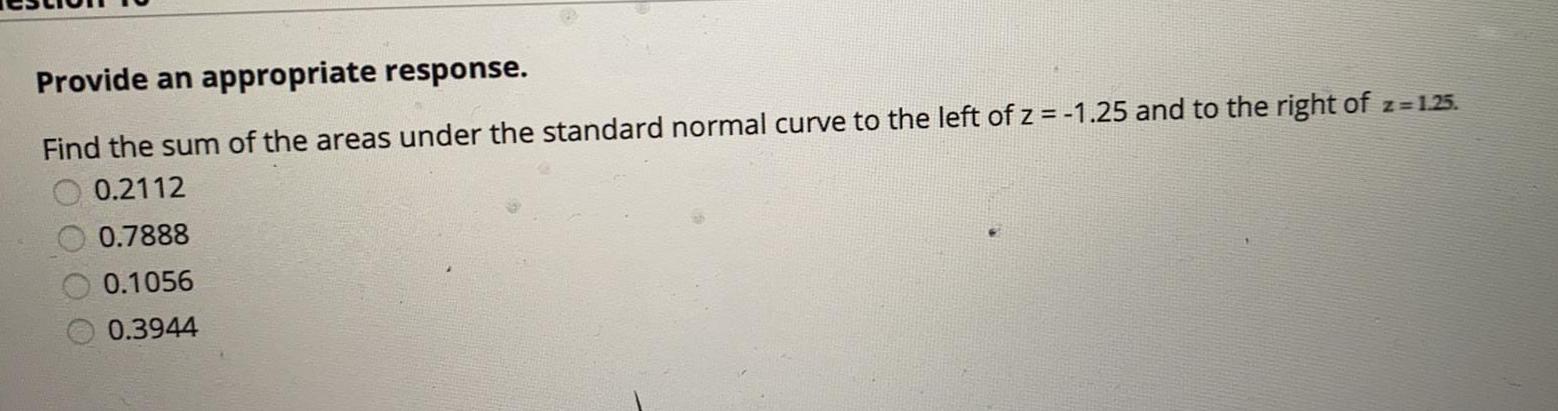
StatisticsFind the sum of the areas under the standard normal curve to the left of z = -1.25 and to the right of z=1.25.
0.2112
0.7888
0.1056
0.3944
Math
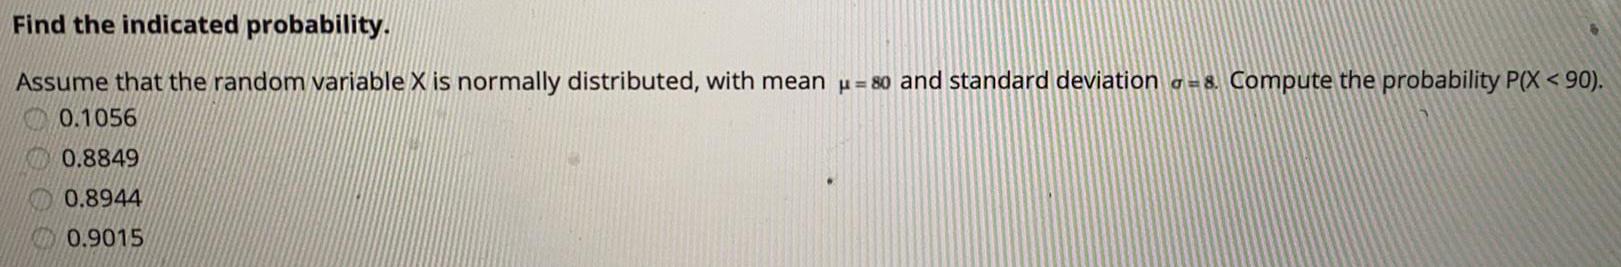
StatisticsAssume that the random variable X is normally distributed, with mean μ = 80 and standard deviation = 8. Compute the probability P(X <90).
0.1056
0.8849
0.8944
0.9015
Math
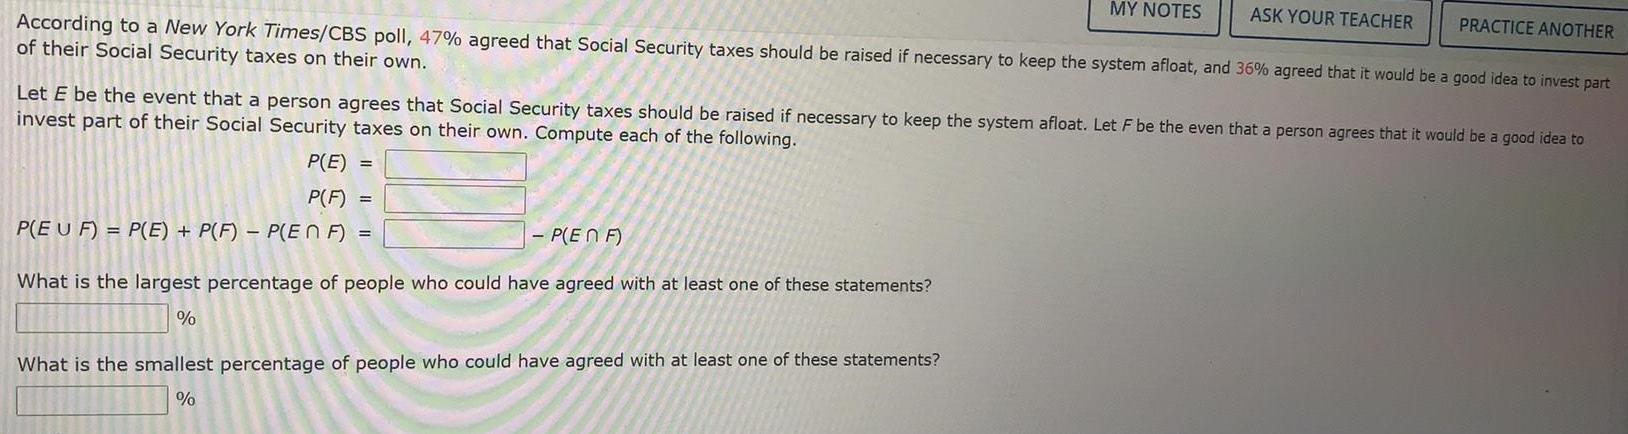
StatisticsAccording to a New York Times/CBS poll, 47% agreed that Social Security taxes should be raised if necessary to keep the system afloat, and 36% agreed that it would be a good idea to invest part
of their Social Security taxes on their own.
- P(EN F)
What is the largest percentage of people who could have agreed with at least one of these statements?
%
ASK YOUR TEACHER
What is the smallest percentage of people who could have agreed with at least one of these statements?
%
Let E be the event that a person agrees that Social Security taxes should be raised if necessary to keep the system afloat. Let F be the even that a person agrees that it would be a good idea to
invest part of their Social Security taxes on their own. Compute each of the following.
P(E) =
P(F) =
P(EU F) = P(E) + P(F)- P(En F) =
PRACTICE ANOTHER
Math
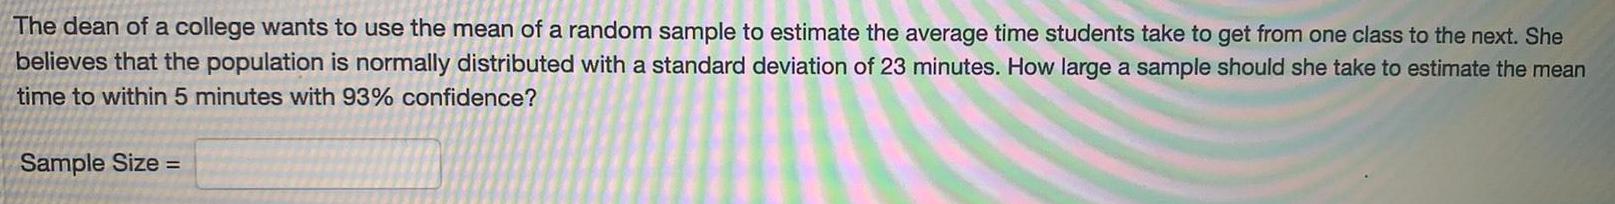
StatisticsThe dean of a college wants to use the mean of a random sample to estimate the average time students take to get from one class to the next. She believes that the population is normally distributed with a standard deviation of 23 minutes. How large a sample should she take to estimate the mean time to within 5 minutes with 93% confidence?
Sample Size =
Math
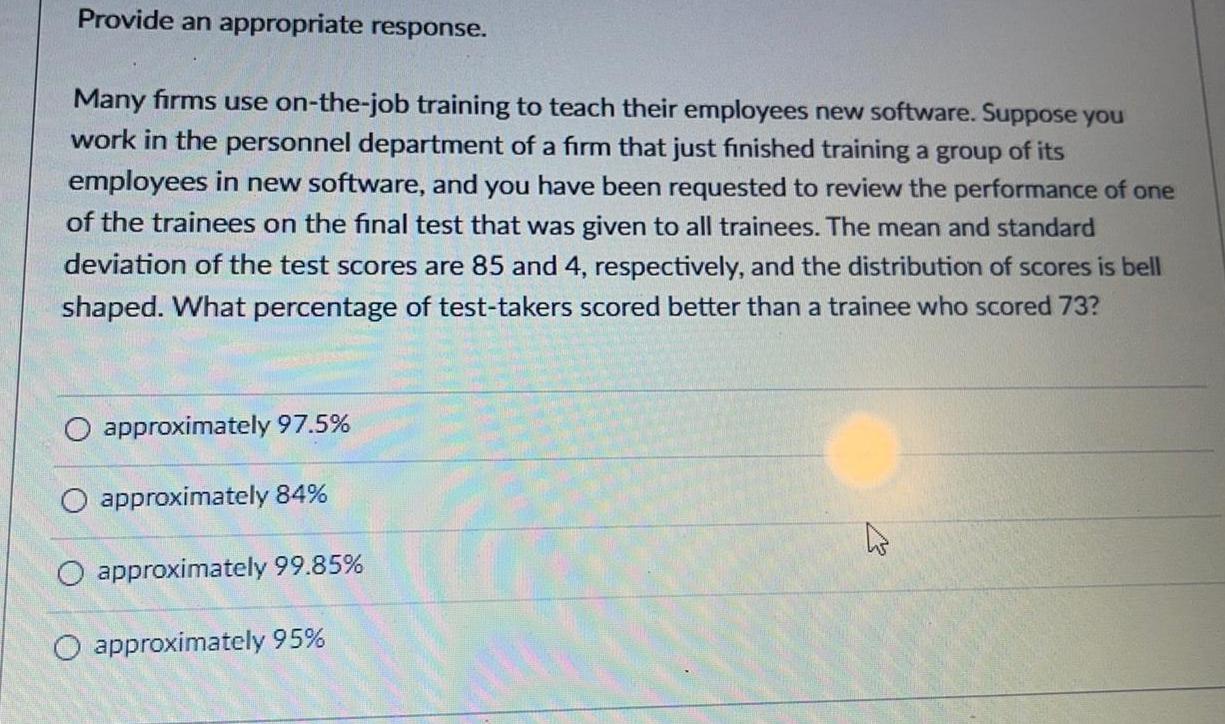
StatisticsProvide an appropriate response.
Many firms use on-the-job training to teach their employees new software. Suppose you
work in the personnel department of a firm that just finished training a group of its
employees in new software, and you have been requested to review the performance of one
of the trainees on the final test that was given to all trainees. The mean and standard
deviation of the test scores are 85 and 4, respectively, and the distribution of scores is bell
shaped. What percentage of test-takers scored better than a trainee who scored 73?
approximately 97.5%
approximately 84%
approximately 99.85%
approximately 95%
Math
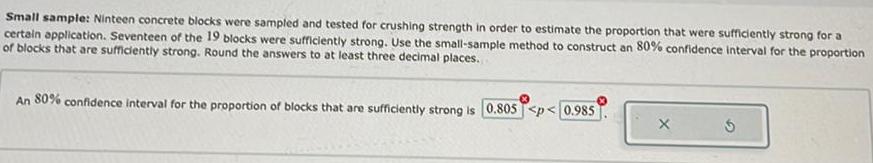
StatisticsSmall sample: Ninteen concrete blocks were sampled and tested for crushing strength in order to estimate the proportion that were sufficiently strong for a certain application. Seventeen of the 19 blocks were sufficiently strong. Use the small-sample method to construct an 80% confidence interval for the proportion of blocks that are sufficiently strong. Round the answers to at least three decimal places..
An 80% confidence interval for the proportion of blocks that are sufficiently strong is <p<
Math
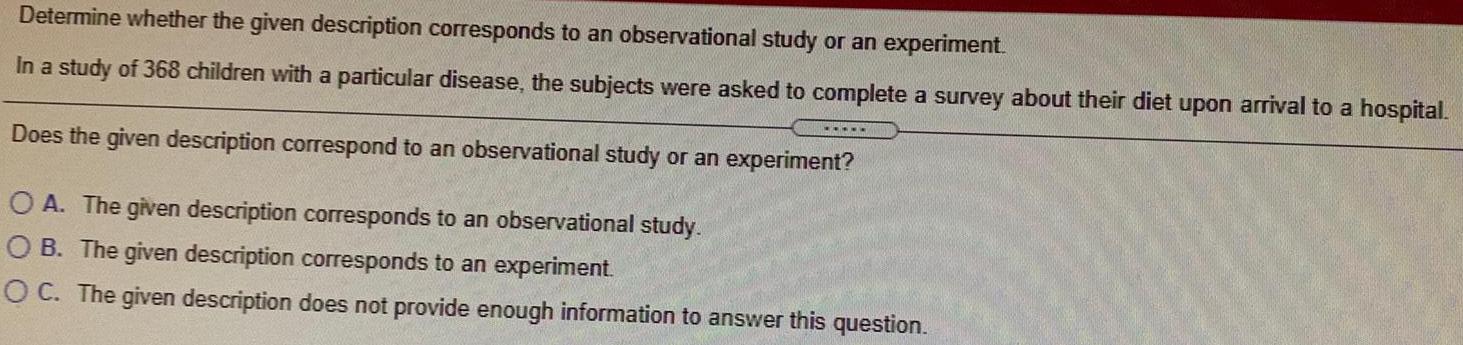
StatisticsDetermine whether the given description corresponds to an observational study or an experiment.
In a study of 368 children with a particular disease, the subjects were asked to complete a survey about their diet upon arrival to a hospital.
Does the given description correspond to an observational study or an experiment?
A. The given description corresponds to an observational study.
B. The given description corresponds to an experiment.
C. The given description does not provide enough information to answer this question.
Math
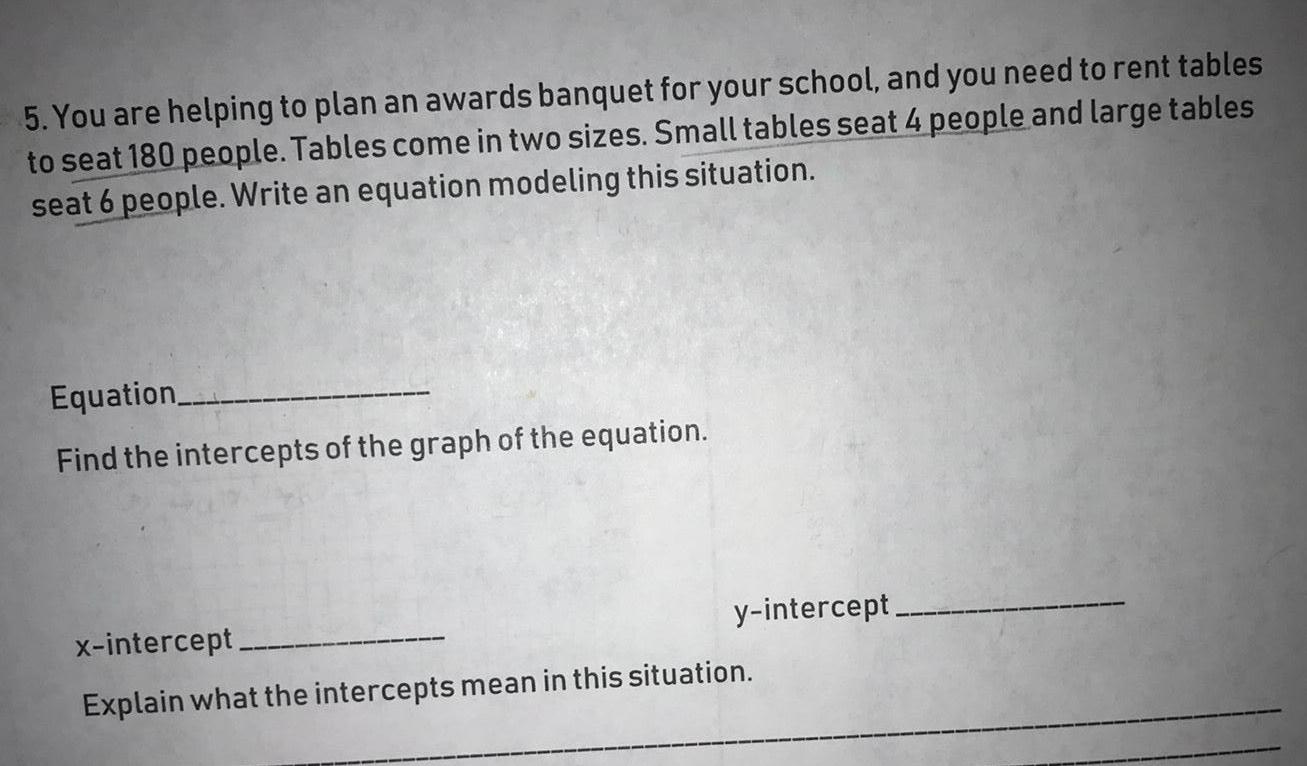
StatisticsYou are helping to plan an awards banquet for your school, and you need to rent tables to seat 180 people. Tables come in two sizes. Small tables seat 4 people and large tables seat 6 people. Write an equation modeling this situation.
Math
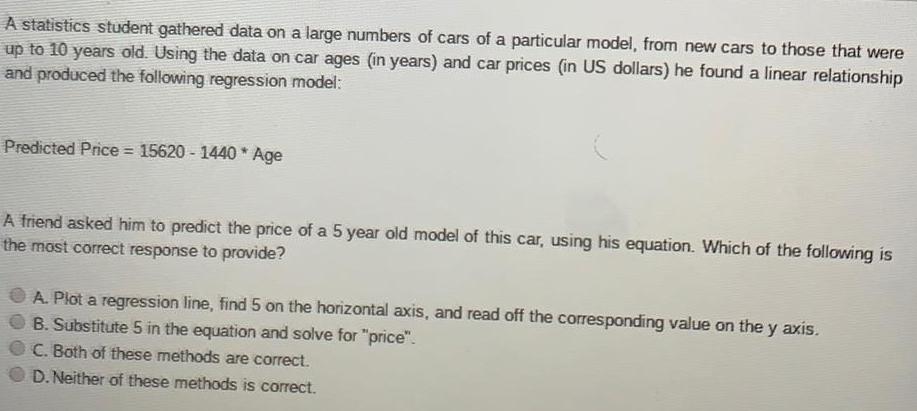
StatisticsA statistics student gathered data on a large numbers of cars of a particular model, from new cars to those that were up to 10 years old. Using the data on car ages (in years) and car prices (in US dollars) he found a linear relationship and produced the following regression model:
Predicted Price = 15620-1440* Age
A friend asked him to predict the price of a 5 year old model of this car, using his equation. Which of the following is the most correct response to provide?
A. Plot a regression line, find 5 on the horizontal axis, and read off the corresponding value on the y axis.
B. Substitute 5 in the equation and solve for "price".
C. Both of these methods are correct.
D. Neither of these methods is correct.
Math
StatisticsProblem Number Twelve: Suppose that weights of males in my family are N(250,24) where 250 and 24 are in pounds. I weigh 230 pounds. The percentage of males in my family that weigh more than me and less than my brother is 35%. How much does my brother weigh?

Math
StatisticsSamantha invested $2000 at 11 % to be compounded monthly. What will be the value of Samantha's investment in 3 years? Round your answer to the nearest cent, if necessary. Note: 365 days in a year and 30 days in a month.
Math
StatisticsAssume Z is a random variable with a standard normal distribution and d is a positive number. If
P(Z > d) = 0.15, then P(-d<Z<d) = 0.7.
True
False
Math
StatisticsIf a savings account of $8300 is compounded semi-annually at 12.49 % annual interest, how much will the account be worth in 52 months? Round your answer to the nearest cent, if necessary. Note: 365 days in a year and 30 days in a month.
Math
StatisticsA student was studying the relationship between how much money students spend on food and on entertainment per week. Based on a sample size of 270, he calculated a correlation coefficient (r) of .013 for these two variables. Which of the following is an appropriate interpretation?
A. This low correlation of .013 indicates there is no relationship.
B. There is no linear relationship but there may be a nonlinear relationship.
C. This correlation indicates there is some type of linear relationship.
Math
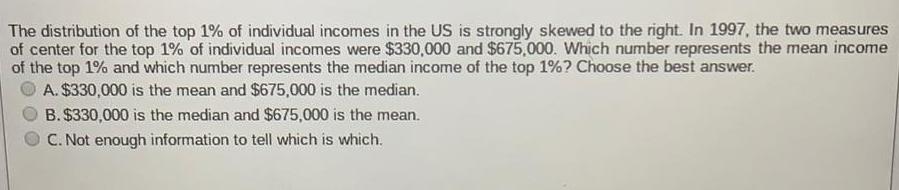
StatisticsThe distribution of the top 1% of individual incomes in the US is strongly skewed to the right. In 1997, the two measures of center for the top 1% of individual incomes were $330,000 and $675,000. Which number represents the mean income of the top 1% and which number represents the median income of the top 1%? Choose the best answer.
A. $330,000 is the mean and $675,000 is the median.
B. $330,000 is the median and $675,000 is the mean.
C. Not enough information to tell which is which.
Math
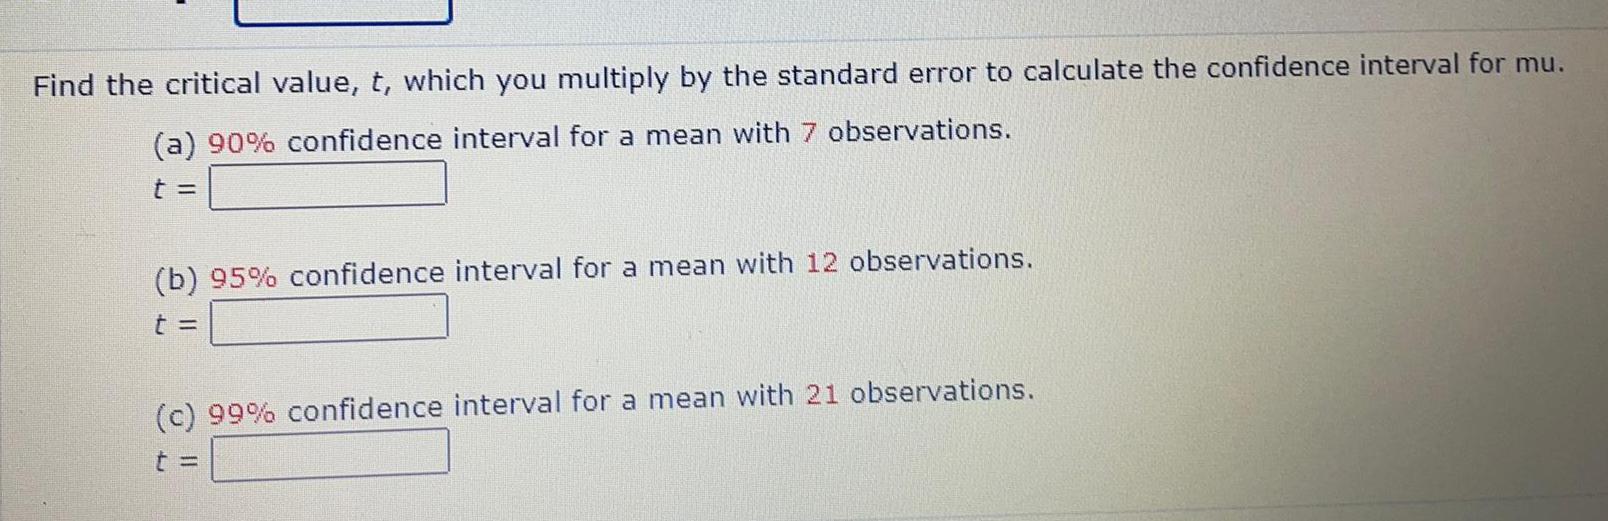
StatisticsFind the critical value, t, which you multiply by the standard error to calculate the confidence interval for mu.
(a) 90% confidence interval for a mean with 7 observations.
t =
(b) 95% confidence interval for a mean with 12 observations.
t =
(c) 99% confidence interval for a mean with 21 observations.
Math
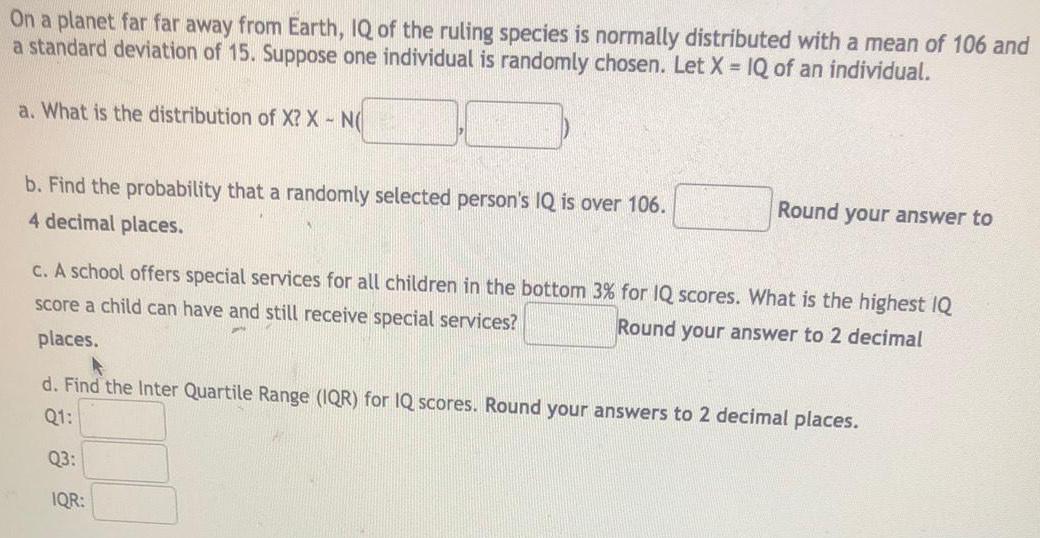
StatisticsOn a planet far far away from Earth, IQ of the ruling species is normally distributed with a mean of 106 and a standard deviation of 15. Suppose one individual is randomly chosen. Let X = IQ of an individual.
a. What is the distribution of X? X - N(
b. Find the probability that a randomly selected person's IQ is over 106.
c. A school offers special services for all children in the bottom 3% for IQ scores. What is the highest IQ score a child can have and still receive special services?
d. Find the Inter Quartile Range (IQR) for IQ scores. Round your answers to 2 decimal places.
Q1:
Q3:
IQR:
Math
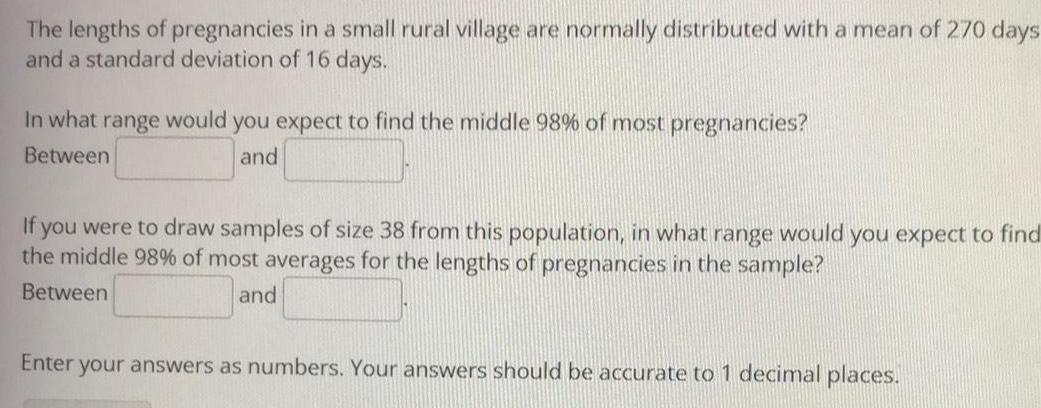
StatisticsThe lengths of pregnancies in a small rural village are normally distributed with a mean of 270 days and a standard deviation of 16 days.
In what range would you expect to find the middle 98% of most pregnancies?
If you were to draw samples of size 38 from this population, in what range would you expect to find
the middle 98% of most averages for the lengths of pregnancies in the sample?
Enter your answers as numbers. Your answers should be accurate to 1 decimal places.
Math
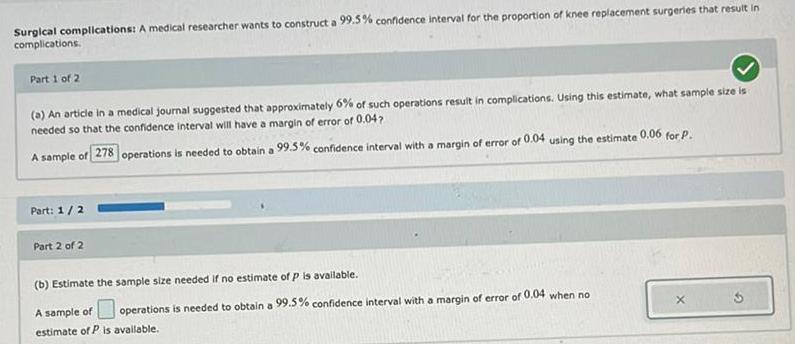
StatisticsSurgical complications: A medical researcher wants to construct a 99.5% confidence interval for the proportion of knee replacement surgeries that result in
complications.
Part 1 of 2
(a) An article in a medical journal suggested that approximately 6% of such operations result in complications. Using this estimate, what sample size is
needed so that the confidence interval will have a margin of error of 0.047
A sample of 278 operations is needed to obtain a 99.5% confidence interval with a margin of error of
Part: 1 / 2
Part 2 of 2
0.04 using the estimate 0.06 for P.
(b) Estimate the sample size needed if no estimate of p is available.
A sample of operations is needed to obtain a 99.5% confidence interval with a margin of error of 0.04 when no
estimate of P is available.
3
Math
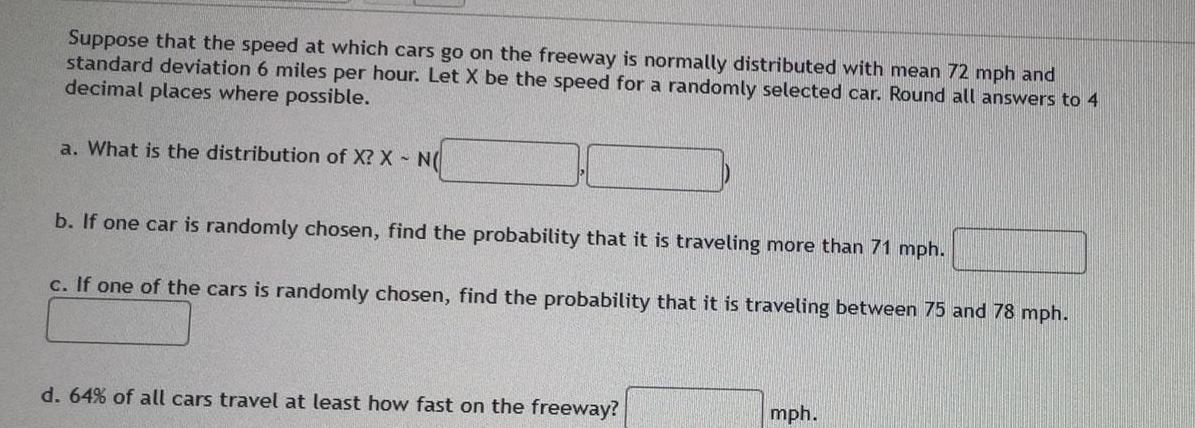
StatisticsSuppose that the speed at which cars go on the freeway is normally distributed with mean 72 mph and
standard deviation 6 miles per hour. Let X be the speed for a randomly selected car. Round all answers to 4
decimal places where possible.
a. What is the distribution of X? X - N
b. If one car is randomly chosen, find the probability that it is traveling more than 71 mph.
c. If one of the cars is randomly chosen, find the probability that it is traveling between 75 and 78 mph.
d. 64% of all cars travel at least how fast on the freeway?
mph.

Math
StatisticsTwenty nine concrete blocks were sampled and tested for crushing strength in order to estimate the proportion that were sufficiently strong for a certain application. Twenty seven of the 29 blocks were sufficiently strong. Use the small-sample method to construct a 95% confidence interval for the proportion of blocks that are sufficiently strong. Round the answers to at least three decimal places.

Math
StatisticsStacy invested $13,200 at 6 % to be compounded monthly. What will be the value of Stacy's investment in 3 years? Round your answer to the nearest cent, if necessary. Note: 365 days in a year and 30 days in a month.